OCEAN ENERGY TECHNOLOGIES
for RENEWABLE ENERGY GENERATION
AUGUST 2009
Peter MeisenPresident, Global Energy Network Institute (GENI)
www.geni.org
[email protected] (619)595-0139
Alexandre Loiseau
Research Associate, Global Energy Network Institute [email protected]
TABLE OF CONTENTS
TABLE OF CONTENTS ... 2
LIST OF FIGURES AND PICTURES ... 3
LIST OF TABLES ... 4
INTRODUCTION...4
1) TIDAL ENERGY ... 5
1.1) Tidal barrage methods... 5
1.1.1) Single basin barrage ... 5
1.1.2) Ebb generation mode ... 6
1.1.3) Double basin systems... 6
1.2) Marine current turbine ... 6
1.2.1) Axial turbines... 7
1.2.2) Vertical and horizontal axis cross-flow turbines ... 8
1.2.3) Venturi effect ... 8
1.2.4) Commercial plans ... 9
1.2.5) Potential sites ... 9
2) WAVE ENERGY ... 10
2.1) Types of wave energy technology ... 11
2.1.1) Oscillating Water Column (OWC) ... 11
2.1.2) The Pelamis... 12
2.1.3) The Wave Dragon ... 13
2.1.4) The Archimedes Wave Swing (AWS)... 14
2.1.5) The McCabe Wave Pump ... 15
2.1.6) The PowerBuoy ... 15
2.1.7) The AquaBuOY ... 16
3) Ocean Thermal Energy Conversion... 17
3.1) Types of OTEC technology ... 18
3.1.1) Closed-cycle... 18
3.1.2) Open-cycle ... 19
3.1.3) Hybrid cycle... 19
3.2) Applications ... 20
3.3) Perspectives... 20
4) FORECAST OF ALTERNATIVE ENERGY DEVELOPMENT ... 21
4.1) Renewable energy technology cost trends... 21
4.1.1) Wave ... 21
4.1.2) Ocean current ... 21
4.2) Renewable energy capacity expansion ... 22
4.3) Integration of electricity generation into transmission networks... 22
CONCLUSION ... 24
1) Tidal and wave power... 24
Advantages ... 24
Disadvantages... 24
2) OTEC ... 25
Advantages ... 25
APPENDIX ... 26
BIBLIOGRAPHY ... 27
LIST OF FIGURES AND PICTURES
Figure 1: Single basin barrage... 5Figure 2: Double basin systems ... 6
Figure 3: Schematic diagram of vertical axis turbine ... 8
Figure 4: Average annual wave power levels as kW/m of wave front ... 11
Figure 5: Schematic diagram of OWC ...……... 11
Figure 6: Schematic diagram 2 of OWC... 12
Figure 7: The Pelamis ... 12
Figure 8: Schematic diagram of the Wave Dragon ... 13
Figure 9: Schematic diagram of the AWS ………… ... 14
Figure 10: Schematic diagram of the McCabe Wave Pump ... 15
Figure 11: Schematic diagram of the PowerBuoy ……… ... 15
Figure 12: Schematic diagram of the AquaBuOY ……… ... 16
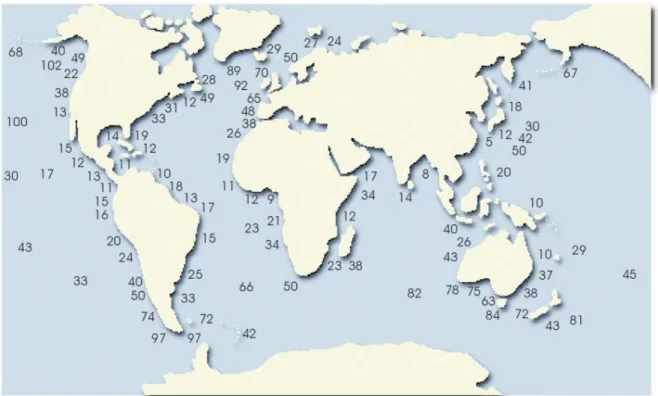
Figure 13: Map of temperature difference between surface and depth of 1000m ... 17
Figure 14: OTEC closed-cycle block diagram ... 18
Figure 15: OTEC open-cycle line diagram ... 19
Figure 16: Block diagram of all applications from OTEC technology ... 20
Figure 17: Futurist project based on OTEC technology ... 20
Picture 1:Systems used in shallow water ... 7
Picture 2: System used in deep water... 8
Picture 3: Vertical axis turbine in commissioning ... 8
Picture 4: OWC in operating ... 11
Picture 5: The wave Dragon in operating ... 13
Picture 6: The AWS in operating ... 14
Picture 7: The PowerBuoy in operating ... 15
Picture 8: The AquaBuOY in operating ... 16
Picture 9: OTEC plant in Hawaii ... 18
LIST OF TABLES
Table 1: Assumed Capital Costs for U.S. Offshore Wave Energy (2007)... 21Table 2: EPRI "Optimistic" Forecast of U.S. Wave Energy Capacity Development ... 22
Table 3: Preliminary OCS Development Forecast by Project Type/Region, 2008-2036 . 22 Table 4: Summary of manufacturers’ data... 26
INTRODUCTION
The oil crisis in the 1970s emphasized the need to find other solutions to satisfy the growing global demand of energy.
The world's oceans may eventually provide us with energy to power our homes and businesses. Right now, there are very few ocean energy power plants and most are fairly small. But how can we get energy from the ocean that will also be cost competitive? There are four basic ways to tap the ocean for its energy. We can use the ocean's waves; we can use the ocean's high and low tides; we can harness underwater currents; or we can use temperature differences in the water.
The most concrete example of this technology using ocean energy from the tides, located in La Rance, France, was inaugurated in 1966 and so promoted technologies from the ocean for more development.
At the moment, the use of ocean energy remains mainly at the prototype stage. Yet some companies have set up commercial scale products in the last few years; currently,
prototypes are no longer confined only to laboratories of universities. One of the recent achievements is the RITE Project on the East River – New York, NY. It is one proof of the ability to create profitable and sustainable projects.
1) TIDAL ENERGY
The tides
The tides are cyclic variations in the level of seas and oceans. In effect, the tides represent the planetary manifestation of the potential and kinetic energy fluxes present in the Earth–Moon–Sun system. This results in some regions of the world possessing substantially higher local tidal variation than others.
Use of the tides
There are two different means to harness tidal energy. The first is to exploit the cyclic rise and fall of the sea level using barrages and the second is to harness local tidal currents, analogous to wind power also called ‘marine current turbine.’
1.1) Tidal barrage methods
Currently several places in the world are producing electricity from tides. The biggest tidal barrage power plant is located in La Rance, France. It has been operating since 1966, generates 240MW. Thanks to a road crossing of the estuary, the financial profitability is guaranteed. Other operational barrage sites are in Nova Scotia (20MW), near Murmansk, Russia (0.4MW) and the Eastern seaboard of China (3.2MW).
Principle of operation
An estuary or bay with a large natural tidal range is artificially enclosed with a barrier. Electrical energy is produced by allowing water to flow from one side of the barrage to the other. To generate electricity, tides go through low-head turbines.
There are a variety of modes of operation. These can be broken down initially into single basin schemes or multiple basin schemes. The simplest of these are the single basin schemes.
1.1.1) Single basin barrage
It requires a single barrage across the estuary. That involves a combination of sluices which when open can allow water to flow relatively freely through the barrage and gated turbines. These gates can be opened to allow water to flow through the turbines to generate electricity.
1.1.2) Ebb generation mode
Ebb generation depends on the height of the tides. At high tide, water is retained behind the barrage by the sluices. At low tides, water flows reverse out through the turbine. 1.1.3) Double basin systems
Double basin systems allow for storage (adjusting the power output to demand of consumers). The main basin behaves like the Ebb generation mode.
Figure 2: Double basin systems
1.2) Marine current turbine
Tidal stream generators harness energy from currents generally in the same way as wind turbines. The higher density of water, 832 times the density of air, means that a single generator can provide significant power at low tidal flow velocities (compared with wind speed). Given that power varies with the density of medium and the cube of velocity, it is simple to see that water speeds of nearly one-tenth of the speed of wind provide the same power for the same size of turbine system. However, this limits the application in practice to places where the tide moves at speeds of at least 2 knots (1m/s), even close to neap tides (tide range is at a minimum).
Ocean current resources are likely limited to the Florida Current, which flows between Florida and the Bahamas. Estimates of the energy present in the Florida Current date back to the mid-1970s, when the use of this resource for electricity generation was first proposed. While these early studies indicate an energy flux potential of as much as 25,000 MW through a single cross-sectional area, the amount of energy that could be extracted is uncertain, primarily because of concerns that reducing the energy in this portion of the Gulf Stream could have negative environmental consequences. Early modeling suggested that an array of turbines totaling 10,000 MW of capacity would not reduce the current's speed by more than what has been observed as its natural variation, and thus might be feasible (Lissaman and Radkey 1979; Charlier and Justus 1993). Further investigation is required to determine the magnitude of the technically available resource.
Since tidal stream generators are an untested technology, no commercial scale production facilities are yet routinely supplying power; no standard technology has yet emerged. A large variety of designs are being experimented with, some very close to large scale deployment. Several prototypes have shown promise with many companies, but they have not operated commercially for extended periods to establish performances and rates of return on investments.
Two kinds of footings exist for the deep water installations. Conventionally the fixed systems are useful for shallow water sites, moored systems for deep water. The European Marine Energy Centre categorizes them under three headings.
1.2.1) Axial turbines
Axial turbines are close in concept to traditional windmills, operating under the sea and have the most prototypes currently operating. These include:
• Kvalsund, south of Hammerfest, Norway. Although still a prototype, a turbine with a reported capacity of 300 kW was connected to the grid on 13 Nov. 2003. • A 300 kW period flow marine current propeller type turbine — Seaflow — was
installed by Marine Current Turbines off the coast of Lynmouth, Devon, England, in 2003. The 11 meter diameter turbine generator was fitted to a steel pile which was driven into the seabed. As a prototype, it was connected to a dump load, not to the grid.
• Since April 2007, Verdant Power has been running a prototype project in the East River between Queens and Roosevelt Island in New York City; it was the first major tidal-power project in the United States. The strong currents pose
challenges to the design: the blades of the 2006 and 2007 prototypes broke off, and new reinforced turbines were installed in September 2008.
• Following the Seaflow trial, a full-size prototype, called SeaGen, was installed by Marine Current Turbines in Strangford Lough in Northern Ireland in April 2008. The turbine began to generate at full power of 1.2 MW in December, 2008, and was reported to have fed 150 kW into the grid for the first time on July 17, 2008. It is currently the only commercial scale device to have been installed anywhere in the world.
• Open Hydro, an Irish company exploiting the Open-Centre Turbine developed in the U.S., has a prototype being tested at the European Marine Energy Centre (EMEC), in Orkney, Scotland.
• A prototype semi-submerged floating tethered tidal turbine called Evopod has been tested since June 2008 in Strangford Lough, Northern Ireland at 1/10th scale. The company developing it is called Ocean Flow Energy Ltd, and they are based in the UK in Newcastle upon Tyne.
Picture 2: System used in deep water 1.2.2) Vertical and horizontal axis cross-flow turbines
Vertical and horizontal axis cross-flow turbines can be deployed either vertically or horizontally.
• The Gorlov turbine is a variant of a helical design which is being commercially piloted on a large scale in South Korea.
• Neptune Renewable Energy has developed Proteus which uses a barrage of vertical axis crossflow turbines for use mainly in estuaries.
• In late April 2008, Ocean Renewable Power Company, LLC (ORPC) successfully completed the testing of its proprietary turbine-generator unit (TGU) prototype at ORPC’s Cobscook Bay and Western Passage tidal sites near Eastport, Maine. The TGU is the core of the OCGen technology and utilizes advanced design cross-flow (ADCF) turbines to drive a permanent magnet generator located between the turbines and mounted on the same shaft. ORPC has developed TGU designs that can be used for generating power from river, tidal and deep water ocean currents.
Figure 3: Schematic diagram of vertical axis turbine Picture 3: Vertical axis turbine in commissioning 1.2.3) Venturi effect designs
The Venturi effect uses a shroud to increase the flow rate through the turbine. These can be mounted horizontally or vertically.
• The Australian company Tidal Energy Pty Ltd undertook successful commercial trials of highly efficient shrouded tidal turbines on the Gold Coast, Queensland in 2002. Tidal Energy has commenced a rollout of their shrouded turbine for a
remote community in northern Australia where there are some of the fastest water flows ever recorded (11 m/s, 21 knots) – two small turbines provide 3.5 MW. • Another larger 5 meter diameter turbine, capable of 800 kW in 4 m/s of flow, was
planned for deployment as a tidal powered desalination showcase near Brisbane, Australia in October 2008.
• Another device, the Hydro Venturi, was tested in San Francisco Bay. • Trials in the Strait of Messina, Italy, started in 2001 of the Kobold concept. 1.2.4) Commercial plans
The world's first commercial tidal stream generator — SeaGen — is in Strangford Lough. The strong wake demonstrates its power in the tidal current.
• RWE's npower announced that its partnership with Marine Current Turbines to build a tidal farm of SeaGen turbines off the coast of Anglesey in Wales. • In November 2007, British company Lunar Energy announced that, in
conjunction with E.ON, they would be building the world's first tidal energy farm off the coast of Pembrokshire in Wales. It will be the world's first deep-sea tidal-energy farm and will provide electricity for 5,000 homes.
• Eight underwater turbines, each 25 meters long and 15 meters high, are installed on the sea bottom off St. David's peninsula. Construction started in the summer of 2008, and the proposed tidal energy turbines, described as "a wind farm under the sea", should be operational by 2010.
• British Columbia Tidal Energy Corp. plans to deploy at least three 1.2 MW turbines in the Campbell River or in the surrounding coastline of British Columbia, Canada by 2009.
• The organization Alderney Renewable Energy Ltd is planning to use tidal
turbines to extract power from the notoriously strong tidal flows around Alderney UK in the Channel Islands. It is estimated that up to 3GW could be extracted. This would not only supply the island's needs but also allow a considerable surplus for export.
• Nova Scotia Power has selected OpenHydro's turbine for a tidal energy
demonstration project in the Bay of Fundy, Nova Scotia, Canada and Alderney Renewable Energy Ltd for the supply of tidal turbines in the Channel Islands. 1.2.5) Potential sites
As with wind power, selection of location is critical for use with the tidal turbines. Tidal stream systems need to be located in areas with fast currents where natural flows are concentrated between obstructions, for example, at the entrances to bays and rivers, around rocky points, headlands, or between islands or other land masses. The following potential sites are under serious consideration:
- Pembrokeshire and River Severn in Wales.
- Kaipara Harbour and Cook Strait in New Zealand. - Bay of Fundy in Canada.
- East River in New York City and Piscataqua River in New Hampshire. - Golden Gate in the San Francisco Bay.
2) WAVE ENERGY
Ocean waves represent a form of renewable energy created by wind currents passing over open water. Capturing the energy of ocean waves in offshore locations has been
demonstrated as technically feasible. Also, basic research to develop improved designs of wave energy conversion (WEC) devices is being conducted in regions such as near the Oregon coast, which is a high wave energy resource (Rhinefrank 2005). Compared with other forms of offshore renewable energy, such as solar photovoltaic (PV), wind, or ocean current, wave energy is continuous but highly variable, although wave levels at a given location can be confidently predicted several days in advance.
As with many clean technologies, wave energy development began during the 70s, in response to that oil crisis. The problem with wave energy has been its low profitability, and so it has been difficult to reach commercial applicatiom. It is only since the mid-90s that these technologies have found a new lease from several small companies in Norway and the UK.
Wave energy represents a concentrated form of energy like solar energy. Solar power of 100W/m2 corresponds to over 1000kW/m2 of wave crest length. The power of waves depends on the wind; the most regular wind, and thus the most workable wave power, is generated between 30 and 60 degree of latitude. The largest potential is located in deep water. For example in UK, a wave loses two-third of its power when it reaches shallow water (at 20m). Topographic studies allow us to know the sea bed and thus to infer high potential areas; “hot spots” are concentrated on the shoreline. One other positive point is the congruence between production and consumption; the peak of production is observed during the winter as is the requirement for electricity.
Average annual wave power levels as kW/m of wave front are shown in Figure 4 below. The total annual average wave energy off the U.S. coastlines (including Alaska and Hawaii), calculated at a water depth of 60 m has been estimated (Bedard et al. 2005) at 2,100 Terawatt-hours (TWh) per year. Estimates of the worldwide economically recoverable wave energy resource are in the range of 140 to 750 TWh/yr for existing wave-capturing technologies that have become fully mature. With projected long-term technical improvements, this could be increased by a factor of 2 to 3. The fraction of the total wave power that is economically recoverable in U.S. offshore regions has not been estimated, but is significant even if only a small fraction of the 2,100 TWh/yr available is captured. (Currently, approximately 11,200 TWh/yr of primary energy is required to meet total U.S. electrical demand.) Wave energy conversion devices have the greatest potential for applications at islands such as Hawaii because of the combination of the relatively high ratio of available shoreline per unit energy requirement, availability of greater unit wave energies due to trade winds, and the relatively high costs of other local energy sources.
Figure 4: Average annual wave power levels as kW/m of wave front
2.1) Types of wave energy technology
Many systems have been developed. Some have stayed at the R&D stage while others work on the shoreline. Several ways to harness energy from waves have been developed and are described below.
2.1.1) Oscillating Water Column (OWC)
This device is based on the pressure of the enclosed air in a cavity (column of air). The pressure of air varies as a function of the level of water in this cavity. The higher the level of water, the greater the air pressure. The air located in the chamber is drained off
through a generator (Wells turbine). The advantage is that OWC can be used in both directions, ascent and descent of wave. However, the Wells turbine needs energy to get started. Two of these systems are placed in Scotland by Wavegen and in Australia. Each one represents 500kW.
Figure 6: Schematic diagram 2 of OWC
2.1.2) The Pelamis
The Pelamis system looks like a ‘sea snake.’ It is a succession of floated empty segments in 50m or more water depth. The segments are linked to each others by hinged joints. The energy is produced when a wave runs on the length of the systems. Joints, connected to pump oil and to a hydraulic generator (smoothing systems), allow movement between each section and produce electricity as the wave moves by.
Figure 7: The Pelamis • Main features about the Pelamis:
Overall length = 390x220m Diameter = 14000 m3
Overall power rating = 0.75MW Nominal wave power = 55kW/m Annual power production = 2.7GWh Water depth = >50m
2.1.3) The Wave Dragon
Figure 8: Schematic diagram of the Wave Dragon Picture 5:The wave Dragon in operating The wave dragon is a system that temporarily stores water in a reservoir before falling into a turbine; in this way it is transformed into electricity. The waves reach the reservoir by way of a ramp. After going through an alternator, the water is released to the source. This means of generation can be comparable to a dam with three steps: absorption, storage and power take off.
The design is very complex (requiring optimization of overtopping, adapting of mooring system, reducing the effect of wave force…). It utilizes the potential of waves directly and does not use the motion. On the other hand, this system has several advantages, especially its sturdiness. Like the Pelamis, this device does not need the shore and can be set up in ocean zones with high potential waves (with no losses of energy because of the coastal area), and even in extreme environments.
The Wave Dragon unit produces electricity corresponding to the average annual wave power map, to:
in a 24kW/m wave climate = 12 GWh/year in a 36kW/m wave climate = 20 GWh/year in a 48kW/m wave climate = 35 GWh/year in a 60kW/m wave climate = 43 GWh/year in a 72kW/m wave climate = 52 GWh/year
• Main features about the largest Wave Dragon: Width and length = 390x220m Reservoir = 14,000 m3
Rated power/unit = 11MW
Annual power production/unit = 35GWh Water depth = >30m
2.1.4) The Archimedes Wave Swing (AWS)
The Archimedes Wave Swing wave energy converter is a cylindrical buoy which is moored on the seabed. The working procedure is based on the principle of the float (Archimedes). The only moving part is an air-filled floater. Waves create an ‘up and down’ movement due to applied pressure on the floater which is located in a lower fixed cylinder. The buoyancy is ensured by the pressure and depression applied on the air-filled chamber. Thanks to a linear generator based in the cylinder, this movement is converted into electricity and then transmitted to the shore.
Furthermore, the following characteristics are required for optimal use:
*Location exposed to ocean swells - e.g. western coast of British Isles, Ireland, France, Spain or Portugal
*40 - 100m of water depth outside of main commercial shipping lanes *Secure electricity power grid onshore
*Industrial port within 12 hours sailing time *Sea-bed suitable for laying power cables to shore
Each unit is currently rated at 1.2 Megawatts, equal to the electrical demand of
approximately 500 households’ energy. The first AWS machine was installed off Orkney in 2007 by AWS Ocean Energy with eventual plans to create a 100-machine wave park at a cost of £250 million.
2.1.5) The McCabe Wave Pump
The McCabe Wave Pump has three pontoons linearly hinged together and pointed parallel to the wave direction. The center pontoon is attached to a submerged damper plate, which causes it to remain still relative to fore and aft pontoons. Hydraulic pumps attached between the center and end pontoons are activated as the waves force the end pontoons up and down. The pressurized hydraulic fluid can be used to drive a motor generator (rated at 250–500 kW) or to pressurize water for desalinization. A full-size 40m prototype was tested off the coast of Ireland in 1996, and commercial devices are being offered by the manufacturer.
Figure 50: Schematic diagram of the McCabe Wave Pump 2.1.6) The PowerBuoy
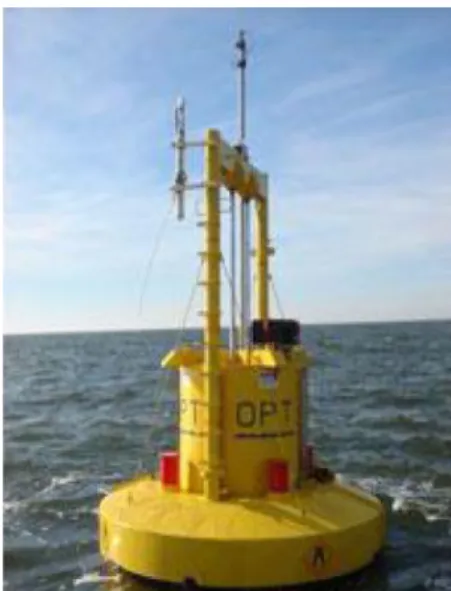
The device is a prototype system including a submerged buoy (1m below the level of water). Inside the buoy, a piston follows the movement of the waves’ rise and fall to output energy from the internal generator (immobile part). Then electricity is sent to shore by an underwater cable as is the case with all previous devices.
In 2005, a demonstration unit was set up and rated 40kW. In 2007, a commercial-scale system was planned in Spain for 1.25MW.
2.1.7) The AquaBuOY
The AquaBuOY™ Wave Energy Conversion is being developed by the AquaEnergy Group, Ltd. It is a point absorber that is the third generation of two Swedish designs that utilize wave energy to pressurize a fluid that is then used to drive a turbine generator. The vertical movement of the buoy drives a broad, neutrally buoyant disk acting as a water piston contained in a long tube beneath the buoy. The water piston motion in turn
elongates and relaxes a hose containing seawater, and the change in hose volume acts as a pump to pressurize the seawater.
The AquaBuOY design has been tested using a full-scale prototype, and a 1-MW pilot offshore demonstration power plant is being developed offshore at Makah Bay,
Washington. The Makah Bay demonstration will include four units rated at 250 kW placed 5.9 km (3.2 nautical miles) offshore in water approximately 46 meters deep.
3) Ocean Thermal Energy Conversion
Before beginning a description of ocean thermal energy conversion systems, a few features are needed to better understand the potential of this technology.
On an average day, 60 million square kilometers (23 million square miles) of tropical seas absorb an amount of solar radiation equal in heat content to about 250 billion barrels of oil. If less than one tenth of one percent of this stored solar energy could be converted into electric power, it would supply more than 20 times the total amount of electricity consumed in the United States on any given day.
Ocean thermal energy conversion (OTEC) is a method which consists of extracting energy from the difference in temperature between shallow and deep waters by way of a heat engine. The biggest difference in temperature (around 20 degrees Celsius, generally located near the equator or tropics), between a heat and cold source provides the greatest amount of potential energy. Thus, the main technical challenge is to generate the most amount of power from a small temperature ratio.
Figure 7: Map of temperature difference between surface and depth of 1000m
Compared with technologies such as wave energy, the energy available from OTEC is one or two orders of magnitude higher. But the thermal efficiency is very low; the theoretical maximum efficiency is 6 or 7%. Furthermore, the extraction of energy is difficult and thus expensive (pumping material).
This technology, if it could be economically competitive with conventional power technologies, could output gigawatts of electrical power. Electrolysis could produce hydrogen to enhance energy output from the process of OTEC.
Picture 9: OTEC plant in Hawaii
3.1) Types of OTEC technology
Several options exist for OTEC technology depending of the location and the cycle used. Plants may be based on land, ocean shelf or floating facilities. The first two have the most advantages. Three kinds of cycles are used: the open cycle, the closed cycle and the hybrid cycle.
The main concept is the same for all systems. There is a heat engine placed between a high temperature and low temperature reservoir. As in a steam turbine, the engine converts heat energy into kinetic energy. To operate, the cold sea water is either pumped directly (can be more than one kilometer) or desalinated near the sea bed to then float up through a pipe to the surface.
3.1.1) Closed-cycle
This cycle uses a working fluid (with a low boiling point) which is cooled down and heated up in a full cycle. The warm water located at the surface is injected into a heat exchanger; the working fluid gets the heat to change its state, and is vaporized. The vapor is directed through the turbine and generator where the electricity is produced. Then the vapor is condensed by the deep cold water. The liquid goes back to the heat exchanger and so on. India has built a closed-cycle, floating plant of 1 MW rated power.
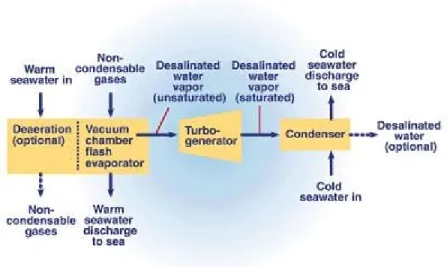
3.1.2) Open-cycle
The open-cycle process does not use an intermediate fluid like the closed-cycle but directly uses the sea water. It uses the warm surface in tropical seas.
The warm water is placed in a low-pressure container which carries out the evaporation. Like in others cycles, the steam is driven into the turbine attached to a generator. The second effect is the production of desalinated water (fresh water) through evaporation. The steam is condensed into liquid by the deep cold water. Contrary to the first cycle, the water is captured because it is now clean drinking water.
The latest open-cycle plant (May 1993) produced 50 kW of electricity in Hawaii.
Figure 9: OTEC open-cycle line diagram 3.1.3) Hybrid cycle
The last cycle proposes to combine both open and closed cycles. The warm water is vaporized in a vacuum chamber. The steam transforms working liquid into vapor (heat exchanger) which is directed in a turbine. As in the open-cycle the condensed water provides fresh water.
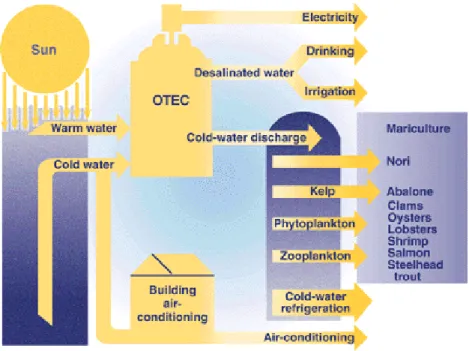
3.2) Applications for OTEC
As explained previously, the main goal of this system is to output electric power and, secondly, desalinated water (2-megawatt electric plant could produce about 4300 cubic meters of desalinated water each day) for some cycles. But OTEC technology offers others possibilities, like support for deep water mariculture (deep waters rich in nutrients) and air conditioning. It also can be used to produce ammonia (the working fluid),
hydrogen, aluminum, methanol and others chemicals.
Figure 10: Block diagram of all applications from OTEC technology
3.3) Perspectives
A competitive market could be a target in the next decade for OTEC plants.
The small island nations could benefit because the cost to generate power from diesel fuel is high; the supply of fresh water could also be an advantage. Essentially land-based, open-cycle or closed-cycle coupled with a desalinated process would be appropriate.
4) FORECAST OF ALTERNATIVE ENERGY DEVELOPMENT
4.1) Renewable energy technology cost trends
4.1.1) Wave
Given its relative immaturity and lack of development to date, far less work than in other renewables has been undertaken to project cost trends for wave energy technologies. However, it can be expected that they will eventually follow trajectories similar to those that have reduced the costs of onshore and offshore wind.
Bedard (2007) suggests that the progress ratio for wave energy technology will be 82% and that a 90 MW Pelamis project could achieve economic competitiveness with onshore wind at cumulative global capacities of 15 GW (for a Hawaii or northern California location), 20 GW (for an Oregon location), or 40 GW (for a Massachusetts location). Total capital costs for wave energy projects will certainly vary by technology. However, the only reliable estimate the study has for wave energy capital costs comes from Electric Power Research Institute’s (EPRI) assessment of a hypothetical commercial-scale project off the Oregon coast. This analysis assumes an array of 180 Pelamis units with a total rated capacity of 90 MW. The total installed cost for this project is calculated to be approximately $215 million, indicating a unit cost of approximately $2,400 per kW. The study proposes to use this value as a base to estimate future capital costs.
The survey does not have estimates for global wave energy capacity growth that would allow for predicting when doublings of capacity might be achieved and, therefore, must make what researchers believe are reasonably conservative assumptions.
Table 1 provides assumed capital cost schedule, which reflects three doublings during the period of analysis.
Table 1: Assumed Capital Costs for U.S. Offshore Wave Energy (2007)
Period Capital Cost ($/kW)
2008 - 2011 $2,600 2012 - 2015 $2,400 2016 - 2019 $1,970 2020 - 2023 $1,615 2024 – 2027 $1,325 4.1.2) Ocean current
This study is not aware of readily available data describing capital costs or anticipated cost reductions for ocean current energy. It assumes costs equal to those described above for wave energy, but more research on actual costs is needed.
4.2) Renewable energy capacity expansion
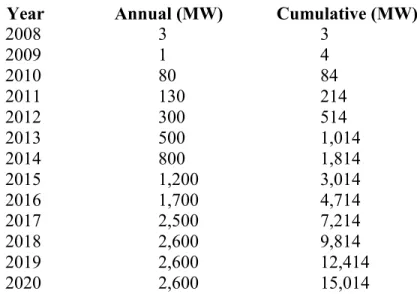
EPRI ocean energy experts have developed an "optimistic" scenario for wave energy capacity development in the United States, resulting in approximately 15 GW of new capacity by 2020 (Table 2; Bedard 2007).
Table 2:EPRI "Optimistic" Forecast of U.S. Wave Energy Capacity Development
Year Annual (MW) Cumulative (MW)
2008 3 3 2009 1 4 2010 80 84 2011 130 214 2012 300 514 2013 500 1,014 2014 800 1,814 2015 1,200 3,014 2016 1,700 4,714 2017 2,500 7,214 2018 2,600 9,814 2019 2,600 12,414 2020 2,600 15,014
However, it is important to note that, according to Bedard, a significant amount of this development is forecast to occur in Alaska and Hawaii and in near shore waters: Table3. This researcher is unaware of any forecasts of the growth of ocean current energy over the next 20 years.
Table 3: Preliminary Development Forecast by Project Type and Region, 2008-2036
Atlantic Gulf of Mexico Pacific TOTAL
Wave 0 0 14 14
Ocean Current 19 0 0 19
4.3) Integration of electricity generation into transmission networks
At approximately 20 percent of total project costs (exceeded only by turbine and support structure costs), the ability to collect electricity from multiple offshore devices (turbines) and transmit that electricity cost-effectively to the onshore grid will be an important determinant of the pace of future ocean energy development.
Wright et al. (2002) note that the United States' substantial experience laying submarine cables to offshore wind farms is not directly applicable. Oil and gas platforms, for
example, require much lower voltage power, while providing electricity to an island from an onshore source utilizes 19 medium-to high-voltage cables. That only delivers power to a load rather than froma source of generation. In addition, they noted the lack of
domestic manufacturers of high-voltage cable and, in comparison to Europe, the relative lack of experience and equipment for cable installation. The survey assumes that the market would address these issues given sufficient and sustained growth in offshore wind energy and that gains in experience would benefit other forms of offshore renewable energy as well.
Green et al. (2007) provide a simple model of the cost and performance of offshore wind farm electrical (i.e., collection and transmission) systems. Addressing the issue of
alternating versus direct current transmission to shore, they note the current consensus that high voltage alternating current (HVAC) will be preferred on economic grounds up to a transmission distance of 50 km, while high voltage direct current (HVDC) will not be consistently more cost-effective before transmission distances reach at least 80 km. Between 50 and 80 km, the costs of HVAC and HVDC are expected to be comparable. Wright et al. suggest that HVDC's economies of scale will make it the preferred option as projects exceed 200 MW and at least 50 km from shore, and that the prospect of large, inter-regional offshore HVDC networks might eventually serve as cost-effective
"substations" for offshore wind. Finally, Green et al. note that current cable designs may prove inadequate for use with floating wind turbine platforms, as they are not designed to withstand the various forces that will act on them if they are not laid on, or buried in, the seafloor. This could also be a concern for wave and ocean current energy projects.
CONCLUSION
Each system has its own advantages and disadvantages. Several common points to these three main technologies stand out.
The positive aspects of using ocean energy are: • Reduction in the dependence on fossil fuels. • Source of energy is free, renewable and clean.
• Clean electricity is produced with no production of greenhouse gas or pollution (liquid or solid).
• Energy produced is free once the initial costs are recovered. • These technologies are renewable sources of energy.
The negative aspects of using ocean energy are:
• At present, electricity produced would cost more than electricity generated from fossil fuels at their current costs.
• It leads to the displacement of wild life habitats. • Technologies are not fully developed.
• Problems exist with the transport of electricity to onshore loads.
1) Tidal and wave power
Advantages
The advantages for using tidal and wave energy over different fossil fuels are plentiful. Below are several impressive benefits of using tidal and wave energy, including the factor of replacing a percentage of fossil fuel use.
• Highly efficient resource: compared with coal and oil at 30%, tidal power
efficiency is about 80%.
• Energy capturing and conversion mechanism may help protect the shoreline. • Energy capturing and conversion mechanism has little visual impact.
• About 60 billion watts of energy from tides can be used for electricity generation. • Tides are active 24 hours a day, 365 days a year.
Disadvantages
• It can only be used where there is suitable tidal flow or wave motion. So it can not
be used inland, unless high-voltage transmission already exists onshore
• It only produces electricity during tidal surges.
• Barrage systems require salt resistant parts and higher maintenance costs. • The frames of the turbine device can disrupt the movement of large marine
• Power produced from tidal fences is still a bit more expensive than that using
conventional plants using coal and natural gas (but it can be cheaper if improved technologies and large-scale generation is applied).
• The barrage systems have the disadvantages of disrupting fish migration and
killing fish passing through the turbines, therefore, there is also the risk of destruction of an ecosystem that relies on the ebb and flow of tides.
• The ecosystem is disrupted during the construction of building the tidal fence.
This affects the fish and also the fishermen whose livelihood depends on fishing.
• Tidal energy can only be created on a coast with a good tidal differential. Thus it
can not be used for a landlocked country.
• It is limited because the tide never speeds up or slows down and occurs in 6 hour
cycles. Also, it is dependent on the fetch distance. This is the distance the tide rises and falls, so some beaches have a very small fetch, and others have a big fetch, but relatively few have a large enough fetch to support tidal energy.
• The main detriment is the cost of these plants. Constructing and running this
facility with an annual output of 3500 GWh, is at a cost about $1.2 billion, and this doesn't include operational and maintenance cost (coal and oil are cheaper).
• Construction of strong, cheap and efficient conversion devices may be
problematic.
• Ecological impacts relating to the alteration of tides and waves is not fully
understood.
• Appropriate waves and tides are highly location dependent.
• Waves are a diffuse energy source, irregular in direction, durability and size. • Extreme weather can produce waves of great intensity.
• Only around 20 sites in the world have been identified as possible tidal power
stations.
2) OTEC
Advantages
• OTEC systems can produce fresh water as well as electricity. This is a significant advantage for an island, such as the Virgin Islands for example, where fresh water is limited.
• There is enough solar energy received and stored in the warm tropical ocean surface layer to provide most, if not all, of present human energy needs.
Disadvantages
• OTEC plants must be located where a difference of about 40 degrees Fahrenheit occurs year round. Ocean depths must be available fairly close to shore-based facilities for economic operation.
• Construction of OTEC plants and laying pipes in coastal waters may cause localized damage to reefs and near-shore marine ecosystems.
A
P
P
E
N
D
IX
T h is ta b le i s a su m m ar y o f m an u fa ct u re rs ’ d at a o r ex tr ap o la te d f ro m w w w .w av ed ra g o n .c o .u k w it h t h e d at a co n su m p ti o n o f 1 h o u se h o ld eq u iv al en t to 7 .5 M W h /y . T h e el ec tr ic al p o w er c ap ac it y f o r 3 0 0 0 h o u se h o ld s is eq u iv al en t to 7 M W . T ab le 4 : S u m m ar y o f m an u fa ct u re rs ’ d at a T e c h n o lo g y P o w e r ra ti n g ( M W ) P o w e r p ro d u c ti o n ( G W h /y ) S a le p ri c e ( M E u ro ) C o s t p e r k W h ( e u ro ) C o s t p e r M W s e t u p L o c a ti o n T id a l b a rr a g e (L a R a n c e ) 2 4 0 5 0 0 7 4 0 0 .0 1 8 s h o re li n e a n d b M a ri n e c u rr e n t tu rb in e A x ia l tu rb in e ( S e a G e n ) 1 .2 3 .8 0 .0 5 p o u n d s te rl in g 3 M p o u n d s te rl in g S h a ll o w o r d e e V e rt ic a l a n d h o ri z o n ta l a x is ( E n e rm a r) 0 .1 5 0 .4 8 $ 0 .1 fo r p ro to ty p e , fo re c a s t to $ 0 .0 4 V e n tu ri e ffe c t 0 .8 2 .5 W a v e e n e rg y O W C ( O c e a n lin x /O re g o n p ro je c t) 1 0 u n it t o 1 5 M W 4 8 .7 5 0 .1 7 5 p /o b je c ti ve 0 .0 8 p o u n d s te rl in g 3 M p o u n d s te rl in g P e la m is 0 .7 5 2 .7 5 .6 0 .0 1 1 D e p th > 5 0 m W a ve D ra g o n 1 1 3 5 0 .0 4 D e p th > 3 0 m A W S 5 1 2 5 .5 0 .0 7 8 0 m < D e p th > 1 0 M c C a b e w a ve p u m p 0 .4 1 .2 8 P o w e rB u o y 0 .5 1 .6 0 .0 5 A q u a B u O Y 0 .2 5 0 .8 0 .0 5 O T E C C lo s e d -c y c le 1 3 .2 $ 4 6 5 0 /k W h b e c a u s e o f d e s a lin a ti o n p u m p in g c o ld w 1 0 0 0 m d e e p a t O p e n -c y c le 0 .0 5 0 .1 6 H y b ri d c y c le- Global world energy overview with specific part from ocean energy
http://www.worldenergy.org/documents/ser2004.pdf
- Basically explanations of three main means of production: wave, OTEC, tidal
http://www.energyquest.ca.gov/story/chapter14.html http://www.eia.doe.gov/kids/energyfacts/sources/renewable/ocean.html http://www.rnp.org/RenewTech/tech_wave.html http://www.ecobusinesslinks.com/ocean_waves_currents_energy.htm registration of website - Wave energy http://thefraserdomain.typepad.com/energy/ocean_power/ - Pelamis http://www.pelamiswave.com/index.php
- The Wave Dragon
http://www.wavedragon.net/
- The Archimedes Wave Swing
http://www.awsocean.com/home.aspx?ln=1
http://www.associatedcontent.com/article/130080/energy_options_archimedes_wave_swi
ng.html?cat=3
http://www.brighthub.com/engineering/mechanical/articles/40548.aspx
- The PowerBuoy / AquaBuOY
http://www.oceanpowertechnologies.com/index.htm
http://www.finavera.com/en/wavetech
- OTEC
http://www.nrel.gov/otec/what.html
http://en.wikipedia.org/wiki/Ocean_thermal_energy_conversion
- Marine Current Turbine
http://www.marineturbines.com/
http://pesn.com/2007/08/07/9500489_VAOT_v_HAOT/