(IJSBAR)
ISSN 2307-4531
(Print & Online)
http://gssrr.org/index.php?journal=JournalOfBasicAndApplied
---
96
Day of the Week Effect, Initial Returns, and Long-term
Market Performance of Initial Public Offerings in the
Indonesian Capital Market
Nugroho Sasikirono
a*, Sumiati
b, Nur Khusniyah Indrawati
ca,b,cDepartment of Management, Faculty of Economics and Business, Brawijaya University, Indonesia
Abstract
This study aims to find the seasonality on initial returns and the long-term market performance of IPOs with different first trading day in Indonesia. There is no difference in initial returns of IPOs with the different first trading day. This study identifies differences in long-term market performance of IPOs with the different first trading day. Long-term market performance of IPO with Tuesday as the first trading day tends to be positive and Wednesday as the first trading day negative. The results of this study show important implications regarding market efficiency in emerging capital market.
Keywords: Market anomaly; initial returns; long-term market performance; IPOs.
1.Introduction
The most common assumptions used in the study of investment in capital markets is that investors in the capital market are rational. In the Efficient Market Hypothesis (EMH), "rational expectations" on asset pricing is an absolute prerequisite. In other words, the asset price will show the present value of the expected future rate of return of the asset. In an efficient financial market, all the information available today reflected in asset prices. In an efficient capital market, it is difficult for investors to get above normal levels of profit consistently by trading transactions on the stock exchange.
--- * Corresponding author.
97
Whereas in less efficient capital markets, the price of securities is less likely to reflect all available information or there are time gaps in the price adjustment process so that it will open loopholes for investors to gain profit by taking advantage of the situation. Research results in the capital markets of various countries detect some regularities, known as a market anomaly. One form of market anomaly is the tendency for significant differences in stock returns at certain times, known as seasonal anomalies [1] or seasonality. Some commonly observed forms of seasonality are: 1) day of the week effect (2) monthly effect [2], and 3) holiday effect [3; 4].
Day of the week effect is the tendency of the emergence of certain pattern of stock market returns on certain trading day. Author [5] finds that the Standard and Poor's index returns on Monday tend to be negative in the period 1953 to 1977. Authors [6] mention that a trend of negative returns on Tuesday in the Japanese and Australian capital markets. A study in nine world stock markets by [7] shows the largest negative return trend on Monday and eight other stock markets on Tuesday. However, observations in the sub-samples of the 1980s show that day anomalies no longer appear in most stock markets. Nevertheless, the findings of [8] show the persistence of day effects on seven major world stock markets: America, Britain, Hong Kong, Japan, Germany, France, and China.
Daily stock trading is not the only activity in which researchers observe day of the week effect. Authors [9] studied the day of the week effect on initial stock returns of IPOs in America. The results of their study indicate that IPO stocks that are traded on first trading day Monday, resulting in a higher initial returns than the other first trading days. Initial returns is one measure of IPO stock market performance. There are two frequently studied IPO market performance: short-term performance (the initial returns) and long-term market performance.
IPO stock shows underpricing tendencies [10, 11]. The underpricing of IPO stocks is indicated by a positive initial returns on its first trading day. Author [10] finds that stocks traded in the US Capital Market are underpriced. Authors [12] also [13] show that this phenomenon occurred in the United States for a long time. Other studies in various countries: English [14], Turkey [15]; show similar results. According to [16] the level of short-term stock returns is positive and high, because the IPO price is indeed systematically set too low.
Previous studies show that there are long-term trend of IPO stocks that are lower than market returns and benchmark firms in the period up to three years post IPO. Author [17] finds the phenomenon of long-term performance of IPO stocks lower than the comparison stocks. Similar research has also found the phenomenon of low long-term performance of IPO stocks in various countries: Germany [18]; Denmark [19], and Malaysia [20].
This study try to provide additional answers to the phenomenon of underpricing and long-term IPO underperformance by testing the relationship between days of the week with both variables. Although research on day effect on underpricing of IPO stocks has been conducted by [9] in the US stock market, this research contributes in: 1) not only underpricing (as measured by initial returns), this study also examines the effect of trading days on long-term stock performance of IPO stocks, 2). This research conducted on capital markets in developing countries, namely the Indonesia Stock Exchange (formerly the Jakarta Stock Exchange). The
98
research problems are: 1) Are there any differences on initial returns and long-term market performance of IPO stocks in Indonesia stock exchange with different first trading day? 2) Are there any relationships between the day of first trading day to the initial returns and the long-term market performance of IPO stocks in the Indonesia Stock Exchange?
2.Literature Review
2.1. Day of the Week Effect
Day of the week effect is the tendency of the emergence of certain pattern of returns in capital market on certain trading day. Author [5] finds that the Standard and Poor's index's on Monday tended to be negative in the period 1953 to 1977. A follow-up study conducted by [6] examine the day of the week effect phenomenon in five capital markets: America, Canada, Japan, the UK and Australia. The study results show that day of the week effect occurred in the five stock markets studied. Average returns on three countries: the United States, Canada, and the United Kingdom, were low on Monday. Similar effects were found to occur on Tuesday in Japan and Australia. The day of the week effect study in ten Asia-Pacific countries by [21] shows that there is a strong day-of-the-week-effect on most markets. Five markets show negative Monday returns trend (Hong Kong, Japan, Malaysia, Philippines, and Singapore), but significant only for the Philippines and Malaysia.
A further review of the international capital market scope, which has been done, among others, by [7, 22, 8, and 23]. Author [24] indicates that different countries showed different anomalous days. National studies have been conducted in many countries; to name a few: Pakistan [25], Saudi Arabia [26], and Indonesia [27]. In general, the results of previous studies show the existence of the effects of the day. Nevertheless, the results of the study of [28], using the dummy regression technique, show that there is no significant difference in the returns of different trading days. The study of [8] show that day effect patterns on stock market returns are not fixed on one day, but rather changes over time; refer to as wandering weekday effect.
2.2. Initial Returns and IPOs Underpricing
Underpricing IPOs are the trend of positive returns on the first day trading of IPO shares. Underpricing is calculated using the initial returns, ie returns of the first day of stock trading. Using the risk adjusted returns method, Reference [10] show that the initial returns tend to be positive. The same results also found in many advanced studies, such as: [29, 12, 17] in the US capital market; [14] in England; [16] in Switzerland; [15] in Turkey, [20] in Malaysia, and [30] in Indonesia. On the international capital market scope, [31] find that IPO underpricing occurred in all capital markets observed. The magnitude of underpricing strongly influenced by several factors such as government intervention, the speed of price bidding in the IPO process, as well as the risk level of issuers proxied by the age and size of the company.
2.3. IPOs Long-Term Market Performance
Long-term market performance is the cumulative returns of stocks up to 36 months after first trading. Author [17] compares Buy-and-Hold Returns (BHR) IPO stocks in the United States with market BHR and benchmark
99
companies three and five years after the IPO date. The findings show that, in America, stocks sold through IPO perform lower than other stocks for a period of three and five years after IPO. Research by [20] gives the opposite result. The study of 454 IPO stocks from 1990 to 2000 on the Kuala Lumpur Stock Exchange (now called Bursa Malaysia) show that long-term performance of stock (three years after IPO), calculated by CAR and BHR method, is significantly higher than benchmark’s performance. The use of the Fama and Frech Three Factor Model method has concluded that there is no significant difference between the long-term returns of IPO stocks and the benchmark’s returns.
2.4. Day of the Week Effect in IPO Underpricing
Author [9] published their research about day of the week effect on IPOs in the US stock market. The comparison of the initial returns for the period of 1980 to 2003 shows that the average initial returns on the first trading day on Monday was significantly higher than the initial returns on the other first trading day. The calendar time approach, developed by [5], is applied to day dummy variables. According to them, this happens because investment managers tend to delay the analysis and action of IPO stocks trading on Monday. The delay of analysis, in turn, encourages the emergence of delay in stock trading and the shortening of price adjustment. This short price adjustment leads to high initial returns for the first trading day on Monday.
3.Methods 3.1.Data
Research data were obtained from various sources. IPO issuers for the period 2006 to 2013 obtained from the Indonesia Stock Exchange. Financial information prior to the IPO (such as firm’s assets, age, and sales) was obtained from the prospectus of stocks offerings available at the Indonesian Capital Market Electronic Library (iCamel) and the Indonesian Capital Market Directory (ICMD), as well as information about underwriters. Daily stock price information obtained from the Indonesian Capital Market Directory. There were 167 companies that conduct IPOs between 2006 and 2013, seven of which did not provide complete financial information on the prospectus, and nine companies did not have complete stock price information due to delisting or long trading suspension.` The final sample size 151 companies that conducted IPO in 2006-2013 period.
3.2.Measurement
The effects of the day were tested using test of difference. The observed objects are the returns on the first trading day of IPO shares and cumulative returns during 36 months post IPO. The conclusions will be taken with regard to whether there is a significant difference between the initial returns and CAR36 months of certain day of first trading day with the initial returns and CAR36 of first trading day on the other days. Different from previous studies [5, 6, 21, 32, 8], this research utilizes One Way ANOVA analysis technique with Planned Contrast method.
IPOs underpricing is calculated using two measures: Initial returns and Market Adjusted Initial returns. Initial returns is calculated by the formula:
100
IPO IPO i iP
P
P
IR
=
1−
(1)A better initial returns measures is performed by considering a "normal" returns on the same trading day as known as the Market Adjusted Initial returns [17].
1 1
Rm
P
P
P
MAIR
IPO IPO i i−
−
=
(2)The long-term market performance of IPOs is measured using Cumulative Abnormal Returns 36 (CAR36) months post first trading day of IPO shares. The CAR method calculate the cumulative abnormal rate of returns during the observation period. The CAR during the observation period, ie 36 months, is calculated by the formula:
∑
==
s q t it qsAR
CAR
(3) and ARit = Rit - Rmt (4)Multivariate analysis used to examine the effect of the first trading day on market adjusted initial returns (MAIR) and CAR36. Regression technique is conducted using the trading time approach. Control variables used in this study are commonly used in multivariate analysis of IPO stock market performance. The size and level of corporate risk, as measured by the natural logarithm of total assets (LnTA) and sales (LnSales), in previous studies generally had a positive effect on initial returns [5, 33, 9, 34]. The company's age (AGE) generally has a positive effect on initial returns [12, 33, 34, 35, 36]. Proceeds calculated as natural logarithms (LnProceeds) and generally have a positive effect on initial returns [15, 34, 37]. The underwriter's reputation (UWREP) computed as a dummy variable using the approach of [38]. It includes steps that are calculates the proportion of funds guaranteed by each underwriter, calculates the mean of the proceeds of the IPO, and classifies the reputation into two. Underwriters with underwriting portions more than mean get a dummy score of 1, others 0. Reputation of underwriters negatively related to short-term performance and positive with long-term performance. [12, 39]).
4.Results 4.1.Descriptive
The results shows that in the research period, Wednesday is the most frequent first trading day, 39 times, while the least is Friday. This is related to the pattern of regular trading in the secondary market on Wednesday, which is marked by a high returns on the day as mentioned in [27]. The lowest frequency of friday as the first trading day Friday is possible because Friday has short trading hours (4 hours) compared to other trading days, due to
101
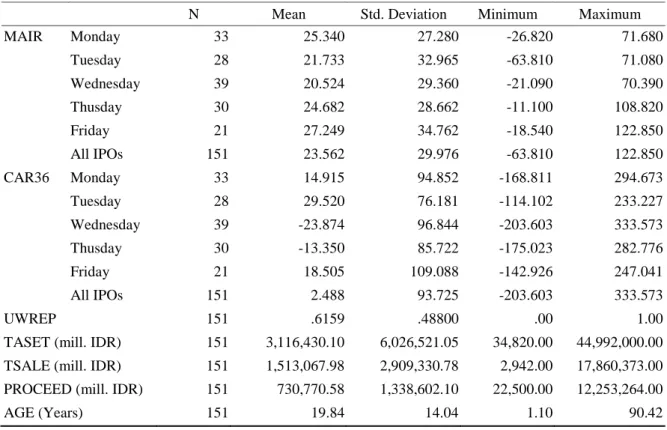
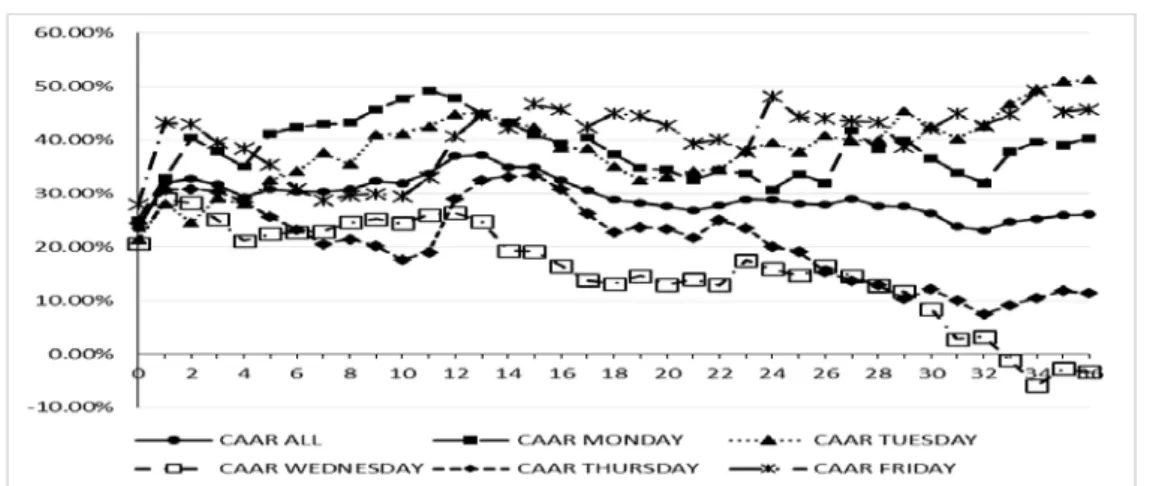
the addition of market break hours to Friday Prayer.IPOs in Indonesia generally underpriced with initial returns of 23.49% (t-stat 9.661) and market adjusted initial returns of 23.56% (t-stat 9.659). Table 1 and Figure 1 show that the average market adjusted initial returns are the lowest on Wednesday as the first trading day (20.6% and 20.52%), while the highest are on Friday (27.90% and 27.25%). The standard deviation of market adjusted initial returns are the highest on Friday first trading day and the lowest on Wednesday. The highest mean of CAR36 resulted by Tuesday as the first trading day (29.52%) and the lowest for Wednesday (-23.87%). The standard deviation of CAR36 is the highest on Friday's first trading day and lowest on Tuesday's.
Table 1: Descriptive Statistics
N Mean Std. Deviation Minimum Maximum
MAIR Monday 33 25.340 27.280 -26.820 71.680 Tuesday 28 21.733 32.965 -63.810 71.080 Wednesday 39 20.524 29.360 -21.090 70.390 Thusday 30 24.682 28.662 -11.100 108.820 Friday 21 27.249 34.762 -18.540 122.850 All IPOs 151 23.562 29.976 -63.810 122.850 CAR36 Monday 33 14.915 94.852 -168.811 294.673 Tuesday 28 29.520 76.181 -114.102 233.227 Wednesday 39 -23.874 96.844 -203.603 333.573 Thusday 30 -13.350 85.722 -175.023 282.776 Friday 21 18.505 109.088 -142.926 247.041 All IPOs 151 2.488 93.725 -203.603 333.573 UWREP 151 .6159 .48800 .00 1.00
TASET (mill. IDR) 151 3,116,430.10 6,026,521.05 34,820.00 44,992,000.00
TSALE (mill. IDR) 151 1,513,067.98 2,909,330.78 2,942.00 17,860,373.00
PROCEED (mill. IDR) 151 730,770.58 1,338,602.10 22,500.00 12,253,264.00
AGE (Years) 151 19.84 14.04 1.10 90.42
The average CAR36 is positive. On average, there is an increase of 2.5% returns in 3 years after the first trading day. Nonetheless, observing the first trading day of IPO stocks, we found diversity in cumulative returns movement. In the case of IPOs with Monday, Tuesday, and Friday as the first trading day, there are increase in returns during the first three years of stock trading. The first trading day of Tuesday shows a 36-month increase in returns (29.5%) that is higher than the average increase in returns of all IPO stocks. Meanwhile, the largest decline in long-term returns occurred in the IPO with the first trading day Wednesday (-23.97%), followed by Thursday (-13.3%).
There are significant differences in characteristics of issuers in Indonesia. It indicated in the difference of total assets, total sale, and highest and lowest proceeds. The one with highest total assets and proceeds is PT Adaro
102
Energy Tbk.'s IPO. The youngest company at the time of IPO (1.1 years) is PT Indofood CBP Sukses makmur Tbk, which is a spinoff of PT Indofood Sukses Makmur Tbk., one of the biggest consumer product manufacturers in Indonesia.
The correlation table (Table 2) shows a high correlation between underwriter reputation and Wednesday dummy. This shows the tendency of reputable underwriters to avoid Wednesday as the first trading day for stocks they guaranteed. Meanwhile, the correlation of total assets with Thursday dummy shows the tendency of large-sized companies to choose Thursday as the first trading day of the stock. First day returns negatively correlated with the underwriter's reputation (as in [12]). Negative relationship also occurs between MAIR and firm age, since age is strongly associated with risk [11].
Table 2: Pearson Correlation
MAIR CAR36 Dmon Dtue Dwed Dthu Dfri UWREP TASSET TSALE PROC AGE
MAIR 1.000 .036 .031 -.029 -.060 .019 .050 -.185* -.039 -.114 -.092 -.203* CAR36 1.000 .070 .138 -.167* -.084 .069 .054 .034 -.011 -.010 -.058 Dmon 1.000 -.252** -.312** -.263** -.213** .121 -.027 -.154 -.080 .023 Dtue 1.000 -.282** -.238** -.192* .026 -.123 -.067 -.079 -.039 Dwed 1.000 -.294** -.237** -.161* -.046 .090 .075 -.019 Dthu 1.000 -.200* .018 .268** .111 .082 -.047 Dfri 1.000 .003 -.080 .018 -.006 .094 UWREP 1.000 .250** .230** .323** .119 TASSET 1.000 .465** .412** .261** TSALE 1.000 .644** .178* PROC 1.000 -.020 AGE 1.000
Notes: *, ** indicate significance at the 5 and 1% levels, respectively.
Figure 1: Initial returns and Cumulative Average Abnormal Returns 36 months on Indonesian IPOs (2006-2013) with different first trading day
103
4.2.Planned Contrast One Way Anova
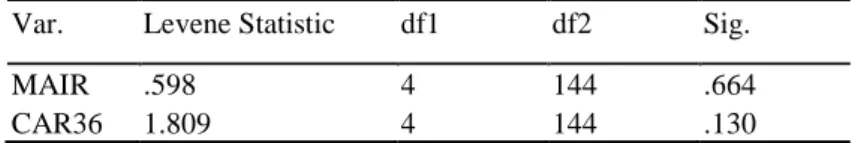
The initial phase of this test is to find and eliminate data with extreme values. There are two extreme value data (data number 37 and 42), therefore both data deleted. Normality test is done by looking at skewness and kurtosis. The results show that the data is normally distributed with skewness and kurtosis of market adjusted initial returns 0.572 and 0.207, indicating a positive initial returns trend. The trend of positive returns is also seen in cumulative abnormal returns 36 months. Levene test was performed to determine the homogeneity of variance. The value of sig. above 0.05 in the two research variables indicate that the variance of the data is homogeneous.
Table 3: One Way ANOVA Statistics
MAIR CAR36 N Valid 149 149 Missing 0 0 Mean 23.336 -1.614 Skewness .572 .723 Std. Error of Skewness .199 .199 Kurtosis .207 .911 Std. Error of Kurtosis .395 .395
Table 4: Test of Homogeneity of Variances
Var. Levene Statistic df1 df2 Sig.
MAIR .598 4 144 .664
CAR36 1.809 4 144 .130
Table 5: Results of One Way ANOVA Contrast Test of MAIR and CAR36
Contrast Value of Std. Error t df Sig.
(2-MAIR Assume equal
variances Mon 8.312 22.559 .368 59.770 .714 Tue -9.720 27.438 -.354 39.067 .725 Wed -17.140 22.780 -.752 67.386 .454 Thu .692 24.469 .028 46.569 .978 Fri 17.857 32.153 .555 25.148 .584
CAR36 Assume equal variances Mon 68.476 73.804 .928 48.339 .358 Tue 141.503* 66.832 2.117 46.698 .040 Wed -172.502** 61.325 -2.813 71.292 .006 Thu -123.908* 60.152 -2.060 57.332 .044 Fri 86.430 99.286 .871 23.610 .393
104
Table 5 reports the results from One Way ANOVA Contrast Test of IR, MAIR, and CAR36 for the full sample of IPOs 2006-2013. *, **Indicate significance at the 5 and 1% levels, respectively.
4.3.Analysis on First Day Returns
Table 6: Regression Results of First Day Return
Model 1 Model 2 Constant 227.325*** 229.925*** (3.734) (3.659) DTuesday -7.101 (-.829) DWednesday -5.248 (-.656) DThursday -2.644 ( -.315) LnTA 2.447 2.250 (.966) (.857) LnSales -1.994 -1.642 (-1.211) (-.925) LnProceed -7.664*** -7.739*** (-2.765) (-2.721) LnAge -6.244** -6.447** (-1.983) (-1.999) UWRep 1.902 1.501 (.312) (.234) F 4.217*** 2.388** R2 .127 .132
Table 6 reports the results from OLS regressions of IPO first day returns for 2006 - 2013 on the Tuesday, Wednesday, and Thursday dummy for the full sample. The dependent variables is Market Adjusted Initial Returns. T-statistics are in parentheses. *, **, *** Indicate significance at the 10, 5, and 1% levels, respectively. Table 6 shows that there is no significant difference in the first trading day returns in Indonesia, although Tuesday, Wednesday and Thursday's returns tend to be lower than Monday and Friday's. This shows that in general IPOs in Indonesia designed to benefit investors in general, to avoid winner's curse problems and adverse selection. Negative relations between proceeds with MAIR are consistent with previous research by [11], since the lower proceeds are associated with higher risks. The company's age also shows a negative relationship with MAIR. This means that the lower the age of the higher the underpricing because of the higher risk.
4.4.Analysis on CAR36
Multivariate analysis conducted to find out whether CAR36 of IPOs with the first trading day Wednesday, Thursday, and Tuesday can be explained by day variables (Table 7). The independent variables are the dummies of the day, while the control variables used are variables frequently used in previous studies: Market Adjusted
105
Initial Returns, lnTotalAssets, InSales, InProceed, lnAge and underwriter’s reputation.
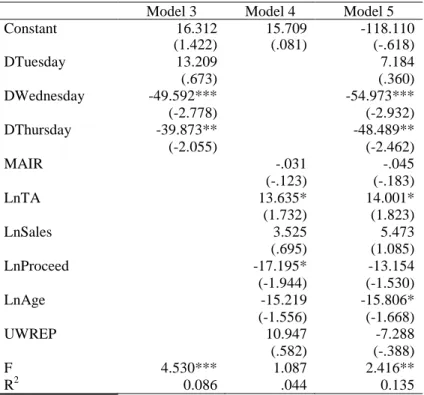
Regression with OLS method shows that CAR36 for IPOs with the first trading day Wednesday and Thursday is significantly lower compared to other first trading day; but, it is not the case of the first trading day on Tuesday. Inclusion of control variables is able to increase the coefficient of determination and significance of the first trading day dummy on Wednesday and Thursday. Of the four models, only control variables of Total Assets and IPO Results consistently have significant effects on CAR36.
Table 7: Regression Results of CAR36
Model 3 Model 4 Model 5
Constant 16.312 15.709 -118.110 (1.422) (.081) (-.618) DTuesday 13.209 7.184 (.673) (.360) DWednesday -49.592*** -54.973*** (-2.778) (-2.932) DThursday -39.873** -48.489** (-2.055) (-2.462) MAIR -.031 -.045 (-.123) (-.183) LnTA 13.635* 14.001* (1.732) (1.823) LnSales 3.525 5.473 (.695) (1.085) LnProceed -17.195* -13.154 (-1.944) (-1.530) LnAge -15.219 -15.806* (-1.556) (-1.668) UWREP 10.947 -7.288 (.582) (-.388) F 4.530*** 1.087 2.416** R2 0.086 .044 0.135
Table 7 reports the results from OLS regressions of IPO CAR36 for 2006 - 2013 on the Tuesday, Wednesday, and Thursday dummy for the full sample and two models including Market Adjusted Initial returns as one of control variables. T-statistics are in parentheses. *, **, *** Indicate significance at the 10, 5, and 1% levels, respectively.
4.5.Further Examination
In order to obtain stronger conclusions, the sample then broken down into sub samples based on the IPO period; namely 2006-2010 and 2010-2013, as well as sample with excluding IPOs data of economic crisis years (2008-2009). Observations on the three sub-samples (Figure 2 through 4) indicated that there was no steady pattern on the initial returns of IPOs with different first trading days. In the period 2006-2010 the order of initial returns, from the highest, for trading day: Friday-Thursday-Monday-Wednesday-Tuesday. Different levels of initial returns are shown in the 2010-2013 sub-samples: Monday-Friday-Tuesday-Thursday-Wednesday. The
106
observations by excluding data of economic crisis years also give the same result of the sequence of initial returns ranks: Monday-Friday-Tuesday-Thursday-Wednesday.
Figure 2: Initial Returns and Cumulative Average Abnormal Returns 36 months of 2006-2010 sub sample
Figure 3: Initial Returns and Cumulative Average Abnormal Returns 36 months on Indonesian IPOs of 2010-2013 sub sample
107
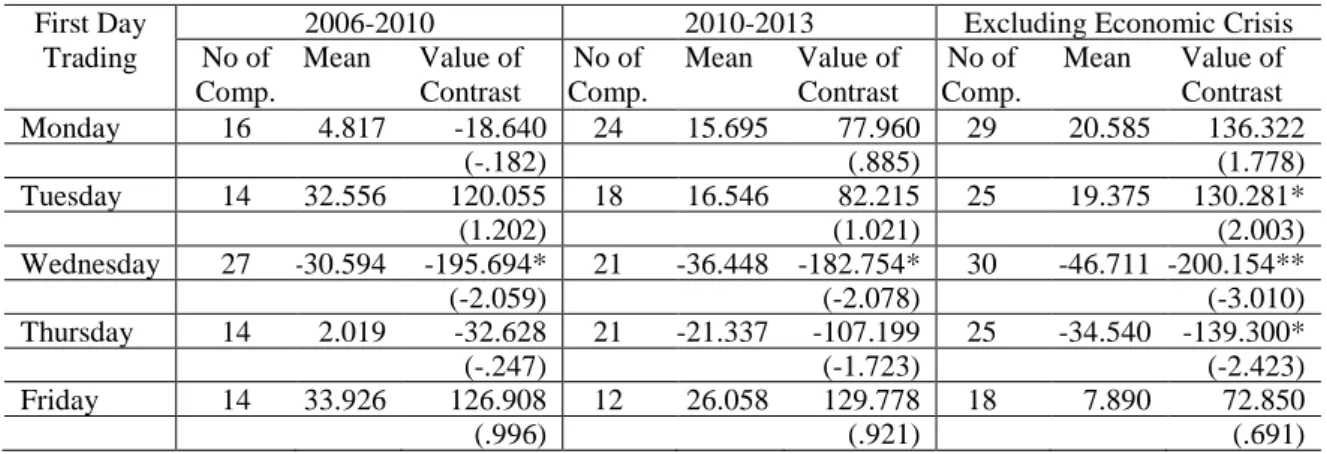
Examination on CAR36 gives different results. By excluding Friday, the CAR36 ranking on the IPO with the distinct first trading day is: Tuesday-Monday-Thursday-Wednesday. Furthermore, in all sub samples, CAR36 for IPOs with the first trading days of Tuesday and Monday are consistently above CAR36 of all samples; while CAR36 for the first trading day Thursday and Wednesday is always lower. The Friday first trading day produced a relatively random pattern, low CAR36 in the 2006-2010 period, the highest in 2010-2013, and medium in all samples and excluded crisis year data sub-samples.
Figure 4: Initial Returns and Cumulative Average Abnormal Returns 36 months on Indonesian IPOs of sample that excluding data of economic crisis years.
Table 8: Results of One Way ANOVA Contrast Tests of CAR36 Sub Samples
First Day Trading
2006-2010 2010-2013 Excluding Economic Crisis
No of Comp. Mean Value of Contrast No of Comp. Mean Value of Contrast No of Comp. Mean Value of Contrast Monday 16 4.817 -18.640 24 15.695 77.960 29 20.585 136.322 (-.182) (.885) (1.778) Tuesday 14 32.556 120.055 18 16.546 82.215 25 19.375 130.281* (1.202) (1.021) (2.003) Wednesday 27 -30.594 -195.694* 21 -36.448 -182.754* 30 -46.711 -200.154** (-2.059) (-2.078) (-3.010) Thursday 14 2.019 -32.628 21 -21.337 -107.199 25 -34.540 -139.300* (-.247) (-1.723) (-2.423) Friday 14 33.926 126.908 12 26.058 129.778 18 7.890 72.850 (.996) (.921) (.691)
Table 8 reports the results from One Way ANOVA Contrast Test of CAR36 for the sub samples of IPOs: 2006-2010, 2010 – 2013, and sample excluding data of economic crisis years. T-statistics are in parentheses. *, **
108
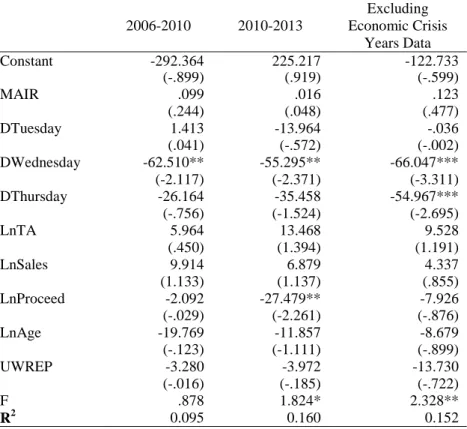
Indicate significance at the 5 and 1% levels, respectively. The Test of One Way Anova with Planned Contrast method (Table 8) shows that only CAR36 of IPOs with the first trading day of Wednesday is consistently different from the other CAR36 trading days. The CAR36 of the first trading day on Wednesday significantly lower than the other first trading days in all sub samples. CAR36 of the first trading day on Tuesday is only different from the other days in the sub sample that exclude data of the economic crisis years. However, it is surprising that the CAR36 of IPOs with the first trading day on Thursday only show significant difference with other first trading days in sub sample that excluding economic crisis years. Multivariate analysis of three sub-samples (Table 9) show that IPOs with the first trading day on Wednesday shows a significantly lower CAR36 compared with other first trading days. This reinforces the finding of the seasonality in the long-term performance of IPO shares associated with the first trading day of the stock. In contrast to the analysis of All Samples, CAR36 on the IPO with the first trading day on Thursday only shows difference with the other CAR36's first trading days in sub sample that excluding economic crisis years.
Table 9: Regression Results of Sub Samples
2006-2010 2010-2013 Excluding Economic Crisis Years Data Constant -292.364 225.217 -122.733 (-.899) (.919) (-.599) MAIR .099 .016 .123 (.244) (.048) (.477) DTuesday 1.413 -13.964 -.036 (.041) (-.572) (-.002) DWednesday -62.510** -55.295** -66.047*** (-2.117) (-2.371) (-3.311) DThursday -26.164 -35.458 -54.967*** (-.756) (-1.524) (-2.695) LnTA 5.964 13.468 9.528 (.450) (1.394) (1.191) LnSales 9.914 6.879 4.337 (1.133) (1.137) (.855) LnProceed -2.092 -27.479** -7.926 (-.029) (-2.261) (-.876) LnAge -19.769 -11.857 -8.679 (-.123) (-1.111) (-.899) UWREP -3.280 -3.972 -13.730 (-.016) (-.185) (-.722) F .878 1.824* 2.328** R2 0.095 0.160 0.152
Table 9 reports the results from OLS regressions of IPO CAR36 for the sub samples: 2006-2010, 2010 – 2013, and sample excluding economic crisis years data. T-statistics are in parentheses. *, **, *** Indicate significance at the 10, 5, and 1% levels, respectively.
5.Discussion
109
IPOs with certain day of first trading day. This study also seek out whether there is day of the week on long-term market performance of IPOs. Contrast to findings by [9], this study was conducted in developing country.
The results showed no day effect on IPOs in Indonesia. In general, Indonesian IPOs have underpriced. To avoid adverse selection and winner's curse problem, underwriters and issuers set low IPO prices. This is due to characteristic of Indonesia market that is emerging capital market. According to [40], the Indonesian capital market has characteristics such as low capital market literacy, low investor confidence in capital markets, and low investment mindedness. Based on data from the Indonesian Central Securities Depository (KSEI), in 2014 the number of Indonesian investors is 365,000, of whom 96% are individual local investors, equivalent to only about 1.4% of the Indonesian population. To sustain and even increase confidence towards the capital market and strengthen investment mindedness, firms underpriced their stocks.
The long-term market performance of IPOs with Wednesday as the first trading day is significantly lower than in the others. Correlation matrix shows that there is a tendency that non-reputable underwriters choose Wednesday as the first trading day. This condition resulted in the higher risk level of IPO with Wednesday as the first trading day. This high risk leads to lower long-term performance. The first trading day Thursday had a negative effect on the long-term market performance. However, the relationship does not appear in the sub-samples 2006-2010 and 2010-2013.
6.Conclusion
This study aims to determine whether there is seasonality on short-term performance and long-term performance of IPOs stocks for the period 2006-2013 in Indonesia capital market. This study identifies the day effect on the long-term market performance of IPOs measured by CAR36. Results of One Way Anova show that CAR36 of IPOs with Tuesday as the first trading day is significantly higher, while Wednesday and Thursday as the first trading day produced a lower long-term market performance. Multivariate analysis showed that only CAR36 of IPOs with Wednesday as the first trading day is significantly different with the other first trading days. This is due to non-reputable underwriters tend to choose Wednesday as the first trading day, thereby increasing IPO's risks.
Further examination on three subsamples finds that only CAR36 of IPOs with Wednesday as the first trading day is significantly different than the others. Nevertheless, CAAR36 of IPOs with the first trading day Tuesday and Monday are consistently higher than the average CAAR36, while CAAR36 of Thursday and Wednesday are consistently lower. There is also a tendency of CAAR36 of Monday and Tuesday as first trading day that higher than the initial returns. One Way Anova analysis on three subsamples showed that there is no difference in CAR36 of Thursday as the first trading day.
The implication of this result is that investors can manage investments in IPO stocks to provide optimum returns, especially on long time horizons. Additional studies will be able to provide information on the characteristics of capital markets that have different characteristics with that in developed countries. More studies on the emerging markets can confirm the consistency of this phenomenon. Characteristics of capital
110
market data that have different central tendencies may also demand utilization of other analytical tools
References
[1] J. Lakonishok, and S. Smidt. (1988). "Are Seasonal Anomalies Real? A Ninety-Year Perspective" The Review of Financial Studies, 1(4), pp. 403–425. doi.org/10.1093/rfs/1.4.403.
[2] R.A. Ariel. (1987). "A Monthly Effect in Stock Returns" Journal of Financial Economics, 18 (1), pp 161 -174. doi.org/10.1016/0304-405X(87)90066-3
[3] R.A. Ariel. (1990). "High Stock Returns before Holidays: Existence and Evidence on Possible Causes" The Journal of Finance, 45(5), pp. 1611-1626. doi.org/10.1111/j.1540-6261.1990.tb03731.x
[4] M.W.L. Chan, A. Khanthavit, and H. Thomas. (1996). "Seasonality and Cultural Influences on Four Asian Stock Markets" Asia Pacific Journal of Management, 13 (2), pp. 1-24. doi.org/10.1007/BF01733814
[5] K.R. French. (1980). "Stock Returns and the Weekend Effect" Journal of Financial Economics, 8, pp. 55-70. doi.org/10.1016/0304-405X(80)90021-5
[6] J. Jaffe, and R. Westerfield. (1985). "The Week-End Effect in Common Stock Returns: The International Evidence" The Journal of Finance, 40(2), pp. 433-455. doi.org/10.1111/j.1540-6261.1985.tb04966.x
[7] A. Agrawal, and K. Tandon. (1994). "Anomalies or Illusions? Evidence from stock markets in eighteen countries" Journal of International Money and Finance, 13, pp. 83-106. doi.org/10.1016/0261-5606(94)90026-4
[8] J.R. Doyle, and C.H. Chen. (2009), "The Wandering Weekday Effect in Major Stock Markets" Journal of Banking & Finance, 33, pp. 1388–1399. doi.org/10.1016/j.jbankfin.2009.02.002
[9] T.L. Jones, and J.A. Ligon. (2009). "The Day of the Week effect in IPO Initial Returns" The Quarterly Review of Economics and Finance, 49, pp. 110–127. doi.org/10.1016/j.qref.2007.03.004
[10] R.G. Ibbotson. (1975), "Price Performance of Common Stock New Issue" Journal of Financial Economics, 2, pp. 235 – 272. doi.org/10.1016/0304-405X(75)90015-X
[11] J.R, Ritter. (1984). "The "hot issue" market of 1980" Journal of Business, 57, pp. 215-240. Available: http://www.jstor.org/stable/2352736
[12] R. Carter, and S. Manaster. (1990). "Initial Public Offerings and Underwriter Reputation" The Journal of Finance, 45(4), pp. 1045-1067. doi.org/10.1111/j.1540-6261.1990.tb02426.x
111
[13] R. Aggarwal, R. Leal, and L. Hernández. (1993). "The aftermarket performance of initial public offerings in Latin America" Financial Management, 22(1), pp. 42-53. doi: 10.2307/3665964
[14] M. Levis. (1993). "The Long-Run Performance of Initial Public Offerings: The UK Experience 1980 – 1988" Financial Management, 22, pp. 22-41. doi: 10.2307/3665963
[15] B.M. Durukan. (2002). "The Relationship Between IPO Returns and Factors Influencing IPO Performance: Case of Istanbul Stock Exchange" Managerial Finance, 28 (2), pp. 18-38. doi.org/10.1108/03074350210767672
[16] R.M. Kunz, R. Aggarwal. (1994). "Why initial public offerings are underpriced: Evidence from Switzerland" Journal of Banking and Finance, 18, pp. 705-723. doi.org/10.1016/0378-4266(93)00016-I
[17] J.R. Ritter. (1991). "The Long Run Performance of initial Public Offerings" Journal of Finance, 46, pp. 3-27. doi.org/10.1111/j.1540-6261.1991.tb03743.x
[18] R. Stehle, O. Ehrhardt, and R. Przyborowsky. (2000). "Long Run Stock Performance of German Initial Public Offerings and Seasoned Equity Issues" European Financial Management, 6(2), pp. 173-196. doi.org/10.1111/1468-036X.00119
[19] B. Jakobsen, and O. Sorensen. (2001). "Decomposing and Testing Long Term Returns: An Application on Danish IPOs" European Financial Management, 7(3), pp. 393-417. doi.org/10.1111/1468-036X.00162
[20] N.A. Ahmad-Zaluki, A. Campbell, A. Goodacre. (2007). "The Long Run Share Price Performance of Malaysian Initial Public Offerings (IPOs)" Journal of Business Finance & Accounting, 34 (1-2), pp.78-110. doi.org /10.1111/j.1468-5957.2006.00655.x
[21] Y. Ho. (1990). "Stock Return Seasonalities in Asia Pacific Markets" Journal of International Financial Management and Accounting, 2 (1), pp. 47-77. doi.org/10.1111/j.1467-646X.1990.tb00017.x
[22] M. Dubois, and P. Louvet. (1996). "The Day-of-the-Week Effect: The International Evidence" Journal of Banking & Finance, 20, pp. 1463-1484. doi.org/10.1016/0378-4266(95)00054-2
[23] W. Kristanto, and J.S. Sukamluja. (2014). "The Day of The Week Effect pada Pasar Modal Asean (Indonesia, Malaysia, dan Singapura) Periode 2003-2013" Jurnal Manajemen UAJY, 1, pp. 1-5. Available: http://e-journal.uajy.ac.id/6080/1/JURNAL%20EM18402.pdf
[24] J. Zhang, Y. Lai, and J. Lin. (2017). "The day-of-the-Week effects of stock markets in different countries" Finance Research Letters, 20, pp. 47–62. doi.org/10.1016/j.frl.2016.09.006
[25] Hussain, F., Hamid, K., Akash, R.S.I. and Khan, M.I. 2011. Day of the Week Effect and Stock Returns: (Evidence from Karachi Stock Exchange-Pakistan), Far East Journal of Psychology and
112
Business, 3 (1), pp. 25 – 31. Available: https://ssrn.com/abstract=2899426
[26] T. Ulussever, I. Guranyumusak, and M. Kar. (2011). "The Day-of-the-Week Effect in the Saudi Stock Exchange: A Non-Linear Garch Analysis" Journal of Economic and Social Studies, 1(1), pp. 9-23. Available: http://eprints.ibu.edu.ba/id/document/4494
[27] Windijarto, and N. Sasikirono. Pengaruh Hari Dalam Satu Minggu (Day of the Week Effect) Terhadap Pendapatan Saham Investor, Laporan Penelitian Dosen Muda, Lembaga Penelitian Universitas Airlangga, 2004, pp. 36.
[28] E.C. Chang, J.M. Pinegar, and R. Ravicha. (1993). "International Evidence on the Robustness of the Day-of-the-Week Effect" The Journal of Financial and Quantitative Analysis, 28 (4), pp. 497-513. doi: 10.2307/2331162
[29] K. Rock. (1986). "Why New Issues are Underpriced" Journal of Financial Economics, 15, pp. 187-212. doi.org/10.1016/0304-405X(86)90054-1
[30] H. Meidiaswati. "Kinerja Jangka Panjang pada IPO di Indonesia periode 1991-1993" Majalah Ekonomi, 18(2), pp. 184-196, Agustus 2008.
[31] T. Loughran, J.R. Ritter, and K. Rydqvist. (1994). "Initial Public Offerings: International Insight" Pacific-Basin Finance Journal, 2, pp. 165-199. doi.org/10.1016/0927-538X(94)90016-7
[32] R. Sullivan, A. Timmermann, and H. White. (2001). "Dangers of data mining: The case of calendar effects in stock returns" Journal of Econometrics, 105, pp. 249–286. doi.org/10.1016/S0304-4076(01)00077-X
[33] T. Loughran, and J.R. Ritter. (2004). "Why Has IPO Underpricing Changed Over Time?" Financial Management, 33(3), pp. 5 – 37. Available: http://www.jstor.org/stable/3666262
[34] A.W. Butler, M.O. Keefe, and R. Kieschnick. (2014). "Robust determinants of IPO underpricing and their implications for IPO research" Journal of Corporate Finance, 27, pp. 367–38. doi.org/10.1016 /j.jcorpfin.2014.06.002
[35] T.L. Jones, and M. Swaleheen. (2010). "Endogenous examination of underwriter reputation and IPO returns" Managerial Finance, 36(4), pp. 284-293. doi.org/10.1108/03074351011027501
[36] L. Tian. (2011). "Regulatory underpricing: Determinants of Chinese extreme IPO returns" Journal of Empirical Finance, 18, pp. 78–90. doi.org/10.1016/j.jempfin.2010.10.004
[37] R. Guo, B. Lev, and C. Shi. (2006). "Explaining the Short- and Long-Term IPO Anomalies in the US by R&D" Journal of Business Finance and Accounting, 33 (3-4), pp. 550–579. doi.org/10.1111/j.1468-5957.2006.00610.x
113
[38] D.F. Kenourgios, S. Papathanasiou, and E.R. Melas. (2007). "Initial performance of Greek IPOs, underwriter’s reputation and oversubscription" Managerial Finance, 33(5), pp. 332-343. doi.org /10.1108/ 03074350710739614
[39] R.B. Carter, F.H. Dark, and T.R.A. Sapp. (2010). "Underwriter reputation and IPO issuer alignment 1981–2005" The Quarterly Review of Economics and Finance, 50, pp. 443–455. doi: 10.1016/j.qref.2010.07.001
[40] H. Meidiaswati, H. 2017. "Asymmetric Information at First Seasoned Equity Offering in the Indonesian Capital Market" Dissertation, Faculty of Economic and Business, Universitas Airlangga, 2017