T
HE
W
ILLIAM
D
AVIDSON
I
NSTITUTE
AT THE UNIVERSITY OF MICHIGAN BUSINESS SCHOOLTo Steal or Not to Steal:
Firm Attributes, Legal Environment, and Valuation
By: Art Durnev and E. Han Kim
William Davidson Working Paper Number 554
April 2003
First Draft: April, 2002
Comments welcome
To Steal or Not to Steal:
Firm Attributes, Legal Environment, and Valuation
Art Durnev
*and E. Han Kim
***Ph.D. Candidate, Department of Finance, University of Michigan Business School, Ann Arbor, Michigan 48109-1234. Tel: (734) 358-2427. E-mail: [email protected].
** Fred M. Taylor Professor of Business Administration, University of Michigan Business School, Ann Arbor, MI 48109-1234. Tel: (734) 764-5222 & (734) 764-2282. Fax: (734) 763-3117. Email: [email protected].
We are grateful for helpful comments and suggestions by Sugato Bhattacharyya, Serdar Dinç, Mara Faccio, Daniel Ferreira, Michael Fuerst, Kathleen Fuller, Charles Hadlock, Simon Johnson, Elaine Kim, Woochan Kim, Rafael La Porta, Florencio Lopez-de-Silanes, Vojislav Maksimovic, John McConnell, Todd Mitton, M. P. Narayanan, Andrei Shleifer, David Smith, Daniel Wolfenzon, Bernard Yeung, and especially the referee of the Journal. We also thank participants of the Conference on International Corporate Governance at the Tuck School of Business, 2nd Asian Corporate Governance Conference in Seoul, Estes Park Conference, 2002 Northern Finance Association Annual Meetings, the University of Michigan International Finance, Finance, and Law and Economics workshops, KAIST, University of Georgia, George Washington University, University of Miami, University of Notre Dame, and Ohio State University workshops, where earlier versions of the paper were presented under different titles. We would also like to thank Nick Bradley, Ian Byrne, George Dallas, and Laurie Kizik for providing us with S&P Transparency Rankings and CLSA Corporate Governance Scores, Mara Faccio and Larry Lang for their generosity in sharing their ownership data, and Vlad Charniauski for excellent research assistance.
Firm Attributes, Legal Environment, and Valuation
ABSTRACT
Newly released data on corporate governance and disclosure practices reveal wide within-country variation, with the variation increasing as legal environment gets less investor friendly. This paper examines why firms practice high-quality governance when law does not require it; firm attributes related to the quality of governance; how the attributes interact with legal environment; and the relation between firm valuation and corporate governance. A simple model, in which a controlling shareholder trades off private benefits of diversion against costs that vary across countries and time, identifies three relevant firm attributes: investment opportunities, external financing, and ownership structure. Using firm-level governance and transparency data on 859 firms in 27 countries, we find that firms with greater growth opportunities, greater needs for external financing, and more concentrated cash flow rights practice higher-quality governance and disclose more. Moreover, firms that score higher in governance and transparency rankings are valued higher in the stock market. Equally important, all these relations are stronger in countries that are less investor friendly, demonstrating that firms do adapt to poor legal environments to establish efficient governance practices.
JEL Classification: G32 (Financial Policy; Capital and Ownership Structure), K23 (Corporation and Securities Law)
Keywords: Corporate Governance, Investment Opportunities, External Financing, Ownership, Legal Environment, Valuation
Do all firms in weak legal regimes suffer from poor corporate governance, whereas firms in strong legal regimes practice uniformly high-quality governance? Or do firms adapt to poor legal environment as in Coase (1960), resulting in some firms having higher quality governance than is required by law? Newly released data on 859 firms in 27 countries reveal wide within-country variation in governance and disclosure practices, with the variation increasing as legal environment gets less investor friendly. This raises several questions: Does the wider variation in weaker legal regimes simply reflect greater latitudes allowed by lower minimum standards? Or is there a systematic pattern in which firms choose their quality of governance amid greater latitude? If so, what are the relevant firm attributes and how are they related to the observed governance practices? Is the quality of governance priced in stock markets, and if so, is it economically significant for corporate decision makers to take notice? These are the issues addressed in this paper.
Previous studies have examined the effects of legal environment on corporate governance, and the relation between corporate governance and firm performance. Specifically, it has been shown that better legal protection for investors is associated with higher valuation of the stock market (La Porta et al. (2002)), higher valuation of listed firms relative to their assets or changes in investments (Wurgler (2000)), and larger listed firms in terms of their sales and assets (Kumar, Rajan, and Zingales (1999)). Furthermore, industries and firms in better legal regimes rely more on external financing to fund their growth (La Porta et al. (1997), Demirgüç-Kunt and Maksimovic (1998), and Rajan and Zingales (1998)).
Although these country-level studies provide valuable insights into the effects of regulatory environment, they do not address firm-level issues such as what drives different governance practices across firms within a legal regime or how governance affects individual firm valuation. Previous studies on the relation between governance and firm performance using U.S. data show
mostly mixed and somewhat conflicting results.1 Recent studies based on international data, on the other hand, are more affirmative: Black (2001) and Black, Jang, and Kim (2002) demonstrate a strong relation between corporate governance and firm valuation in Russia and Korea, and Doidge, Karolyi, and Stulz (2003) show that foreign firms listed on U.S. stock markets are valued higher (see Denis and McConnell (2003) for a recent review of the literature).
Building on insights provided by these authors, this paper offers four main contributions. First, it documents a wide within-country variation in corporate governance that decreases with the strength of legal environment. Second, the paper identifies three firm attributes related to the quality of governance, analyzes their interaction with legal environment, and empirically examines the hypothesized relations. Third, it re-examines the relation between governance and firm valuation by using a large sample of firms for 27 countries. Finally, the paper documents stronger relations between firm attributes, governance practices, and firm valuation in less investor friendly countries.
To identify relevant firm attributes, we provide a simple model of optimal diversion of corporate resources by a controlling shareholder who faces private costs of diversion that increase with the strength of legal environment. The costs are also asset-specific and vary over time, which sometimes cause the shareholder to reject positive net present value (NPV) projects in the process of diversion. This potential value destruction and the costs are traded off against private benefits in determining the optimal diversion.
The model predicts that (1) firms with better investment opportunities, higher concentration of ownership, and greater needs for external financing practice better governance; (2) firms that practice better governance have higher value; and (3) these relations are stronger in weaker legal regimes.
1 A partial list of these studies includes Bhagat and Brickley (1984), Demsetz and Lehn (1985), Bhagat and Jefferis (1991), Demsetz and Villalonga (2001), and Gompers, Ishi, and Metrick (2003). See Denis and McConnell (2003) for a more complete list.
The basic intuitions underlying these predictions are simple. One is less likely to commit crime if one has something valuable to lose: profitable investment opportunities. One does not steal from oneself: ownership concentration. One does not spit into the well from which one drinks: external financing. As for the interplay between firm attributes and legal environment, good corporate governance driven by private incentives becomes a more important mitigator in alleviating the harmful effects of ineffective legal framework when regulation is weak. And finally, good corporate governance is valued higher where it is scarce; namely, in weaker legal regimes.
These predictions are tested with data on the quality of corporate governance practice compiled by Credit Lyonnais Securities Asia (CLSA), while using Standard and Poor’s (S&P) disclosure data as a robustness check. The CLSA data rely on an intuitively appealing comprehensive, yet partially subjective method, while S&P scores are objective. In making the transition from theory to empirically testable hypotheses, we relate the optimal diversion of corporate resources to the quality of governance practice. To check if governance practices are a reasonable proxy for diversion, we relate corporate scandals to CLSA scores. We find that firms with low CLSA governance scores are more likely to be mentioned in scandals reported by the media.
As predicted by the model, the quality of governance practice is positively related to growth opportunities, concentration of ownership, and need for external financing. Furthermore, these relations are stronger in less investor friendly legal environments. Consistent with Coase, firms seem to adapt to legal environments to effect efficient governance practices.
The data also reveal that firms with better governance enjoy higher valuation.2 One standard deviation increase in governance score increases a firm’s market value by 9.0 percent, on average, with a stronger impact in weaker legal regimes. For example, for firms in Mexico, which
scores the lowest in our sample in terms of the strength of legal framework, one standard deviation in governance scores changes the market value by 12.6 percent, whereas the same change in Hong Kong or Chile, which provides the strongest legal framework in our sample, affects the value by only 5.6 percent.
Section I describes the data on governance and disclosure practices, relates them to corporate scandals, and demonstrates the wide within-country variation. Section II presents the simple model to provide empirical hypotheses concerning the relations among the three firm attributes, quality of governance, legal environment, and firm valuation. Empirical design and data are described in Section III. Section IV reports empirical results, and Section V provides robustness checks. The concluding section contains a summary and implications.
I. Within-Country Variation in Corporate Governance Practices
In this section we describe the data on the quality of governance and disclosure practices. We also compile corporate scandals for a sub-sample of firms and examine the relation between scandals and governance scores. Then we document that both governance scores and disclosure scores reveal wide within-country variation inversely related to the strength of legal environment.
A. CLSA Corporate Governance Scores
CLSA (2001) issued a report on governance practices by 494 companies in 24 countries providing scores on the quality of governance in year 2000. Firms are selected based on size (large) and investor interest (high). The governance scores are based on responses from financial analysts to 57 questions that are used to construct scores on a 1-100 scale, where a higher number indicates better governance. According to CLSA, 70 percent of the scores are based on objective information and all questions have binary answers (yes/no) to minimize analysts’ subjectivity.3 It also attempts to provide firm-level information beyond the mere effect of legal environment:
3 Anecdotal evidence supporting CLSA’s claim of objectivity is a report that CLSA has “lost quite a bit of corporate finance business” with companies that were assigned the worst corporate governance scores and that CLSA may stop compiling the scores. (South China Morning Post: Hong Kong; Nov 2, 2001).
“Our scores do not mark down a company simply for being in a country that might be perceived to have a weak regulatory or legal framework." [CLSA Emerging Markets (2002), p. 9]
Scores on the 57 questions are grouped into six categories of corporate governance and an index of social responsibility: discipline (managerial incentives and discipline towards value maximizing actions), transparency (timely and accurate disclosure), independence (board independence), accountability (board accountability), responsibility (enforcement and management accountability), protection (minority shareholder protection); and social awareness
(social responsibility). We compute the composite governance index, COMP, by taking a simple average of the first six categories and examine social awareness separately.
B. Corporate Scandals
To investigate whether the quality of governance practices measured by CLSA scores are related to corporate misdeeds, we compile scandals for 84 firms in 14 countries that have CLSA scores for more than 11 firms.4 For each country we select the top three and the bottom three firms in CLSA composite score and manually scan for mention of these companies in articles in the Lexis-Nexis database during a three-year period—01/01/1999 through 12/31/2001.5 We then look for scandals such as asset expropriation, accounting misreporting, earnings manipulation, stock price manipulation, insider trading, share dilution, and undertaking illegal projects. There are 29,320 articles covering stories on the sample firms, from which we identify 49 scandals— if the same scandal appears in multiple articles, we count it only once. Many are media accusations of wrongdoing that have not yet been tried in court. The majority of companies (68 percent) have no reported scandals while those with scandals have, on average, 1.8 scandals reported.
The simple correlation between the number of scandals, SCAND, and CLSA composite score is −0.36 (p-value = 0.00), suggesting that more firms with low CLSA scores are linked to
4 These countries are Brazil, Chile, China, Hong Kong, India, Indonesia, Korea, Malaysia, Philippines, Singapore, South Africa, Taiwan, Thailand, and Turkey.
scandals. However, other factors may also be related to scandals being reported: the legal environment; the investigative ability of news media and the freedom to report scandals; and the relative media attention a firm receives in general.
B.1 Measures of Legal Environment and News Media
Our measure of the strength of legal environment is based on both de jure and de facto
aspects of regulation. The de jure measure of investor protection, INVESTOR, is the anti-director rights (shareholder rights) index defined in La Porta et al. (1998a), and it ranges from 0 to 6. We cannot rely solely on this measure because India and Pakistan, countries which do not have the best de facto investor protection, score 5, the highest in our sample on INVESTOR. To measure the strength of de facto regulation, we use the rule of law index, ENFORCE, from the
International Country Risk Guide as a proxy for law enforcement. The rule of law assesses the law and order tradition of a country, and it ranges from 0 to 10.6
There is little correlation between de jure and de facto measures of regulation. The correlation coefficient between INVESTOR and ENFORCE is only 0.18 with p-value = 0.38. We multiply INVESTOR by ENFORCE to construct a measure that reflects both aspects of regulation, and define it LEGAL.
The investigative ability of news media and the freedom to report scandals is proxied by circulation of daily newspapers per capita reported in Dyck and Zingales (2002), NEWS. The relative media attention a firm receives is proxied by the log of the total number of articles covering stories on the sample firm, TOTAL.
6ENFORCE is calculated as the 1999-to-2000 monthly average. As in La Porta et al. (1998a) the original series is transformed from 0-6 to 0-10. An alternative is to use the efficiency of the judicial system index reported in La Porta et al. (1998a). We use the rule of law for two reasons. First, using the efficiency of the judicial system would reduce our sample size because this variable is not defined for China, Hungary, Poland, and Russia in La Porta et al. (1998a). Second, the two variables are highly correlated. The correlation between the rule of law and the efficiency of the judicial system (based on the sample of countries in La Porta et al. (1998a)) is 0.64 (p-val = 0.00).
B.2 Relation between CLSA Scores and Scandals
We regress the number of scandals, SCANDAL, on CLSA composite score, COMP, as well as on LEGAL, NEWS, and TOTAL. Because observations on individual companies in a given country are not independent, we estimate the regression with country-random effects, which takes into account that errors among observations are correlated. The validity of the random effects specification is justified by the Breusch and Pagan (1980) test that rejects the null hypothesis that the errors are uncorrelated within countries.
The results are reported in Table I with two specifications: the first controls for LEGAL and
TOTAL, and the second adds NEWS to the first specification. The coefficient on COMP is significantly negative in both specifications, indicating that firms scoring low on CLSA ratings are more likely to have scandals reported in media.7 The coefficient on TOTAL is significantly positive in both specifications, suggesting that greater media attention tends to lead to more exposure of corporate scandals.
The coefficients on LEGAL and NEWS are not significant, however. We suspect two offsetting effects are going on in both variables. Take the case of NEWS. To the extent that higher newspaper circulation leads to greater exposure of corporate scandals, one would expect a positive correlation. However, higher circulation can also have a preventive effect as documented by Dyck and Zingales (2002). Similarly, a more efficient judicial system may lead to more exposure of scandals, but may also have a preventive effect reducing the number of wrongdoings that can be exposed by the media.
C. Standard & Poor’s Transparency Scores
As a robustness check on results based on CLSA scores, we use Standard & Poor’s measure of corporate disclosure practices for 573 companies in 16 emerging markets and 3 developed countries in 2000. The measure counts whether a firm discloses relevant information on 91
7 Khanna, Kogan, and Palepu (2002) also examine corporate scandals for Indian firms covered by CLSA and find a significant negative correlation between scandals and CLSA rankings.
possible items that would be of interest to investors: 22 items on ownership structure and investor relations (ownership), 34 items on accounting and financial policies (disclosure), and 35 items on board and management structure and process (board). Then it assigns scores from 0 to 22 for
ownership, from 0 to 34 for disclosure, and from 0 to 35 for board. The scores of the three categories are summed to create an aggregate transparency score, TRAN, ranging from 0 to 91, which is equivalent to assigning an equal weight to each disclosed item.8
We interpret these scores as an indicator of the quality of disclosure practice. If a firm has more disclosure on ownership-related items, for example, we infer the firm has less to hide and hence has a relatively sound practice on matters concerning ownership structure. Conversely, reluctance to reveal items concerning board structure is interpreted as having a relatively unsound practice in that category.
The advantage of S&P scores lies in its objectivity, whereas CLSA scores are comprehensive, but susceptible to subjectivity. S&P scores, however, depend only on the number of disclosures, and do not reflect the content. They are best viewed as a measure of transparency and not a comprehensive measure of corporate governance.
D. Consistency across CLSA and S&P Scores
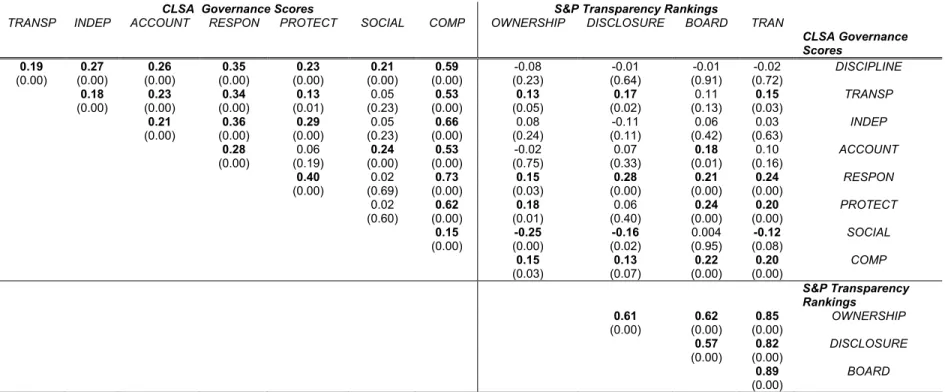
To determine whether companies scored high on corporate governance by CLSA are also scored high on disclosure by S&P, we identify 208 companies that are ranked by both agencies. Table II reports correlation coefficients between different categories of CLSA and S&P scores. All of the categories of CLSA scores are highly correlated with each other except for social awareness. Different categories of S&P scores are also significantly correlated with each other, indicating that firms that disclose more in one category tend to disclose more in other categories.
The correlations across CLSA and S&P scores reveal that CLSA composite index, COMP, is significantly correlated with S&P aggregate score, TRAN. To check whether the correlation is due
to country and industry differences, we regress CLSA composite index on S&P aggregate score with country and industry dummies. The relation remains significant, confirming the consistency between the two rankings.9
Although scores on many individual categories of the CLSA ranking are not correlated with those of S&P’s ranking, the correlations are positive and significant when the individual categories are measured on overlapping characteristics. For instance, S&P score on accounting and financial policies (disclosure) is significantly correlated with CLSA score on transparency; S&P score on board and management structure and process (board) is significantly correlated with CLSA score on board accountability (accountability), and so on. These correlations, as well as the lack thereof, suggest that S&P scores provide valuable data to check the robustness of results based on CLSA scores.10
E. Within-Country Variation of Corporate Governance Scores
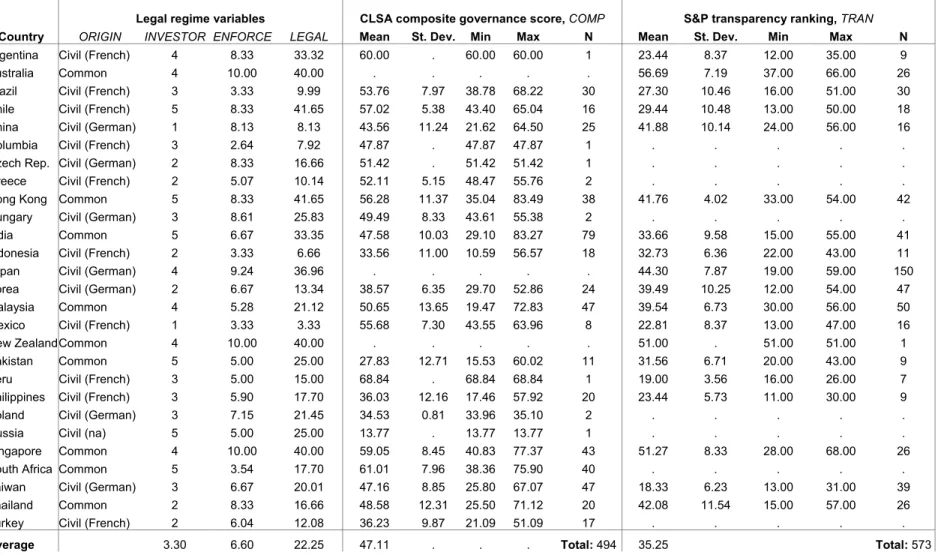
Table III provides summary statistics by country for legal regime variables, CLSA composite scores, and S&P aggregate scores. To examine whether countries with strong legal frameworks tend to have high average CLSA and S&P scores, we regress the country average scores on
LEGAL for countries with tenor more firms. For CLSA scores, we obtain:11
COMP = 37.25 + 0.43 * LEGAL (R2 = 0.25, N = 15), [1] [0.00] [0.01]
9 The regression is:
COMP = 0.16×TRAN + Σi di+ Σc dc R2 = 0.46, [0.05]
where di and dc are industry and country dummies (coefficients not reported), respectively, R2 is the coefficient of determination, and the number inside brackets is the probability level at which zero coefficient can be rejected.
10 It is possible that the firms in CLSA and S&P rankings may suffer from selection and reporting bias; namely, only firms with good governance practices may cooperate with the CLSA survey and the ranking agencies may choose firms that are easier to assign scores. However, companies have incentives to cooperate because exclusion from the ranking may create ill reputation, and the ranking agencies have a commercial interest in listing a well-balanced portfolio of companies. We further investigate the sample selection issue in Section V.
11 For S&P scores the regression gives the following results:
TRAN = 28.72 + 0.36 * LEGAL (R2= 0.24, N = 14). [1a] [0.00] [0.06]
where R2 is the coefficient of determination, N is the number of countries, and the numbers inside brackets are probability levels based on heteroschedasticity-consistent standard errors at which the null hypothesis of zero coefficient can be rejected.
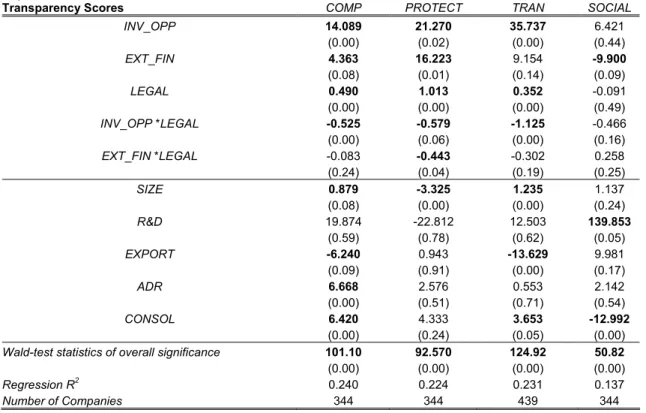
Given the result in [1], we define the conditional variation of individual firm governance practices as the portion of governance scores not explained by legal regime. Namely, we repeat [1] at the firm-level for CLSA composite score, COMP; CLSA score on investor protection,
PROTECT; and S&P transparency ranking, TRANS. We then take the absolute values of the residuals and regress the deviations on LEGAL. The results are reported in Panel A of Table IV. The coefficient on LEGAL is negative and significant in all cases. Thus, we conclude within-country variation in governance and disclosure practices is larger when legal environment is less investor friendly.
As stated at the outset, these variations raise several questions. Does the inverse relation between within-country variation and legal environment simply reflect greater latitudes allowed by lower minimum legal standards? Why do firms practice high-quality governance when law does not require it? What are the attributes, if any, that are related to a firm’s choice of governance? How do these attributes interact with legal environment in Coase’s sense? We address these questions next.
II. Theoretical Considerations
We consider an environment similar to Johnson et al. (2000) and Shleifer and Wolfenzon (2003), in which controlling shareholders divert corporate resources for private benefits and diversion is costly.12 Following Shleifer and Vishny’s (1997) view that “Corporate governance deals with the ways in which suppliers of finance to corporations assure themselves of getting a return on their investment.” (p. 737), we define the quality of governance as the degree to which
12 Because the primary purpose of this section is to provide motivation for empirical tests, we do not consider issues such as determinants of initial ownership and capital structure in different legal regimes (e.g., Friedman, Johnson, and Mitton (2002)). Nor do we consider the reputation-type issues discussedin Diamond (1991), Maksimovic and Titman (1991), and Gomes (2000).
non-controlling shareholders get their fair share. Specifically, we relate diversion to corporate governance by defining the quality of governance as (1-d), where d is the proportion of firm value diverted from the maximum attainable value at zero diversion with the value maximizing investment policy. Thus, a high level of d implies poor governance practice, where d is broadly defined to include a wide range of value-decreasing activities from what Jensen and Meckling (1976) define as excessive shirking and corporate perks to outright stealing of tangible and intangible corporate resources.13
This definition of the quality of governance captures various governance and managerial practices in place that affect firm value for all shareholders, where the practices may or may not be legally binding. Therefore, the six categories of governance practice defined by CLSA— independence and accountability of the board of directors, financial incentives and managerial discipline for value creation, enforcement of managerial responsibility and accountability, timely and accurate disclosure of relevant information, assurance to maintain auditors’ independence, and protection of minority shareholders—represent the key aspects of our definition.
A. Costs and Timing of Diversion
The costs of diversion to the controlling shareholder can be categorized as direct and indirect. The direct costs are of three types. One is the (expected) penalty when diversion is illegal and the shareholder is caught. Such penalties may take the form of fines, jail terms, and loss of reputation that may hurt the shareholder’s future business or employment opportunities. Another type is the cost incurred for the act of diverting resources, such as bribes to employees, regulators, and politicians. A third type is the deadweight loss arising from the fact that the private value of excessive corporate perks or cash equivalent value of diverted resources is often less than their fair value.
13 Because of the opportunistic nature of stealing and the incentive to hide it, stealing takes many different forms that are sometimes highly creative. See Johnson, LaPorta, and Lopez-de-Silanes (2000) for a description of tunneling and Siegel (2003) for examples of various legal and illegal assets taking by controlling shareholders and CEOs of Mexican firms during the mid-90s.
These costs vary across countries due to differences in regulatory environment, with higher costs in countries with strong legal protection for investors.14 Costs also vary across industries within a legal regime due to differences in the nature of assets and business models involved. For example, the costs are higher for tangible assets because it is easier to steal ideas or business plans than factories and buildings, and for firms in regulated industries because they are more closely monitored.
The costs also vary over time, and diversion takes place when the chances of getting caught, or more generally, the costs, are the lowest. For example, if the controlling shareholder has a special connection to the current political regime that will be replaced soon, or has an unusually cooperative auditor who will retire soon, diversion is likely to occur now rather than later. Likewise, the direct costs of diversion are lower when a project is at the idea or business plan stage than after the project becomes tangible assets such as plants and equipment.
If the cost of diversion increases sufficiently after investments, diversion may impose indirect costs in the form of rejecting positive NPV projects. Consider a controlling shareholder who owns 30 percent of a firm’s cash flow rights. The firm has just identified a profitable business opportunity after spending a considerable amount of corporate resources. Instead of having the firm undertake the project, however, she is contemplating whether to give the project to her son and have him take the project within a new private firm, which she owns 100 percent. If the project is undertaken by the original firm, its NPV is $1,000; but under the new firm, it is worth only $700 because the new firm does not have the necessary facilities to undertake the project.
14 We assume the strength of legal regimes is exogenous to the observed level of malfeasance. As witnessed during the recent corporate scandals following the Enron debacle, however, governments react to revelations of widespread corporate misdeeds, with those more responsive to public opinions being more inclined to undertake legal reforms. There are several justifications for our assumption. First, reforming legal systems is a slow process because it inevitably becomes a political issue, with the controlling shareholders–and those who benefit by association–insisting on the status quo (see Bebchuk and Roe (1999) and Rajan and Zingales (2002)). Second, if the number of firms is sufficiently large, the controlling shareholder may behave as if her actions will have no effect on the cost of diversion. Finally, the cost can be interpreted as the shareholder’s perceived cost that takes into account the effects of her action on future legal reforms.
The shareholder has to make two decisions: (1) to steal or not to steal and (2) when to steal. If the first decision has to be made now for some reason and the cost of stealing is ten percent, she will steal because the net benefit is $630 ($700×0.9), whereas her share of the firm’s NPV is only $300 ($1,000×0.3). However, she will be better off having the original firm make the investment and stealing later, if the cost of stealing remains unchanged at 10 percent, because the net benefit of stealing later increases to $900 ($1,000×0.9).15
Generally it costs less to steal an idea or a new business plan than to steal tangible assets, such as plants and buildings, resulting from investments because of difficulties in identifying properties involved and exercising property rights. If the costs of stealing increase to, say, 40 percent after the investment is made, it would be better to steal now because the net benefit of stealing later would be only $600 ($1,000×0.6). The end result will be a destruction of value: the reduction of NPV from $1,000 to $700.
Therefore, timing of diversion depends on how costs vary over time; and sometimes diversion imposes an indirect cost in the form of rejecting positive NPV projects. In practice, however, the timing is not as clear-cut as suggested in the example, as the beginning of one period represents an end to the preceding period. Furthermore, how the costs change over time differs across firms and projects because of firm-specific situations and project-specific factors.
B. A Simple Model
To incorporate these various aspects of costs and timing of diversion in a simple model that can provide empirically testable hypotheses, two approaches can be taken: (1) The increase in direct costs after investments is large enough to force the controlling shareholder to choose between diversion and investments now–e.g., steal before investments are made as in Johnson et al. (2000). (2) The cost increase is small enough to make her wait until after investments are made–e.g., steal later as in Shleifer and Wolfenzon (2003). In this paper we take the first
approach in the text and consider the second in Appendix A. Both approaches lead to the same set of hypotheses. The trade-off between the private benefits of diversion and rejection of profitable projects with a linear cost function drives the results in the first approach; in the second, it is the trade-off between the private benefits and the convexity in the cost of diversion.
We consider a simple investment opportunity set in a single period. The firm will liquidate when the returns are realized, from which the controlling shareholder collects her share of the liquidating dividends. The interest rate is zero and investors are risk-neutral such that the cost of capital is zero.
The gross return per unit of physical capital invested in project j is equal to
1
+
π
(
j
)
, where0
≥
j
andπ
(
j
)
is linear and decreasing in j for all firms with each firm having a maximum of 0>
π . Although we do not put subscript i to
π
for notational simplicity,π
varies across firms and, hence, is the variable that differentiates the profitability of investment opportunities across firms. With this definition, the gross return for the jth unit of capital invested can be written asj
j
=
+
−
+
π
(
)
1
π
1
. If a firm takes all positive NPV projects, it will invest until1
+
π
−
j
=
1
, and the units of capital invested will be j=π.The cost of diversion is assumed to be linear; it is a constant fraction, c, of the amount diverted. In this situation the controlling shareholder, who owns α fraction of cash flow rights, will divert only when c<1−
α
, because one dollar of diversion creates wealth transfer of 1 – αfrom other shareholders giving her a net benefit of 1 – α – c.16
The controlling shareholder will invest as long as her share of liquidating dividends from a project is greater than the after-cost diversion, namely, if α(1+π(j))>1−c. Thus she will invest up to the point where:
α(1+ −π j)= −1 c . [2]
Equation [2] gives the controlling shareholder’s optimal level of investment, j c c c * ( ) ( ) = + − − − + < < − ≤ − + 1 1 1 1 1 0 1 1 π α π α α π α if if . [3]
To obtain the optimal diversion, the cash equivalent value of the firms’ assets, or internal funds available, is written as F=π +e>0, where e is a constant indicating whether the firm has sufficient funds to invest in all positive NPV projects (e ≥ 0) or not (e < 0).17 The funds remaining after the investment, F− j*, will be diverted if the after-cost benefits of diversion is greater than the controlling stockholder’s share of liquidating dividends from it: (F - j*)(1 - c) > a(F - j*) or
α
− <1
c . Thus, the optimal amount of diversion D* is equal to F− j if c < 1 - α, and 0 otherwise. Since F =π +e, it follows from equation [3] that
D c +e c e c * ( ) ( ) = − − − + < < − + ≤ − + 1 1 1 1 1 1 α α π α α π π α if if . [4] Dividing D* by the firm’s endowment, π +e, we obtain our proxy for the quality of corporate governance, the optimal proportion of firm value diverted,
d c e e c c * ( ) ( ) ( ) = − − + + − + < < − ≤ − + 1 1 1 1 1 1 1 α α α π π α α π α if if . [5]
Figure 1 illustrates the investment opportunity set with e = 0 and how the firm value is reduced due to diversion and rejection of positive NPV projects. The Investment opportunity is denoted by the broken line. The maximum possible value of the firm at d* = 0 is represented by the area
(
1
+
π
)
BC
0
. The optimal diversion, D*, reduces the NPV of the firm by the triangle area ABE reducing the value of the firm to the smaller are of(
1
+
π
)
AF
0
.17 The budget constraint, j<π +e, may become binding if e is negative, i.e., the endowment is insufficient to fund all positive NPV projects. Although the above derivations assume non-negative e, it is easy to show that all the results hold with negative e.
C. Hypotheses
Equation [5] specifies how d* is related to the variables of interest, namely, c, α, and
π
. Taking partial derivatives of d* with respect to these variables provides a number of testable hypotheses. The most obvious is that d* is negatively related to the cost of diversion c, ourproxy for the strength of legal environment. Restating the well-known result,Hypothesis 1: In strong legal regimes (high-c countries), firms will divert less and practice higher quality corporate governance.
Taking partial derivative of d* with respect to π , profitability of investment opportunities,
∂ ∂π α α α π π α α d c e e c * ( ) ( ) = + − − + − + < < − 1 1 1 1 0 2 < 0 if otherwise . [6] This derivative is negative because diversion takes place only when c<1−α. The intuition is straightforward. When investment opportunities are more profitable, the controlling shareholder’s share of return from investments is larger relative to the benefits of diversion. Thus, we obtain
Hypothesis 2: Controlling shareholders of firms with more profitable investment opportunities
divert less for private gains and practice higher quality corporate governance.
Equation [6] also implies that when a firm suffers a substantial drop in profitable investment opportunities, the controlling shareholders will divert more corporate resources. Johnson et al. (2000) document such behavior by Asian firms before the Asian financial crisis. In the U. S. the media alleges similar actions by the top management of Enron, Worldcom, and other firms with subsequent scandals, prior to their filing bankruptcy.18
The impact of investment opportunities on governance practice may vary across legal regimes, which can be seen by taking derivative of equation [6] with respect to c,
18 Equation [6] also shows that the partial derivative is zero when c<1−α(1+π). Such circumstances arise when investor protection is so weak (c is so small relative to profitability of investment opportunities) that the firm’s entire resources are diverted without undertaking any investments.
∂ ∂π∂ α π π α α d c e c * ( ) ( ) = + − + < < − 1 1 1 1 0 2 > 0 if otherwise . [7] Equation [7] shows that the sensitivity of diversion to investment opportunities falls as the cost of diversion rises. In other words, the positive relation between investment opportunities and the quality of governance is stronger in weaker legal regimes. This is because the potential value destruction from rejecting positive NPV projects is greater in weaker legal frameworks and those with good investment opportunities have greater incentives to mitigate it through good governance. We propose
Hypothesis 3: The impact of investment opportunities on the quality of governance practices is
stronger in a country with weaker legal environment.
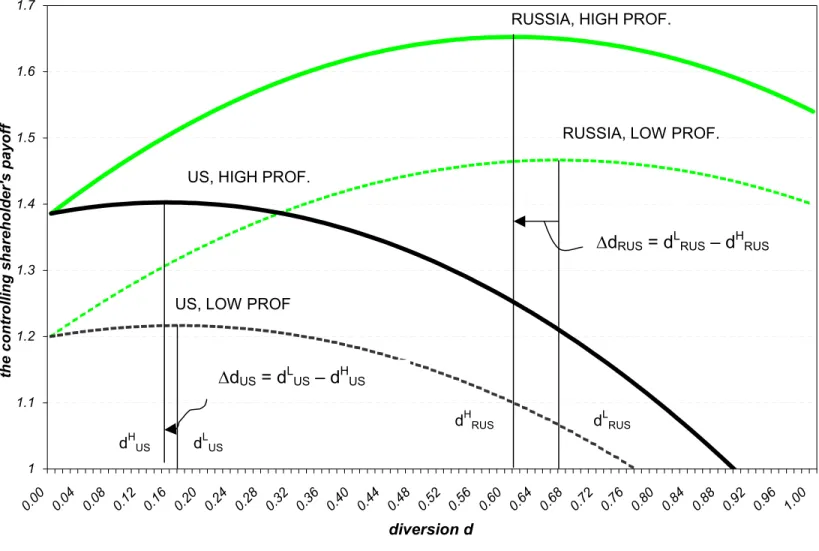
To illustrate, consider two countries, say the U.S. that has relatively low tolerance for diversion and imposes high cost, and Russia that is more tolerant and imposes lower costs. Hypothesis 3 implies that the same increase in profitable investment opportunities will have a smaller negative impact on d in the U.S. than in Russia.
For numerical illustration assume the cost of diversion, c, is equal to 0.6 in the U.S. and 0.3 in Russia and the excess cash, e, is equal to 0 in all cases. A low profit firm has an investment opportunity set with πL =2 0. . The payoff to the controlling shareholder is
α
MV
+
(
1
−
c
)
D
where the market value, MV, is the present value of gross returns from all projects undertaken;MV =
∫
(−d*) (1+ − j dj) = (1−d*)+ (1−d*2) 2 2 0 1π
π
π
π. With α = 0.3 her payoff is maximized at
dL* =0 67 if the firm is located in Russia; if located in the U.S., . d L
* =017 . Now, assume the . firm’s investment opportunity improves to πH =2 2. . Then the optimal diversion will decrease from 0.67 to 0.61 for the Russian firm. For the U.S. firm the decrease will be smaller; from 0.17 to 0.15.
Figure 2 illustrates the payoff function to the controlling shareholders as well as the optimal diversion levels. The figure also shows that the variation in d is greater in Russia than in the U.S.19 Thus we conjecture
Conjecture 1: Everything else being equal, within-country variation in the quality of governance
is greater in weaker legal regimes.
The impact of ownership concentration can be seen by differentiating d* with respect to α,
∂ ∂α α π π α α d c e c * ( ) ( ) = − − + − + < < − 1 1 1 1 0 2 < 0 if otherwise . [8] This is the well-known Jensen and Meckling (1976) agency argument that entrepreneurs with higher ownership divert less, which can be restated as
Hypothesis 4: Controlling shareholders with greater cash flow rights practice higher quality
corporate governance.
A more interesting result is obtained by differentiating equation [8] with respect to c,
∂ ∂α∂ α π π α α d c e c * ( ) ( ) = + − + < < − 1 1 1 1 0 2 > 0 if otherwise . [9] Equation [9] shows that the sensitivity of diversion to ownership concentration falls as the cost of diversion rises. In other words, the positive relation between ownership and the quality of governance is stronger in weaker legal regimes. In the absence of adequate legal protection for investors, concentrated ownership becomes a more important tool to resolve the agency conflict between controlling and minority shareholders.20 Thus we propose
19 Assume two-firm economies in which both firms L and H exist in the U.S. and in Russia such that the deviation in π between the two firms in both countries is the same 0.2. But the deviation in d* is 0.06 in Russia and 0.02 in the U.S. Thus firms in Russia would show greater variation in corporate governance than those in the U.S. The variation also depends on π because d* is negatively related to π . To illustrate, again consider a two-firm economy in which firm L’s π is 3 and firm H’s π is 3.3, the same 10 percent difference as above. In this case d*L = 0.44 and d*H = 0.40 in Russia and, d*L = 0.11 and d*H = 0.10 in the U.S., reducing the deviation in d* to 0.04 in Russia and 0.01 in the U.S.
Hypothesis 5: The impact of ownership concentration on the quality of governance is greater in
a weaker legal regime.
Although it is not shown in equation [5], the quality of governance may also be related to external financing. We have already shown an obvious reason: Firms with profitable investment opportunities will have better corporate governance. If profitable investment opportunities lead to more external financing, firms with greater external financing are likely to have better corporate governance.
Demirgüç-Kunt and Maksimovic (1998), however, predict the opposite. They argue that profitable firms have more internally generated funds and, hence, rely less on external financing. Thus we isolate the impact of external financing from that of profitability of investment opportunities by assuming that investment is given. We also assume that external financing is bounded from above by a minimum level of cash flow rights necessary to maintain the control and that new investors rationally anticipate diversion. Under these assumptions we show in Appendix B that firms in greater need for external financing have greater incentives to enhance the quality of governance, which leads to
Hypothesis 6: For a given level of profitable investment opportunities, controlling shareholders
of firms with greater need for external financing will practice higher quality governance.
One reason firms in weaker legal regimes have difficulty raising external capital is investors’ lack of trust in protection of their rights. Firms have incentives to alleviate their concerns by practicing high-quality governance, with the incentive being greater among firms that suffer more from the adverse effect; namely, firms located in weaker legal regimes. Hence we conjecture
Conjecture 2: The positive relation between external financing needs and the quality of
governance is stronger in a weaker legal environment.
Finally, we examine the relation between the quality of governance and firm valuation by defining the market value of a firm, MV, as the present value of gross returns from projects,
MV=
∫
(−d*)( +e)(1+ − j dj) = +(1 )(1−d*)( + +e) ( +e) (1−d*) 2 2 2 0 1 π π π π π . [10] Equation [10] shows that the market value of the firm increases as d* decreases; thus,Hypothesis 7: Firms with high-quality governance are valued higher.
Since high-quality governance is relatively scarce in weak legal regimes, everything else being equal, the few firms with good governance are likely to be valued more in poor legal environment. Thus,
Conjecture 3: The impact of the quality of governance on firm valuation is greater in weaker
legal regimes.
III. Empirical Design and Data A. Regression Specification
To investigate the relation between firm attributes and the quality of governance and their interaction with legal environment, we regress individual firms’ CLSA and S&P scores on measures of investment opportunities, needs for external financing, ownership concentration, and the strength of legal environment, while controlling for industry and other firm characteristics. Specifically, we estimate the following cross-sectional country-random effects regression,
CORP GOV INV OPP EXT FIN OWN CASH LEGAL
EXT FIN LEGAL INV OPP LEGAL OWN CASH LEGAL
Z d jc jc jc jc c j c c jc c cj c k k K k jc i i I j c _ _ _ _ _ _ _ * , = + ∗ + ∗ + ∗ + ∗ + ∗ ∗ + ∗ ∗ + ∗ ∗ + + + = = −
∑
∑
α β β β γ γ γ γ δ ε 1 2 3 1 2 3 4 1 1 1 , [S1]where CORP_GOV is corporate governance or transparency scores; α, a constant; INV_OPP, investment opportunities; EXT_FIN, the need for external financing; OWN_CASH, concentration of cash flow rights; LEGAL, the strength of a country’s legal regime. INV_OPP*LEGAL,
EXT_FIN*LEGAL, and OWN_CASH*LEGAL are interaction terms of legal regime with
investment opportunities, external financing, and ownership concentration, respectively. Z are control variables; and d, industry dummy. And c stands for country; i, industry; j, firm; k, control variables; I, the number of industries; and K, the number of control variables.
Four different scores are used as a proxy for CORP_GOV: CLSA scores on the composite index, COMP, investor protection, PROTECT, and social awareness, SOCIAL, or S&P aggregate score, TRAN. Of the six CLSA governance categories, we single out PROTECT because it is the most direct measure of investor protection against theft and, hence, is more relevant to ownership concentration than COMP. Ownership concentration is hypothesized to help improve investor protection; however, there is no obvious reason to expect firms with more concentrated ownership to disclose more and be more transparent. Since COMP includes measures of transparency, as well as investor protection and other governance categories, we expect
OWN_CASH to be more closely related to PROTECT than to COMP. SOCIAL is examined separately because it is distinct from (has low correlations with) other CLSA governance categories and corporate social responsibility receives much public attention.
Specification [S1] is estimated by two separate regressions: one with INV_OPP and
EXT_FIN, and another with OWN_CASH as independent variables. These variables are separated for two reasons. First, using all three variables in the same regression substantially reduces the sample size because ownership data are not available for a substantial part of our sample. Second, using all three as independent variables in addition to their interaction terms with LEGAL creates severe multi-collinearity.
We estimate these regressions using country-random effects to take into account that observations on individual firms in a given country are not independent and that errors among observations are correlated.21 Country-random effects specification is supported by the Breusch and Pagan (1980) test, which strongly rejects the hypothesis that the variation of random effects is zero. Moreover, our sample consists only of a sub-sample of the total population of countries and, thus, a random-effects specification is preferable (Greene (1997)).
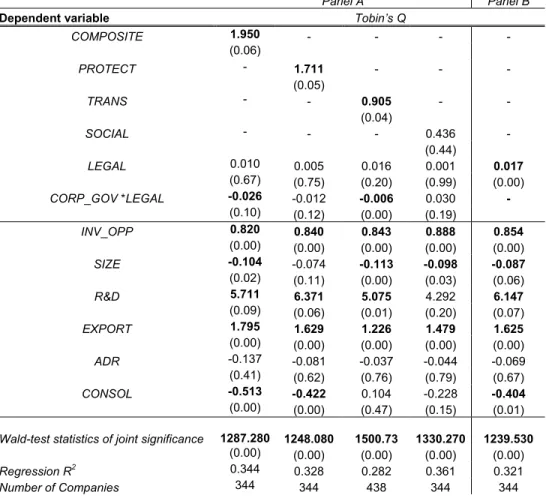
In testing the hypotheses concerning firm valuation and corporate governance, we again control for strength of legal environment, industry, and firm characteristics and estimate the following cross-sectional regression using country-random effects:
Valuationcj CORP GOV LEGAL CG LEGAL Z d
j c c j c c k k K k j c i i I j c = + ∗ + ∗ + ∗ ∗ + + + = = −
∑
∑
α β1 γ1 γ2 δ ε 1 1 1 _ * , . [S2] The inferences one can draw from these regressions are limited because of endogeneity and other econometric problems. To reduce endogeneity, we exercise care in choosing proxies for key variables and sample periods. For example, our measure of EXT_FIN is a projected need for external financing, not an outcome-based measure. We also choose different time periods to estimate the dependent and independent variables in [S1] and [S2]. In addition, we conduct various robustness checks for sample selection, endogeneity, regression model specification, and alternative definitions of main variables. We describe the results in Section V.B. Firm Variables and Data
Because much of the firm-level data originate from financial statements and accounting practices that vary across countries, it is difficult to directly compare the data across countries. However, one of the key distinguishing characteristics in legal regimes is accounting standards; thus, the legal regime variable controls, to some extent, for their differences. Additionally, industry dummies help control for different accounting practices across industries. Any remaining noise would weaken the power of our tests. Most of the firm-level data are obtained from Worldscope. All variables are measured in U.S. dollars.
B.1 Investment Opportunities, External Financing, Ownership, and Valuation
To measure investment opportunities, INV_OPP, we rely on past growth in sales because it is less affected by diversion, manipulation, and different accounting rules than are earnings. We estimate a two-year geometric average of annual percentage growth in net sales from 1998 to 2000, and winsorize it at the 1st and 99th percentile.
In estimating the need for external financing, EXT_FIN, we avoid an outcome-based measure to reduce endogeneity. We use an estimate of projected need for outside capital employed in Demirgüç-Kunt and Maksimovic (1998), which measures the difference between required investment and internally available capital for investment. Required investment is estimated by a two-year geometric average of annual growth rate in total assets from 1998 to 2000; internally available capital for investment by a two-year average of ROE/(1-ROE) over the same period, where ROE is the rate of return on equity based on book value.22
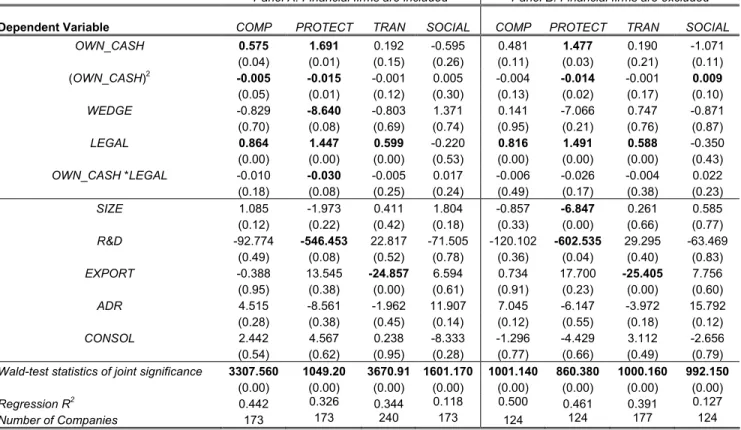
For ownership concentration, we measure concentration of cash flow rights, OWN_CASH, as the share of cash flow rights held by the largest shareholder in 1996 as defined in Claessens, Djankov, and Lang (2002) (CDL). La Porta et al. (1998b, 2002), CDL, and Faccio and Lang (2002) emphasize the difference between control rights and cash flow rights. CDL show that firm value increases with cash flow rights (incentive effect) and decreases when control rights exceed cash flow rights (entrenchment effect). Control rights can exceed cash flow rights because of pyramidal structure, cross-holdings, and dual-class shares. For example, if the controlling shareholder owns ten percent of company A’s outstanding stocks, which in turn owns 30 percent of firm B’s stocks, then she is considered to control ten percent of firm B, the weakest link in the chain of control rights. However, the cash flow rights of firm B owned by the controlling shareholder is only three percent (10%×30%).
Data on cash flow rights and control rights are obtained from Mara Faccio and Larry Lang. Their data overlap our sample for only 173 and 240 firms in 12 and 11 countries for CSLA and S&P samples, respectively.23 Control rights of the largest stockholder exceed the cash flow rights in 40.7 percent of the sample firms. Average ownership of cash flow rights and control rights are 21.07 percent and 25.83 percent, respectively. We define ownership wedge, WEDGE, as a
22 See Demirgüç-Kunt and Maksimovic (1998) for assumptions and justifications for this measure.
23 The countries are Australia, Brazil, Czech Republic, Hong Kong, Indonesia, Japan, Korea, Malaysia, Philippines, Poland, Singapore, Taiwan, Thailand, and Turkey.
dummy variable equal to one if control rights exceed cash flow rights by at least ten percent (19.3 percent of the sample firms) and zero, otherwise.24
Firm valuation is measured as the 2000-to-2001 two-year average of Tobin’s Q. As in La Porta et al. (2002) and Doidge, Karolyi, and Stulz (2003), we define Tobin’s Q as the sum of total assets plus the market value of equity less book value of equity, over total assets. The market value of equity is the number of common shares outstanding, times the year-end price.
This measure of Q, however, may be distorted due to excessive consolidation when partially owned subsidiaries are treated as fully owned subsidiaries. Consolidation of financial statements may also affect our estimates of growth in sales and external financing needs. La Porta et al. (2002) make adjustments for the potential distortion in Q and compare unadjusted Q with the consolidation-adjusted Q. They find a correlation of 0.83 between the two measures and conclude the distortion is not material enough to base their statistical results on adjusted Q. Although we do not adjust for consolidation for the same reason, we check for its effects by adding a consolidation dummy equal to one if a firm consolidates its financial statements, and zero otherwise. The consolidation dummy also controls for the possibility that consolidation of financial statements makes the combined entity more transparent.
As stated earlier, we separate time periods during which dependent and independent variables are measured to reduce endogeneity. Specifically, we use 2000 to 2001 to estimate two-year average Q, 2000 CLSA and S&P scores for CORP_GOV, and 1998 to 2000 to calculate two-year averages for INV_OPP and EXT_FIN, and 1996 for OWNERSHIP.
B.2 Control variables
Industry dummies (di) are included in regressions to account for differences in asset structure, accounting practice, government regulation, and competitiveness, all of which may affect
24 The results do not change when WEDGE is defined by a five percent difference between control rights and cash flow rights.
corporate governance and firm valuation. We classify two-digit SIC industries into 13 groups as in Campbell (1996).25
Firm size, SIZE, is defined as the logarithm of sales. We use sales because they are less sensitive to differences in accounting standards across countries. Because larger firms tend to attract more attention and may be under greater scrutiny by the public, size may affect governance structure. Size also proxies for firm age; older and larger firms tend to have higher book-to-market value ratio.
Research and development expenditure scaled by sales, R&D, is used to control for differences in intangibility of corporate resources, which may be related to cost of diversion. Companies with high R&D expenditures also tend to be high-growth firms and may enjoy high valuation.
Export intensity, EXPORT, is defined as sales revenue generated from shipping merchandise to foreign countries, scaled by sales. This measure is used to control for differences in exposure to globalization pressures in the product market. Companies that conduct more business globally may feel more pressure to conform their corporate governance to global standards (see Khanna, Kogan, and Palepu (2002)).
If a firm has all major financial variables except for R&D and EXPORT, we set those two variables equal to zero; that is, we assume when a company does not report these variables it is because R&D spending or sales generated through export are negligible. Dropping companies with missing data for R&D and export would reduce our sample size considerably and may bias our sample towards technology-oriented firms. As a robustness check and as suggested by Himmelberg, Hubbard, and Palia (1999), we also use two dummy variables, which take values of one when a firm does not report R&D or export. These dummies control for the possibility that non-reporting firms are different from reporting firms.
Finally, ADR dummy variable is included to control for listing on U.S. stock exchanges. Doidge, Karolyi, and Stulz (2003) provide evidence that ADR-listed foreign firms are valued higher. However, Siegel (2003) provides compelling evidence that it is not enforcement of U.S. securities law that causes the higher valuation. Since firms with high-quality accounting and governance practices are more likely to be ADR-listed, we expect ADR to be correlated with the CLSA governance and S&P transparency scores. The dummy variable is equal to one if a firm’s shares or its ADRs are listed on U. S. exchanges in either 1999 or 2000 (15.9 percent of the sample) and zero, otherwise. We exclude privately placed ADRs through Rule 144a and ‘Over-the-Counter’ stocks.
SIZE, R&D, and EXPORT are two-year averages during 1999-2000. Table V provides a summary of variable definitions and data sources.
B.3 Sample Construction
For regression analyses we follow the usual practice of excluding financial institutions because of their unique financial structure, regulatory requirements, and accounting standards.26 This exclusion reduces our sample by 106 and 116 firms in CLSA and S&P samples, respectively. When companies’ identities are ambiguous, we check with the Internet Securities, Inc. (ISI) Emerging Markets database. We drop four and one firms in CLSA and S&P samples, because the ambiguity cannot be resolved, leaving 384 and 456 firms in the CLSA and S&P sample, respectively. Sample sizes are reduced further when relevant variables for each regression are unavailable from Worldscope. When INV_OPP and EXT_FIN enter as independent variables in [S1], 40 and 17 companies are dropped from CLSA and S&P samples due to missing data. One more firm is dropped from the S&P sample when Tobin’s Q is used in [S2] because of missing data.
26 We repeat all regressions including banks and financial firms with a financial dummy variable as a robustness check. The results are stronger due to larger sample sizes.
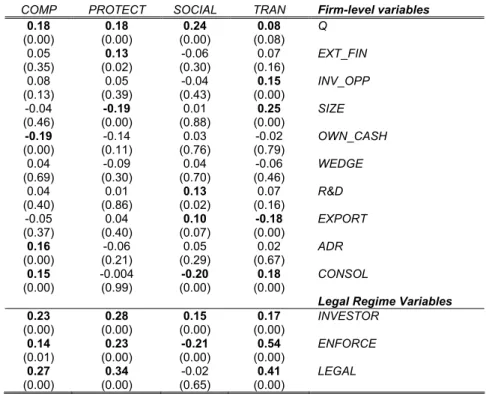
C. Correlation between Main Variables
Table VI reports correlations among main variables. Panel A shows both CLSA composite score, COMP, and investor protection, PROTECT, are positively correlated with Tobin’s Q. As expected, PROTECT is positively correlated with external financing, and firms with ADRs score significantly higher on COMP but not on PROTECT. The S&P aggregate transparency score,
TRAN, is positively correlated with Tobin’s Q, measure of investment opportunities, firm size, and consolidation dummy, and is negatively correlated with firm export intensity.27
Panel B of the same table shows correlation coefficients between legal regime variables and firm-specific variables, which suggests that firms in countries with better investor protection and law enforcement are more reliant on external financing, enjoy higher valuation, and have lower ownership concentration. Firm size, R&D expenditures, exports intensity, and consolidation dummy are also correlated with Tobin’s Q, confirming our reasons to control for these variables in regression analyses.
IV. Empirical Results
In this section we report country-random effects regression results. Estimates of [S1], the relation between CLSA or S&P scores with the three firm attributes and legal environment, are reported first, followed by the results on [S2], the relation between firm valuation and the governance or transparency scores.
A. Relation between Governance and Firm Attributes
A.1 Investment Opportunities and External Financing
Table VII reports the results of regression [S1] with INV_OPP and EXT_FIN for COMP,
PROTECT, SOCIAL, and TRAN. The results are supportive of our hypotheses. Both investment opportunities and external financing are significantly positively related to the composite index
27 Although the negative correlation between COMP and ownership concentration is surprising, it seems to be due to the low ownership concentration in strong legal regimes. There is a strong positive correlation between LEGAL and COMP.
and investor protection. The strength of legal regimes, LEGAL, is also positively related to both scores.
The interaction terms of legal regime with investment opportunities and external financing show negative coefficients, with three of four being significant. These results are consistent with the hypothesis that positive relations for investment opportunities and external financing are stronger in weaker legal environment. The results with the S&P score as the dependent variable also are largely consistent with those of the CLSA scores.
When social awareness is used as the dependent variable, however, none of the independent variables of interest are significant, except for external financing which shows an opposite sign. There is no evidence that firms are more socially responsible when they have better investment opportunities or need more external financing.
Results on ADR and consolidation dummies are also revealing. ADR listing seems to be highly related to firms’ overall governance practices, but not with investor protection. This lack of relation between ADR and investor protection is consistent with Siegel’s (2003) finding that investors of ADR listed firms do not benefit from U.S. securities regulation.28 The consolidation dummy shows a similar pattern. Its coefficient is positive and significant for the composite score, but that is driven mainly through transparency. This result confirms the notion that firms consolidating their financial statements tend to be more transparent.
The results on EXPORT and SIZE are difficult to interpret. Export intensity is significantly negatively related to COMP and TRAN. This is contrary to the notion that more export-oriented firms face greater pressure to improve their governance and disclosure practices to meet global
28 Although the results are not reported to save space, we relate the ADR dummy to the remaining five CLSA categories and find that ADR listing is significantly related to only those categories related to measures of transparency (transparency). When ADR is related to the three individual S&P categories, it is significantly related to only financial and accounting transparency (disclosure) but not to the transparency of ownership or board structures (ownership or board). These results suggest that relatively transparent firms with good accounting practices tend to list their shares in the U.S. through ADR; however, the same cannot be said for firms that practice good governance in terms of investor protection, managerial discipline, or board independence.
standards. A plausible, albeit cynical, interpretation is that firms with more export/import businesses can more easily (less costly) divert resources overseas through inflated invoices and rebates and, thus, have incentives to be more opaque in their business practices. Larger firms tend to have better overall governance and disclosure practices, but they seem to provide less investor protection.
A.2 Within-Country Variation Revisited
In Section I, we document that controlling for legal environment, within-country variation in the quality of governance is greater in weaker legal regimes. The evidence presented in the preceding section provides a better specification to estimate within-country variation, allowing for a reexamination. We use Glejser (1969) test and estimate the regression:29
CORP_GOVjc INV OPP EXT FIN LEGAL Z d u
jc cj c k k K k jc i i I j c = + ∗ + ∗ + + + + = = −
∑
∑
α β1 β2 γ1 δ 1 1 1 _ _ * , .Then we regress the absolute values of the fitted residuals
|
u
ˆ
|
of the first regression on the parameters that may explain the conditional variation in governance,| |ujc INV OPP_ EXT FIN_ LEGAL *Z , d
jc jc c k k K k jc i i I j c = + ∗ + ∗ + + + + = = −
∑
∑
α β1 β2 γ1 δ ε 1 1 1 .The Glejser test is then the t-test that the coefficient on LEGAL is zero. Panel B of Table IV reports the results. For all the three measures of corporate governance and transparency the coefficient on LEGAL is negative and significant. This reconfirms our earlier finding that firms located in weaker legal regimes show greater variation in governance and disclosure practice.30
A.3. Ownership
The regression results of [S1] with ownership concentration are reported in Table VIII. The regressions contain the OWNERSHIP2 term to account for possible non-linearity between
29 Adams, Almeida, and Ferreira (2002) use this test to investigate firm variability in output as a function of CEO power in the U.S.
30 We also conduct the Goldfeld-Quandt (1965) test of the null hypothesis that the variance of the residuals of the above regression for the weak and strong legal regime sub-samples are equal. The results are consistent with those of the Glejser test.