discussion
papers
FS IV 02 – 33
Market Power in Outputs and Inputs: An
Empirical Application to Banking
Robert M. Adams *
Lars-Hendrik Röller **
Robin C. Sickles ***
*
Board of Governors Federal Reserve System
** WZB - Wissenschaftszentrum Berlin
*** Rice University
December 2002
ISSN Nr. 0722 - 6748
Forschungsschwerpunkt
Markt und politische Ökonomie
Zitierweise/Citation:
Robert M. Adams, Lars-Hendrik Röller, and Robin C. Sickles, Market Power in Outputs and Inputs: An
Empirical Application to Banking,Discussion PaperFS IV 02-33, Wissenschaftszentrum Berlin, 2002.
Wissenschaftszentrum Berlin für Sozialforschung gGmbH,
Reichpietschufer 50, 10785 Berlin, Germany, Tel. (030) 2 54 91 – 0 Internet: www.wz-berlin.de
ABSTRACT
Market Power in Outputs and Inputs: An Empirical Application to Banking
by Robert M. Adams
*, Lars-Hendrik Röller, and Robin C. Sickles
This paper provides evidence on the empirical separability of input and output market
imperfections. We specify a model of banking competition and simultaneously estimate
bank conduct in output (loan) and input (deposit) markets. Our results suggest that firms
display some degree of noncompetitive behavior in both the loan and the deposit
markets. Moreover, we find that the input side and the output side are empirically
separable, that is the measurement of market power on one side of the market is not
affected by assuming that the other side of the market is perfectly competitive. Our
results suggest that empirical studies of market power that concentrate on either the
input side or the output side, are not subject to significant misspecification error.
Keywords: Measuring Market Power, Banking JEL Classification: G2, L1, C3
* The views expressed are those of the authors and do not necessarily reflect the position of the Federal Reserve System, the Board of Governors, or its staff. We wish to thank Charles Taragin for his excellent research assistance and Alex Raskovich, Beth Kiser, Robin Prager, Ken Brevoort, Ron Borzekowski, and Dean Amel for their comments. We are grateful to the German Science Foundation (DFG) for financial support.
ZUSAMMENFASSUNG
Marktmacht auf Input- und Outputmärkten: Eine Empirische Anwendung auf
den Bankensektor
Der Aufsatz untersucht den Zusammenhang von Unvollkommenheiten auf Input- und
auf Outputmärkten. Im Rahmen eines Wettbewerbsmodells für den Bankensektor wird
die Wechselwirkung zwischen Outputmarkt, d.h. bei der Kreditvergabe, und Inputmarkt
(Geldanlage) empirisch untersucht.
Die Ergebnisse zeigen, dass Banken auf beiden Seiten des Marktes eine gewisse
Marktmacht ausüben können. Allerdings ist die Wechselwirkung begrenzt, sodass eine
separate Betrachtungsweise von Input- und Outputmärkten möglich ist. Dies bedeutet
wiederum, dass empirische Untersuchungen, die jeweils nur eine Seite des Marktes
analysieren, keinen signifikanten Verzerrungen unterliegen.
1
Introduction
Most empirical studies on the measurement of market power in output mar-kets assume that input marmar-kets are perfectly competitive. However, there are many industries where this assumption may not be valid. In fact, it has been argued thatfirms with market power are able to extract considerable rents from both input and output markets. In this context, it is important to understand to what extent the measurement of market power in output markets is affected by the assumption of perfectly competitive input mar-kets. This paper provides evidence on the empirical separability of input and output markets.
In order to investigate the relationship between input and output market imperfections, one needs a model and an industry where input and output markets are prominent. The industry that we investigate in this paper is banking. Banking competition has been a topic of considerable interest, especially since the early 1980s, when deposit rates were deregulated and banks were permitted to pay interest on demand deposits. The banking industry clearly is going through substantial changes in structure and com-petition. Mergers, failures and entry have resulted in a net decline in the number of banks from some 14,500 in 1980 to around 8,200 in 2000. These changes in the banking industry’s structure and competitive environment have fueled a large literature on banking competition.
We specify a model of banking competition, where banks have market power in loan markets (the output market), as well as in deposit markets (i.e. the input market). More specifically, we differentiate between three different loan categories: commercial and industrial loans, installment loans, and real estate loans. Given that consumers are typically not able to substitute one loan type for another it is likely that each of these loan types constitutes a separate output market.1
We implement our model with quarterly state level data from the U.S. commercial banking industry from 1987 through 1996. Wefind that firms display some degree of non-competitive behavior in both the loan and deposit markets. In particular, there is evidence that, in both markets, prices are higher than a non-cooperative Nash outcome would predict.
Given that our empirical model accounts for market imperfections on both the input side (deposit) as well as the output side (loan) we then compare our results to a situation where either the input or the output side
1
Of course, common cost elements exist between the markets such as the costs of federal funds and discount funds, but it is the demand side and risk that differ dramatically in these markets.
is assumed to be perfectly competitive. In other words, we provide some evidence on whether it matters for the measurement of product market imperfections that the input market is assumed to be perfectly competitive. Our main result is as follows. Wefind that the input side and the output side areempirically separable; that is, the measurement of market power on one side of the market is not affected by the assuming that the other side of the market is perfectly competitive. This is true independent of whether the output market is aggregated or not. Our results suggest that empirical studies of market power that concentrate on either the input side or the output side are not subject to a significant misspecification error.
The remainder of the paper is structured in the following manner. Sec-tion 2 provides background informaSec-tion. In secSec-tion 3, we introduce our model of banking competition and discuss the empirical implementation in section 4. The data are described in section 5 and the results in section 6. We conclude in section 7.
2
Background
Quantifying market behavior and productivity in the banking industry is still an elusive topic primarily because the appropriate data are not avail-able. In addition, difficulties exist in defining inputs and outputs and in measuring prices. Because of these difficulties, a substantial part of bank competition research has centered on the structure-conduct-performance (SCP) relationship and, until recently, the efficient-structure (ES) hypoth-esis.2 The structure-conduct-performance hypothesis posits higher profits in more concentrated markets from the exercise of market power. Con-versely, the efficient-structure hypothesis3 gives a different explanation by attributing higher profits and market concentration to greaterfirm efficiency. Authors typically consider the effect of market concentration on prices or profitability. Market concentration in banking is typically measured in terms of total deposits.4 Most studies use a measure of price such as deposit in-terest rates or a measure of profitability such as return on assets or return on equity in their analysis.
Numerous studies of banking competition use the market concentration methodology. Gilbert (1984) surveys the previous literature on banking
2
See Berger and Hannan (1989) for SCP and Berger and Hannan (1995, 1998) for ES.
3See Demsetz (1973). 4
The Federal Reserve and Department of Justice Antitrust Division use market con-centration measured by deposits using FDIC data.
competition spanning two decades andfinds a positive relationship between market share and performance.5 Berger and Hannan (1989) examine the relationship between concentration and deposit interest rates after deregu-lation in the 1980s. They find lower deposit rates in higher concentrated markets. In a subsequent study, Hannan and Berger (1991)find asymmetric adjustment of deposit rates to Treasury Bill rates in concentrated markets, where banks in more concentrated markets decrease deposit rates in peri-ods of declining overall rates more quickly than they increase them during periods of increasing interest rates. Hannan (1991, 1997) links local market concentration to higher rates on different classes of small commercial loans. Furthermore, other studies support the hypothesis that concentration leads to less efficient firms, which implies that firms with market power are not profit maximizing. Berger and Hannan (1997, 1998) test both the market power and efficiency hypotheses in U.S. banking. These studiesfind support for the hypothesis that market concentration is associated with lower bank efficiency, a contradiction of the efficient-structure hypothesis.
Banking market concentration studies lend themselves to competition analysis for several reasons. First, deposit data (by branch on a yearly ba-sis) are readily available and can be used easily to determine market share for a relatively small geographic market. Second, Federal Reserve (Fed) and Department of Justice (DOJ) antitrust merger analysis uses Herfindahl— Hirschman Index (HHI) market concentration measures6 derived from de-posit shares as an initial screen to determine the possible effects of a bank merger.7 Threshold values of the HHI that warrant competitive concern include a HHI level of 1800 and a change in HHI of 200. Once both of these bounds are exceeded, the Fed and DOJ consider other factors such as po-tential entry and market growth to determine if action is necessary. Because merger analysis relies on HHI measures of concentration, it is important to understand the relationship between prices and concentration in order to draw inferences about competition. Hence, studies that examine this
rela-5
Not all studies listed in this survey reach this conclusion.
6The HHI is defined as the sum of squared market shares. Market shares are typically
derived from deposits, because it is assumed that the level of a bank’s deposits in a market is an indication of the level of its other banking services in that same market.
7There are some differences between the Federal Reserve and DOJ methods. First,
DOJ only includes thrifts in its market share calculations under certain conditions, while the Fed typically includes them at 50%.Second, geographic market definitions differ. The Federal Reserve tends to use economically integrated areas such as MSAs or RMAs to determine geographic markets, while the DOJ defines markets on other criteria such as small business service areas. Third, the Fed considers the product market to be a bundle of banking services, while the DOJ analyzes individual products.
tionship are directly relevant to competition policy. Furthermore, deposit shares are essentially used as a proxy for other types of banking services such as loans, cash management, underwriting, etc. Since loan data are not readily available at a branch level, both agencies rely on deposit data for their competitive analysis.8
Past studies9 on market structure in the banking industry attempted to determine the relationship between market concentration and prices. How-ever, this methodology is unable to estimate the degree of competition in the industry. Other authors have introduced structural models of banking competition using the methods outlined in Bresnahan (1989) that can de-termine the degree of competition in an industry. These methods have been applied to the banking industry by Shaffer (1989, 1993), Shaffer and DiSalvo (1994), Suominen (1994), and Neven and Röller (1999). Most studies, par-ticularly those using U.S. data, have found little evidence of market power. Suominen (1994) estimates the competitive behavior for two separate mar-kets, aggregated loan and deposit markets. His studyfinds mixed results on the market behavior of Finnish banks, where banks behave competitively before regulation in 1984 and less after deregulation. Shaffer (1993) consid-ers competition in the Canadian banking industry using total assets as an output index andfinds an equilibrium consistent with perfect competition. Neven and Röller (1999)find significant monopoly collusive behavior in Eu-ropean banking markets, where they consider corporate and household loan markets. Finally, Shaffer (1989) estimates a model with aggregated loans andfindsfirm behavior in the U.S. banking industry is more consistent with a competitive equilibrium than non-cooperative Nash behavior. Shaffer and DiSalvo (1994) find imperfectly competitive behavior in a highly concen-trated duopoly banking market.10 Almost all of these studies aggregate loan outputs into a single index. Since loan markets are very heterogeneous in nature, this aggregation could complicate any inference on competition in the banking industry.
Aggregation is also important because of its implications for merger pol-icy. Two distinct methods of analysis in banking markets are applied by the Fed and the DOJ. On the one hand, the Fed uses a cluster market approach,
8The Community Reinvestment Act (CRA) data contain detailed loan information.
One significant shortcoming of these data is their complete lack of price information. Also, they do not cover all banks - only large or metropolitan banks are included.
9
See Gilbert (1984), Berger and Hannan (1989), Hannan (1991, 1997).
1 0Their measure of market behavior lies between perfect competition and
where banking services are considered jointly as a cluster of products.11 Un-der this methodology, all retail banking products are bundled together, since consumers are alleged to purchase several services, such as loans, deposits, and other retail services, from a single bank. Furthermore, banking markets are defined to be geographically large, and often include otherfinancial insti-tutions such as thrifts because of their provision of many bank services. On the other hand, the DOJ applies the smallest-market principle detailed in the Merger Guidelines promulgated by the DOJ and Federal Trade Commission (FTC). In the smallest-market principle, a product market is defined as the set of products for which a hypothetical monopolist (i.e. all thefirms which produce a specific product in a specific area would hypothetically act as a single monopolist) could impose a “small but significant and non-transitory” price increase.12 The resulting analysis centers on separate loan and deposit markets. Small business and middle market lending are typically individual markets of concern in DOJ analyses. Other financial institutions are in-cluded in the analysis only if they represent a significant competitor in the individual markets. Our model allows us to consider competition in separate markets following the single market principle of the DOJ.
3
Model
We use a static Cournot game to develop a structural model of oligopoly behavior.13 We assume profit maximization, where banks sell loans to con-sumers and borrow loanable funds from depositors. It is well known that deposits could also represent other banking retail services (an output) to customers. However, our aim is to determine whether banks are paying competitive rates for deposits. In order to measure monopsony power, we model savings deposits as inputs.
1 1
The Federal Reserve often cites a 1963 Supreme Court decision, which defines the clus-ter of banking services as the product market in banking. SeeUnited States v. Philadelphia National Bank, 374 U.S. 321, 357 (1963).
1 2See Merger Guidelines (1997) pg. 4.
1 3A Bertrand equilibrium may be a more appropriate model in the banking industry.
However, the theoretical value of the market parameter in a non-cooperative Nash outcome tends to be lower in a Bertrand equilibrium than in a Cournot equilibrium. This means that Bertrand competitors act as though there were fewerfirms in the market than Cournot competitors. Hence, estimates using Cournot equilibrium are still indicative of overall market behavior and tend to understate the level of collusion in a market. Also, the reader should note that this study does not consider any dynamics in competition, but only considers averagefirm behavior over the entire sample.
We start our formulation of the model by specifying the aggregate de-mand equation for loan type j:
rjl = Pjl(Lj, Zl) (1)
whererl
j is the interest rate charged on loan j,Lj is the market level quantity of loan j, andZlrepresents exogenous demand determinants. Customers also supply loanable funds to banks:
rdi = Pid(Di, Zd) (2)
whererdi is the price of deposit i,Di is the market level quantity of deposits, andZdrepresents exogenous demand determinants. Given loan demand and deposit supply, we consider a representative banknthat produces loan types
j = 1,2,3 and demands depositsi = 1,2 to maximize profits, where loan types are real estate loans, commercial and industrial loans, and installment loans and deposit types are savings deposits and purchased funds:14
max di,lj Π = 3 X j=1 rljlj − 2 X j=1 riddi−C ³ {lj}3j=1,{di}2i=1 ´ , s.t. rlj = Pjl(Lj, Zl), rd = Pid(Di, Zd) and 3 X j=1 lj ≤ 2 X i=1 di
where rlj is the price for loan type j, lj is the dollar value of loans for loan type j for bank n, di is the dollar value of deposits for deposit type i for bank b, rd
i is the price of deposit type i, and C(.) is the management cost function, where costs are a function of the loan and deposit quantities. Given loan demand, deposit supply, and cost specifications, we can write thefirst order conditions for the Cournot solution, where banks are offering loans on the one hand and demanding deposits on the other and banks have possible market power in deposit market i, assuming competitive market behavior in other deposit markets. We use purchased funds (d1) as the
1 4
Purchased funds represent an aggregation of other forms of non-core deposits. We do not include any equity requirements, because they would have no effect on thefirst order conditions of the model.
competitive deposit market.15 Purchased funds are described in the data section. Substituting ind1 = P3j=1lj − d2, we get the followingfirst order
conditions: rjl − rd1 + ∂r l j ∂Lj ljθj − M Clj = 0 forj = 1,2,3 (3) −rd2 + rd1 − ∂r d 2 ∂D2 d2λ2 − M Cd2 = 0 (4)
whereM Clj andM Cdi are marginal management costs with respect to loan j and deposit i, and θj and λi measure the degree of competition. These parameters measure the degree to which market interest rates are set above marginal costs or above (below) perfectly competitive levels. In output mar-kets at thefirm level, ifθj = 0, price equals marginal cost and the industry is perfectly competitive, while θj = 1 is consistent with Cournot Nash be-havior. Collusive (or monopoly) behavior occurs when θj = N. In factor markets, when λi = 0, factor price equals marginal revenue product (less marginal costs) and the factor market is perfectly competitive. Whenλi = 1, we observe Cournot Nash behavior. Collusive (or monopsony) behavior is observed whenλi =N, indicating that factor prices are less than marginal revenue product.
In a perfectly competitive equilibrium, banks set the intermediation mar-gin (i.e.,rjl−rd1) equal to their marginal managerial costs. Since both rates are pegged to the perfectly competitive market and costs are separable, this implies that rates in loan markets are independent from rates in deposit mar-kets (Freixas and Rochet, 1997).16 It is important to note, however, that even though loan demands are not interrelated, where changes in quantity of one loan type do not affect prices in other loan types, we still consider a multimarket model since markets are connected through the management cost function.
1 5In the estimation of the market behavior parameters, we account for interest rate risk
by using term equivalent interest rates. For real estate loans, 10 year bond rates are used, and, for commercial and industrial loans and installment loans, we use 5 year bond yields.
1 6
There has been some discussion in the literature about which market should repre-sent the perfectly competitive market. We do not address that issue in this paper. See Santomero (1984) for a more detail discussion.
4
Empirical Implementation
In order to simplify estimation, we consider an average bank within a state by aggregating the data to the state level17 (i.e. by summing the first order conditions (equations 3 and 4) overfirms) and dividing by N (the number of banks in a state in a given quarter). While this aggregation detracts from any analysis of firm specific behavior, it lends itself to an analysis of over-all industry behavior. Ostensibly, we are estimating average firm behavior across the U.S. Aggregation leads to the followingfirst order conditions:
rlj − r1d + ∂r l j ∂Lj Ljθj − M C(Lj/N) = 0 for j = 1,2,3 (5) −r2d + r1d − ∂r d 2 ∂D2 D2λ − M C(D2/N) = 0 (6)
In this case, the behavioral parametersθj andλ have been redefined as a result of the aggregation, whereθj = δNj and λ = Nδ, where δj and δ are the aggregate estimated parameters. A value of 0 is still consistent with perfect competition, but Cournot behavior is observed whenθj andλ = N1, and perfect collusion is observed whenθj and λ = 1.
In order to estimate this system of equations, we make functional form assumptions for marginal management costs and the demand and supply functions. We base our marginal cost functional form on a translog cost function and calculate marginal costs at the state mean.18 We get the fol-lowing marginal costs for loans and deposits:
M C(Lj N) = C Ls ( ¯αj+α1jN BR+α2jlnW age+α3jlnW cap + 3 X s=1 γsln(Ls N )) forj, s = 1,2,3 (7) M C(D2 N ) = C D2 ( ¯ρ0+ρ1N BR+ρ2lnW age+ρ3lnW cap + ρ4ln(D2 N )) (8)
where C is total costs, NBR represents the number of branches, Wcap is the average price of capital and WAGE is the average wages rate within
1 7We cannot aggregate to the individual market level, because we are unable to infer
any price information for individual markets within a state.
each state. The variables, number of branches, price of capital, and wages, are included in marginal cost equations to account for the costs of branch networks to the different loan types and deposits and for the labor costs in each market. We also assume log-log functional forms for loan demand and deposit supply: lnrlj = dj0+djt+dj1lnLj+dj2lnP op+dj4lnIncome+dj5lnEmployment + 4 X 2 dj6tqt+dj6lnT A+dj7T L+dj8N BR/N + 50 X s=1 stjs+ 9 X y=1 yrjy+²1j forj = 1,2,3 (9) lnr2d = s0+s1lnD2+s2lnP op+s3lnIncome+s4lnT A+s5lnT L + s6N BR/N+ 4 X 2 s4tqt+ 50 X s=1 sts+ 9 X y=1 yry+²2 (10)
where Pop is the state population, employment is the number employed in each specific state, income is state level income,qtis a quarterly dummy vari-able, TA is total assets, TL is total loans, andstjs and yrjy are state and year dummy variables respectively. We include state population, income, employment, total assets, and total loans to account for shifts in loan de-mand or deposit supply. The quarterly dummies are included to account for seasonal variation and the year dummies are included to account for demand shifts over time. The results section discusses the necessity of including the state dummy variables in the demand equations.
The behavioral questions that follow from the functional form assump-tions are:19 rjl − rd1+rjlδj/N − C Lj ( ¯αji+α1jN BR+α2jlnW age + α3jlnW acp+ 3 X s=1 γsjln(Ls/N)) +²3j = 0 for j = 1,2,3(11) −r2d + rd1−s2rd2δ/N − C D2 ( ¯ρ0+ρ1N BR+ρ2lnW age
1 9While our model does not directly account for risk, the large differences in our marginal
cost estimates across loan types are an indication that our marginal costs reflect some of the risk within each loan type.
+ ρ3lnW cap+ρ4ln(D2/N)) +²4 = 0 (12)
where γj, γsj, ρi, and ρsi are parameters from a translog cost function specification and where ²3j and ²4 are additive errors. The parameters in
the four behavioral equations are estimated jointly with the loan demand equations and the deposit supply equations.
5
Data
We construct a panel data set of U.S. commercial banks taken from the Report of Condition and Income (Call Report) and the FDIC Summary of Deposits. All values are aggregated to the state level and the data are quarterly for the 10—year period from 1987 through 1996.
Prices are imputed from loan and deposit revenues, where interest and fee income from loans in each category is divided by total loans20 in each loan type. These imputed prices represent the average revenue of each dollar loaned for each bank. Deposit loan prices represent the average amount paid per dollar of deposit received.21 All dollarfigures are in thousands of 1982-84 dollars. The resulting data set contains 2017 observations.
The variables in our data include: PRE Price of Real Estate Loans,PCI Price of Commercial and Industrial Loans,PIN Price of Installment Loans,
PCD Price of Savings Deposits,PP F Price of Purchased Funds, RELN (real estate loans), CILN (commercial and industrial loans), INLN (installment loans), L (labor), C (capital), Purf (purchased funds),22 CD (retail time and savings deposits)rjl = Pci, Pre, Pin;rdi =Pcd.
6
Results
We jointly estimate eight equations (see equations 9 — 12) using generalized method of moments.23 Tables (2) and (3) show the results for the demand and supply equations and thefirst order equations (see demand equations 9 and 10 and behavioral equations 11 and 12).
2 0
Net of allowance and reserves.
2 1Gilbert (1984) discusses some of the shortcomings of using this measure of price. 2 2
Purchased funds include federal funds purchased and securities sold under agreements to repurchase and demand notes issued to the U.S. Treasury and other borrowed money, as well as other borrowed money and deposits which are not demand deposits and retail time and savings deposits.
2 3Note that loan demand and supply equations represent 3 equations (one for each loan
Estimation proceeds by setting orthogonality conditions. Let e be the matrix of additive error terms for the equations, where these error terms are a function of the parameter vector and exogenous variables. Let Z be the matrix of exogenous variables and instruments.24 The orthogonality conditions are written as:
g = 1
N∗TZ
0e (13)
Parameter estimates are obtained by minimizing:
q = g0W−1g (14)
where W is the covariance matrix of the orthogonality restrictions.25. We control for state specific heterogeneity in the loan demand and deposit sup-ply equations by including state dummy variables. Using a Newey and West (1987) test we reject no state specific intercepts at the 1% level26.
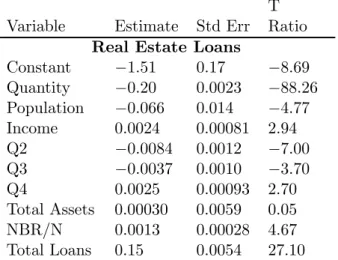
Wefirst turn to the inverse demand estimation results given in Table 2. The own quantity coefficients for all loan types are negative as expected and estimated elasticities, which are derived from these coefficients, are −4.95,
−4.58, and−7.62for real estate, commercial and industrial, and installment loans respectively. Even though these values are relatively large, they are smaller than what others have found (see Neven and Röller (1999)). The reason for this is the way market heterogeneity is treated (i.e. state specific dummy variables). More specifically, we find that the estimated elastici-ties are much larger when geographic market heterogeneity is not controlled for. To see this, consider parallel inverse demand curves from different geo-graphic markets, where only the intercept varies. If we do not account for the varying intercept, the inverse demand curve would be estimated to be rather flat, which results in large elasticity estimates. Larger elasticity es-timates, in turn, raises the estimate of the conduct parameters, since there
2 4
The modeled exogenous variables are population, income, employment, quarterly dummies, wages, number of banks, and number of branches, and the additional instru-ments include capital, the price of capital, the logarithm of the price of capital, labor, the logarithm of wages, federal funds rate, treasury bill rates, and the price of money market demand accounts.
2 5The model results in aχ2 statistic of 0.31, which does not reject the null hypothesis that the over-identifying restrictions are valid at any reasonable significance level.
2 6
The D-statistic suggested by Newey and West (1987) is a χ2s given by D =
T(q1 − q0), where where s is the number of restrictions, q1 is the value of the GMM objective function under the restricted model andq0 is the value under the unrestricted model. Note that the estimated covariance matrix from the unrestricted model is used to estimate the restricted model.
is a one to one relationship between the estimated demand elasticity and the estimated behavioral parameter. In sum, it appears that controlling for market heterogeneity is important to obtain more reasonable demand elasticity estimates.
Elasticities of supply for savings deposits are derived from the quantity coefficient in Table 3. The supply elasticity has the expected sign with a value of 4.99. Amel and Hannan (1999) elasticity of supply estimate for savings deposits is 0.093, where they estimate supply elasticities for local banking markets.27 Amel and Hannan’s low elasticity estimate could be attributed to their analysis at the local banking market level. However, Dick (2001), who also estimates demand at the local level, uses a multinomial logit specification and measures the elasticity of supply of 5.95.
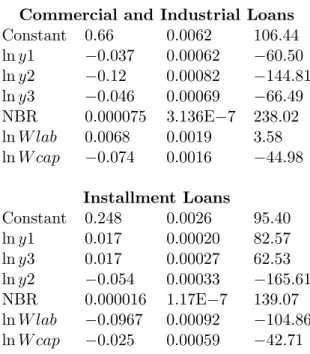
The marginal cost parameter estimates are shown in Tables (4) and (5). We estimate average loan marginal costs and find all are positive. Loan marginal costs are 0.0075, 0.036, and 0.021 for real estate loans, commer-cial and industrial loans, and installment loans at the mean, respectively. Average marginal costs for savings deposits are estimated at 0.012.
We now turn to the behavioral parameters for the loans (θ0s) and de-posit markets (λ) (see Table (6)). Our estimates of theθ0jsare 0.059 for real estate loans, 0.11 for commercial and industrial loans, and 0.14 for install-ment loans. These parameters are all significantly different from 0 at the 1% level, rejecting the hypothesis of perfect competition. We also test for collusive behavior (θ = 1) andfind that behavioral parameters in all mar-kets are significantly different from 1 at the 1% level. Finally, we test for Nash behavior which is whenθj = 1/N. Using the average number of banks in our sample N = 176, we test whether θ = 0.0057.28 We find that the conduct parameters for all loans are significantly greater than Nash conduct between 176 banks would predict. Putting it differently, our estimated con-duct parameter implies Nash behavior amongst 11 banks in the real estate market, 9 banks in the commercial and industrial loan and 7 in installment markets. Given that the average number of competitors in Federal Reserve defined geographic markets is much lower than 176 (in urban markets the average number of competitors (including thrifts) is 26 and in rural mar-kets the average number is 5) our estimated behavioral parameters are more closely in line with Nash conduct.
The larger coefficient estimate of θ for commercial and industrial loans
2 7
They also estimate supply elasticities for MMDA and NOW accounts with results of 0.194 and 0.042 respectively.
2 8It is important to note that N=176 is the mean number offirms, not the actual number
might warrant a closer analysis. Commercial and industrial loans, especially small business (loans up to$1,000,000) and middle market loans (loans up to$10,000,000), are of considerable interest in the antitrust analysis of DOJ (and to some extent the Federal Reserve). This is because small businesses typically do not travel very far to obtain credit.29 They rely on the banks with branches close to them, because of their convenience and also because these banks are able to obtain more information about the small business.30 It is hypothesized that this additional information allows the banks to better judge the risk of the local small business. Hence, the propensity for market power is larger, because competition in small business markets is more lo-calized.31 Our results indicate that these antitrust concerns are warranted, since the parameter estimates point to a non-competitive equilibrium.
The savings deposits conduct parameter(λ)is estimated at 0.032, which is significantly different from perfect competition (λ = 0) and is also sig-nificantly larger than non-cooperative Nash behavior (λ = 1/N). In other words, banks compete less than non-cooperative Nash behavior would sug-gest. This is surprising since a number offinancial institutions offer a variety of similar products with varying levels of return and liquidity that compete directly with savings deposits. More importantly, many types of financial institutions such as savings and loan associations and credit unions exist that offer the same product as commercial banks. While these financial institutions are not included in our data, they do not seem to exert com-petitive restraints on banks to raise deposit rates to comcom-petitive levels.32 This could be an indication that banks are providing other (unmeasured) services to retail banking consumers, who end up “paying” for these services with reduced savings deposit rates. Another possible explanation is the ex-istence of switching costs. Switching costs lower the amount of consumer mobility that would occur for a given price change. Sharpe (1997)finds that greater population migration into a market positively affects deposit rates. He attributes this result to the existence of switching costs, since migrating customers have no existing deposit relationship in the market.
The estimated markups and markdowns can be calculated from equa-tions (3) and (4) asrlj−r1d− M C(Lj/N) =θj/ µ∂rl j ∂Lj Lj rl j ¶ and −rd2+r1d− 2 9
Kwast, Starr-McCluer, and Wolken (1997)find that importantfinancial services con-sumed by small businesses are primarily provided by local institutions.
3 0The importance of lending relationships between banks andfirms has been investigated
in several studies. See Petersen and Rajan (1994) and Berger and Udell (1995)
3 1See Rhoades (1996) for a discussion of small business loans in antitrust analysis. 3 2
M C(D2/N) = λ/ µ ∂rd 2 ∂D2 D2 rd 2 
, respectively. As can be seen, the markups (markdown) are a function of the elasticities and the conduct parameter. We find markups of some 10, 29, and 18 basis points for real estate loans, com-mercial and industrial loans, and installment loans, respectively (or 1.1%, 2.4%, and 1.8%,respectively). Estimated markdown in retail time and sav-ings markets is 4 basis points (or 0.7%). It is important to emphasize that these margins are kept low by the relatively large demand elasticities in each of the markets.
Overall, we therefore find that both the deposit and the loan market display some degree of non-competitive behavior. In particular, there is evidence that in both markets prices are higher than a non-cooperative Nash outcome would predict.
Given that our empirical model accounts for market imperfections on both the input side (deposit) as well as the output side (loan) it is interesting to compare our results to a situation where either the input or the output side is assumed to be perfectly competitive. In other words, we like to provide some evidence on whether it matters for the measurement of product market imperfections that the input market is assumed to be perfect.
To do this we re-estimate our model setting λ = 0, i.e. we assume that the input market is perfectly competitive. The results for the conduct parameters are in Table (6). As can be seen, the estimatedθ0sare virtually unchanged, yielding 0.059, 0.11, and 0.14 for real estate loans, commercial and industrial loans, and installment loans, respectively. Moreover, the estimated markups are 1.4%, 2.7% and 2.1%, respectively, which is very close to the markups implied by the results in table 6. We thereforefind no evidence that ignoring the input side matters in terms of estimating market power in the output market. In this sense to two sides of the market are separable.
In addition, we have re-estimated our model settingθi = 0 for all i, i.e. we assume that the output market is perfectly competitive. The resulting estimate of λ is 0.032 which is virtually unchanged from the estimate re-ported for the full model in Table 6. Moreover, the implied markdown is 0.7% which is also unchanged. Consequently, we find no evidence that as-suming that the output market is perfectly competitive has any effect on the measurement of monopsony power. In this sense to two sides of the market are separable.
Finally, we test whether aggregation potentially affects these findings. We re-estimate our model aggregating into single loan and deposit variables. The estimated behavioral parameters are reported in Table 6. As can be
seen, the estimate of θ increases to 0.22 which is significantly larger than under the disaggregate model. In other words, aggregation matters for the estimated conduct. On the other hand, the estimate for λ is unchanged and the markdown is 0.66%. Moreover, setting either θ = 0 or λ= 0 and re-estimating does not affect the conduct parameter estimates either. This implies that the separability of the input and output markets holds even under aggregation.
Overall, wefind that the input side and the output side are empirically separable, that is the measurement of market power on one side of the market is not affected by the assuming that the other side of the market is perfectly competitive. This is true independent of whether the output market is aggregated or not. Our results suggest that empirical studies of market power that concentrate on either the input side or the output side, may not be subject to a significant misspecification error.
7
Conclusion
This paper provides evidence on the empirical separability of input and output market imperfections. We specify model of banking competition and simultaneously estimate banks conduct in output (loan) and input (deposit) markets. Wefind thatfirms display some degree of non-competitive behavior in both the loan and the deposit markets. In particular, there is evidence that in both markets prices are higher than a non-cooperative Nash would predict.
Given that our empirical model accounts for market imperfections on both the input side (deposit) as well as the output side (loan) we then compare our results to a situation where either the input or the output side is assumed to be perfectly competitive. Our main result is as that the input side and the output side areempirically separable, that is the measurement of market power on one side of the market is not affected by the assuming that the other side of the market is perfectly competitive. This is true independent of whether the output market is aggregated or not. Our results suggest that empirical studies of market power that concentrate on either the input side or the output side, are not subject to a significant misspecification error.
References
1. Akhavein, Jalal D., Berger, Allen N. and Humphrey, David B. (1997) “ The Effects of Megamergers on Efficiency and Prices: Evidence from a Bank Profit Function,” Review of Industrial Organization 12, 95—139. 2. Altunbas, Yener and Molyneux, Philip (1996) “Cost Economies in EU Banking Systems”Journal of Economics and Business 48, 217—230. 3. Amel, Dean F. and Hannan, Timothy H. (1999) “Establishing Banking
Market Definitions Through Estimation of Residual Deposit Supply Equations,”Journal of Banking and Finance 23, 1667—1690.
4. Berger, Allen N. (1995) “The Profit—Structure Relationship in Banking– Tests of Market—Power and Efficient—Structure Hypotheses,”Journal of Money, Credit, and Banking 27, 404—431.
5. Berger, Allen N. and Hannan, Timothy H. (1989) “The Price—Concen-tration Relationship in Banking,”The Review of Economics and Statis-tics 71, 291—99.
6. Berger, Allen N. and Hannan, Timothy H. (1997) “Using Efficiency Measures to Distinguish Among Alternative Explanations of the Struc-ture—Performance Relationship in Banking,”Managerial Finance 23, 6—31.
7. Berger, Allen N. and Hannan, Timothy H. (1998) “The Efficiency Cost of Market Power in the Banking Industry: A Test of the ’Quiet Life’ and Related Hypotheses,” Review of Economics and Statistics, 80, 454—65;
8. Berger, Allen N., Saunders, Anthony, Scalise, Joseph, and Udell, Gre-gory F. (1998) “The Effects of Bank Mergers and Acquisitions on Small Business Lending,” Board of Governors of the Federal Reserve Work-ing Paper 1998—15.
9. Berger, Allen N. and Udell, Gregory F. (1995) “Relationship Lending and Lines of Credit in Small Firm Finance,”Journal of Business 68, 351—81.
10. Bresnahan, T.F. (1989) “Empirical Studies in Industries with Market Power,” Handbook of Industrial Organization, Vol. II, (edited by R. Schmalensee and R. Willig), 1011—1058.
11. Captain, Purvez F. and Sickles, Robin C. (1997) “Competition and Market Power in the European Airline industry: 1976—1990,” Man-agerial and Decision Economics 18, 209—225.
12. Cowling, Keith and Waterson, Michael (1976) “Price Cost Margins and Market Structure,”Econometrica 43, 267—74.
13. Dansby, Robert E. and Willig, Robert D. (1979) “Industry Perfor-mance Gradient Indexes,”American Economic Review 69, 249—60. 14. Delta, Marie—Odile Yanelle (1997) “Banking Competition and Market
Efficiency,” Review of Economic Studies 64, 215—239.
15. Demsetz, H. (1973) “Industry Structure, Market Rivalry, and Public Policy,”Journal of Law and Economics 16,1-9.
16. Dick, Astrid A. (2001) “Demand Estimation and Market Power in the Banking Industry” MIT mimeo.
17. Farrell, Joseph and Shapiro, Carl (1990) “Horizontal Mergers: An Equilibrium Analysis,”American Economic Review 80, 107—126. 18. Frame, W. Scott and Kamerschen, David R. (1997) “The Profit—
Structure Relationship in Legally Protected Banking markets using Efficiency Measures,”Review of Industrial Organization 12, 9—22. 19. Freixas, Xavier and Rochet, Jean-Charles (1997) Microeconomics of
Banking, The MIT Press, Cambridge, Mass.
20. Gilbert, Alton (1984) “Studies of Bank Market Structure and Com-petition: A Review and Evaluation,” Journal of Money, Credit, and Banking 16, 617—644.
21. Hannan, Timothy H. (1991) “Bank Commercial Loan Markets and the Role of Market Structure: Evidence from Surveys of Commercial Lending,”Journal of Banking and Finance 15, 133—149.
22. Hannan, Timothy H. (1997) “Market Share Inequality, the Number of Competitors, and the HHI: An Examination of Bank Pricing,”Review of Industrial Organization 12, 23—35.
23. Hannan, Timothy H. and Berger, Allen N.(1991) “The Rigidity of Prices: Evidence from the Banking Industry,” American Economic Review 81, 938—945.
24. Hannan, Timothy H. and Prager, Robin A. (1996) “Do Substantial Horizontal Mergers Generate Significant Price Effects? Evidence from the Banking Industry,” Board of Governors of the Federal Reserve Working Paper.
25. Jackson, William E. III (1997) “Market Structure and the Speed of Price Adjustments: Evidence of Non—Monotonicity,”Review of Indus-trial Organization 12, 37—57.
26. Kwast, Myron L., Starr—McCluer, Martha, Wolken, John D. (1997) “Market Definition and the Analysis of Antitrust in Banking,” The Antitrust Bulletin winter, 973—995.
27. Molyneux, Philip, Thornton, John, and D. Michael Lloyd—Williams (1996) “Competition and Market Contestability in Japanese Commer-cial Banking,”Journal of Economics and Business 48, 33—45.
28. Neven, Damien J. and Lars-Hendrik Röller (1999) “An Aggregate Structural Model of Competition in the European Banking Industry,”
International Journal of Industrial Organization, Vol 17, No. 7. 29. Newey, W. K. and West, K. (1987) “Hypothesis Testing with
Effi-cient Method of Moments Testing,” International Economic Review, 28:777—787.
30. Panzar, J. and Rosse, J. (1987) “Testing for ’Monopoly’ Equilibrium,”
Journal of Industrial Economics 35, 443-456.
31. Parker, Philip M. and Lars—Hendrik Röller (1997) “Collusive Conduct in Duopolies: Multimarket Contact and Cross— Ownership in the Mo-bile Telephone Industry,”RAND Journal of Economics 28, 304—22. 32. Petersen, Mitchell and Rajan, Raghuram (1994) “The Benefits of
Lending Relationships: Evidence from Small Business Data,” Jour-nal of Finance 49, 3—37.
33. Rhoades, Stephen A. (1996) “Competition and Bank Mergers: Direc-tions for Analysis from Available Evidence,” Antitrust Bulletin 61, 339—364.
34. Ruthenberg, David and Ellis, Ricky (1996) “Cost Economies and In-terest Rate Margins in a Unified European Banking Model,” Journal of Economics and Business 48, 231—249.
35. Röller, Lars—Hendrik and Sickles, Robin C. (2000) “Competition, Mar-ket Niches, and Efficiency: A Structural Model of European Airline Industry,” International Journal of Industrial Organization, 18, 845— 865.
36. Santomero, Anthony M. (1984) “Modeling the Banking Firm: A Sur-vey,”Journal of Money, Credit, and Banking 16, 576—602.
37. Shaffer, Sherrill (1985) “Competition, Economies of Scale, and Diver-sity of Firm Sizes,”Applied Economics 17, 467—476.
38. Shaffer, Sherrill (1989) “Competition in the U.S. Banking Industry,”
Economics Letters 29, 321—323.
39. Shaffer, Sherrill (1993) “A Test of Competition in Canadian Banking,”
Journal of Money, Credit, and Banking 25, 49—61.
40. Shaffer, Sherrill (1994a) “Evidence of Monopoly Power Among Credit Card Banks,” Federal Reserve Bank of Philadelphia Working Paper No. 94—16.
41. Shaffer, Sherrill (1994b) “Structure, Conduct, Performance, and Wel-fare,”Review of Industrial Organization 9, 435—450.
42. Shaffer, Sherrill and DiSalvo, James (1994) “Conduct in a Banking Duopoly,”Journal of Banking and Finance 18, 1063—1082.
43. Sharpe, S. (1997) “The Effect of Consumer Switching Costs on Prices: A Theory and its Application to the Bank Deposit Market,” Review of Industrial Organization 12, 79—94.
44. Suominen, Matti (1994) “Measuring Competition in banking: A Two— Product Model,”Scandinavian Journal of Economics 96, 95—110.
Table 1: U.S. Banking Summary Statistics
Variable State Mean Std Dev
Real Estate Loans 13076 17184 Commercial and Industrial Loans 6953 10172
Installment Loans 3829 5002
Real Estate Rate 0.090 0.014
Commercial and Industrial Rate 0.12 0.036
Installment Rate 0.10 0.018
Wage Rate 5.84 1.02
Purchased Funds 9197 13673
Savings Deposits 13780 15624
Purchased Fund Rate 0.069 0.023 Savings Deposit Rate 0.057 0.015
Number of Banks 176 174
Number of Branches 1100 1010
All dollar values are in millions of U.S. dollars, except wage rate which is in thousands of U.S. dollars.
Table 2: Loan Demand Estimates
T Variable Estimate Std Err Ratio
Real Estate Loans
Constant −1.51 0.17 −8.69 Quantity −0.20 0.0023 −88.26 Population −0.066 0.014 −4.77 Income 0.0024 0.00081 2.94 Q2 −0.0084 0.0012 −7.00 Q3 −0.0037 0.0010 −3.70 Q4 0.0025 0.00093 2.70 Total Assets 0.00030 0.0059 0.05 NBR/N 0.0013 0.00028 4.67 Total Loans 0.15 0.0054 27.10
Commercial and Industrial Loans
Constant −1.15 0.13 −8.63 Quantity −0.22 0.0019 −116.68 Population −0.79 0.012 −65.57 Income −0.0082 0.00078 −10.56 Employment 0.80 0.0085 93.64 Q2 −0.0020 0.0014 −1.43 Q3 0.013 0.0011 12.40 Q4 −0.016 0.0011 −15.41 Total Assets −0.062 0.0063 −9.85 NBR/N −0.0071 0.00032 −22.49 Total Loans 0.22 0.0045 49.78 Installment Loans Constant 5.39 0.12 46.21 Quantity −0.13 0.0012 −109.54 Population −0.34 0.011 −32.32 Income −0.0092 0.00074 −12.49 Q2 −0.011 0.0012 −9.34 Q3 −0.013 0.0010 −12.53 Q4 −0.0090 0.0011 −8.52 Employment −0.20 0.0071 −28.13 Total Assets 0.038 0.0060 6.36 NBR/N −0.006 0.00029 −20.74 Total Loans −0.019 0.0044 −4.20
State and yearly dummy variables are included in each equation, but not reported
Table 3: Deposit Supply Estimates
T Variable Estimate Std Err Ratio Constant −3.04 0.025 −121.16 Quantity 0.20 0.0021 93.58 Income −0.0098 0.00091 −10.73 Q2 −0.010 0.0013 −8.09 Q3 −0.012 0.0011 −11.92 Q4 −0.015 0.0011 −13.53 Total Assets −0.29 0.0069 −42.74 NBR/N −0.0065 0.00031 −20.95 Total Loans 0.12 0.0049 24.20
Table 4: Marginal Cost Estimates for Loans
T Variable Estimate Std Err Ratio
Real Estate Loans
Constant 0.066 0.0076 8.71 lny1 0.071 0.00041 172.39 lny2 −0.091 0.00068 −134.20 lny3 0.004463 0.000690 6.47 NBR 0.000032 3.48E−7 92.85 lnW lab −0.025 0.0019 −13.00 lnW cap −0.023 0.0019 −11.89
Commercial and Industrial Loans
Constant 0.66 0.0062 106.44 lny1 −0.037 0.00062 −60.50 lny2 −0.12 0.00082 −144.81 lny3 −0.046 0.00069 −66.49 NBR 0.000075 3.136E−7 238.02 lnW lab 0.0068 0.0019 3.58 lnW cap −0.074 0.0016 −44.98 Installment Loans Constant 0.248 0.0026 95.40 lny1 0.017 0.00020 82.57 lny3 0.017 0.00027 62.53 lny2 −0.054 0.00033 −165.61 NBR 0.000016 1.17E−7 139.07 lnW lab −0.0967 0.00092 −104.86 lnW cap −0.025 0.00059 −42.71
Table 5: Marginal Cost Estimates for Savings Deposits
T Variable Estimate Std Err Ratio Constant −1.39 0.013 −111.78 lnx3 0.046 0.00093 49.75 NBR 0.000044 4.81E−7 90.60
lnW lab 0.46 0.0036 128.92
lnW cap −0.20 0.0030 −64.34
Table 6: Market Conduct Measures
T Market Parameter Parameter Estimate Std Err Ratio
Disaggregated Model
Real Estate Loans θ1=δ1/N¯ 0.059 0.00079 74.21
Commercial and Industrial Loans θ2=δ2/N¯ 0.11 0.0011 102.11
Installment Loans θ3=δ3/N¯ 0.14 0.0015 91.98
Savings Deposits λ=δ/N¯ 0.032 0.00097 33.15
Disaggregated Model with no deposits
Real Estate Loans θ1=δ1/N¯ 0.059 0.0016 37.83
Commercial and Industrial Loans θ2=δ2/N¯ 0.11 0.0022 50.92
Installment Loans θ3=δ3/N¯ 0.14 0.0029 48.53
Aggregated Model
All Loans θ=δ1/N¯ 0.22 0.027 8.19
Savings Deposits λ=δ/N¯ 0.032 0.0031 10.37
Bücher des Forschungsschwerpunkts Markt und politische Ökonomie Books of the Research Area Markets and Political Economy Andreas Stephan
Essays on the Contribution of Public Infrastruc-ture to Private: Production and its Political Economy
2002, dissertation.de Hans Mewis
Essays on Herd Behavior and Strategic Delegation
2001, Shaker Verlag Andreas Moerke
Organisationslernen über Netzwerke – Die personellen Verflechtungen von
Führungsgremien japanischer Aktiengesellschaften
2001, Deutscher Universitäts-Verlag Silke Neubauer
Multimarket Contact and Organizational Design 2001, Deutscher Universitäts-Verlag
Lars-Hendrik Röller, Christian Wey (Eds.) Die Soziale Marktwirtschaft in der neuen Weltwirtschaft, WZB Jahrbuch 2001 2001, edition sigma
Michael Tröge
Competition in Credit Markets: A Theoretic Analysis
2001, Deutscher Universitäts-Verlag Tobias Miarka
Financial Intermediation and Deregulation: A Critical Analysis of Japanese Bank-Firm-Relationships
2000, Physica-Verlag Rita Zobel
Beschäftigungsveränderungen und organisationales Lernen in japanischen Industriengesellschaften
2000, Humboldt-Universität zu Berlin
http://dochost.rz.hu-berlin.de/dissertationen/zobel-rita-2000-06-19
Jos Jansen
Essays on Incentives in Regulation and Innovation
2000, Tilburg University Ralph Siebert
Innovation, Research Joint Ventures, and Multiproduct Competition
2000, Humboldt-Universität zu Berlin
http://dochost.rz.hu-berlin.de/dissertationen/siebert-ralph-2000-03-23/
Damien J. Neven, Lars-Hendrik Röller (Eds.) The Political Economy of Industrial Policy in Europe and the Member States
Jianping Yang
Bankbeziehungen deutscher Unternehmen: Investitionsverhalten und Risikoanalyse 2000, Deutscher Universitäts-Verlag Christoph Schenk
Cooperation between Competitors –
Subcontracting and the Influence of Information, Production and Capacity on Market Structure and Competition
1999, Humboldt-Universität zu Berlin
http://dochost.rz.hu-berlin.de/dissertationen/schenk-christoph-1999-11-16
Horst Albach, Ulrike Görtzen, Rita Zobel (Eds.) Information Processing as a Competitive Advantage of Japanese Firms
1999, edition sigma Dieter Köster
Wettbewerb in Netzproduktmärkten 1999, Deutscher Universitäts-Verlag Christian Wey
Marktorganisation durch Standardisierung: Ein Beitrag zur Neuen Institutionenökonomik des Marktes
1999, edition sigma
Horst Albach, Meinolf Dierkes, Ariane Berthoin Antal, Kristina Vaillant (Hg.)
Organisationslernen – institutionelle und kulturelle Dimensionen
WZB-Jahrbuch 1998 1998, edition sigma
Lars Bergman, Chris Doyle, Jordi Gual, Lars Hultkrantz, Damien Neven, Lars-Hendrik Röller, Leonard Waverman
Europe’s Network Industries: Conflicting Priorities - Telecommunications
Monitoring European Deregulation 1
1998, Centre for Economic Policy Research Manfred Fleischer
The Inefficiency Trap Strategy Failure in the
German Machine Tool Industry 1997, edition sigma
Christian Göseke
Information Gathering and Dissemination The Contribution of JETRO to
Japanese Competitiveness
DISCUSSION PAPERS 2001
Fredrik Andersson Kai A. Konrad
Globalization and Human Capital Formation FS IV 01 – 01 Andreas Stephan Regional Infrastructure Policy and its Impact
on Productivity: A Comparison of Germany and France
FS IV 01 – 02
Tomaso Duso Lobbying and Regulation in a Political Economy: Evidence from the US Cellular Industry
FS IV 01 – 03 Steffen Huck
Kai A. Konrad Wieland Müller
Merger and Collusion in Contest FS IV 01 – 04
Steffen Huck Kai A. Konrad Wieland Müller
Profitable Horizontal Mergers without Cost Advantages: The Role of Internal Organization, Information, and Market Structure
FS IV 01 – 05
Jos Jansen Strategic Information Revelation and Revenue Sharing in an R&D Race
(A revision of FS IV 99-11)
FS IV 01 – 06
Astrid Jung Are Product Innovation and Flexible Technology Complements?
FS IV 01 – 07 Jonas Björnerstedt
Johan Stennek
Bilateral Oligopoly FS IV 01 – 08
Manfred Fleischer Regulierungswettbewerb und Innovation in der chemischen Industrie
FS IV 01 – 09 Karl Wärneryd Rent, Risk, and Replication –
Preference Adaptation in Winner-Take-All Markets
FS IV 01 – 10 Karl Wärneryd Information in Conflicts FS IV 01 – 11
Steffen Huck Kai A. Konrad
Merger Profitability and Trade Policy FS IV 01 – 12 Michal Grajek Gender Pay Gap in Poland FS IV 01 – 13 Achim Kemmerling
Andreas Stephan
The Contribution of Local Public Infra-structure to Private Productivity and its Political-Economy: Evidence from a Panel of Large German Cities
FS IV 01 – 14
Suchan Chae Paul Heidhues
Nash Bargaining Solution with Coalitions and the Joint Bargaining Paradox
FS IV 01 – 15 Kai A. Konrad
Harald Künemund Kjell Erik Lommerud Julio R. Robledo
Kai A. Konrad Investment in the Absence of Property Rights – The Role of Incumbency Advantages
FS IV 01 – 18 Roman Inderst
Christian Wey
Bargaining, Mergers, and Technology Choice in Bilaterally Oligopolistic Industries
FS IV 01 – 19 Kai A. Konrad
Helmut Seitz
Fiscal Federalism and Risk Sharing in Germany: The Role of Size Differences
FS IV 01 – 20 Klaus Gugler
Dennis C. Mueller B. Burcin Yurtoglu Christine Zulehner
The Effects of Mergers: An International Compari-son
FS IV 01 – 21
Kjell Erik Lommerud Odd Rune Straume Lars Sørgard
Downstream Merger with Oligopolistic Input Suppliers
FS IV 01 – 22
Andreas Blume Paul Heidhues
Tacit Collusion in Repeated Auctions FS IV 01 – 23 Roman Inders
Christian Wey
The Incentives for Takeover in Oligopoly FS IV 01 – 24 Klaus Gugler
Dennis C. Mueller B. Burcin Yurtoglu
Corporate Governance, Capital Market Discipline and the Returns on Investment
FS IV 01 – 25
Sven-Olof Fridolfsson
Johan Stennek Why Mergers Reduce Profits and Raise Share Prices: A Theory of Preemptive Mergers
DISCUSSION PAPERS 2002
Fredrik Andersson Kai A. Konrad
Human Capital Investment and Globalization in Extortionary States
FS IV 02 – 01 Lars-Hendrik Röller
Christian Wey
Merger Control in the New Economy FS IV 02 – 02 Talat Mahmood
Klaus Schömann
Die Determinanten der Mirgrationsentscheidung von IT-Hochschulabsolventen aus Pakistan – Empirische Befunde zur Ausgestaltung der deutschen „Green Card“
FS IV 02 – 03
Jos Jansen The Effects of Disclosure Regulation on Innovative Firms: Common Values
FS IV 02 – 04 Jos Jansen The Effects of Disclosure Regulation on Innovative
Firms: Private Values
FS IV 02 – 05 Günter Franke
Harris Schlesinger Richard C. Stapleton
Multiplicative Background Risk FS IV 02 – 06
Tomaso Duso On the Politics of the Regulatory Reform: Econometric Evidence from the OECD Countries
FS IV 02 – 07 Johan Lagerlöf
Paul Heidhues
On the Desirability of an Efficiency Defense in Merger Control
FS IV 02 – 08 Olivier Cadot
Lars-Hendrik Röller Andreas Stephan
Contribution to Productivity or Pork Barrel? The Two Faces of Infrastructure Investment
FS IV 02 – 09
Justus Haucap
Christian Wey Unionization Structures and Firms’ Incentives for Productivity Enhancing Investments
FS IV 02 – 10 Heidrun C. Hoppe
Emre Ozdenoren Intermediation in Innovation FS IV 02 – 11 Rainer Nitsche On the Effectiveness of Anti-Predation Rules FS IV 02 – 12 Daniel Krähmer Entry and Experimentation in
Oligopolistic Markets for Experience Goods
FS IV 02 – 13 J. Peter Murmann The Coevolution of Industries and National
Institutions: Theory and Evidence
FS IV 02 – 14 Kai A. Konrad Terrorism and the State FS IV 02 – 15 Robert Nuscheler Physician Reimbursement, Time-Consistency and
the Quality of Care
FS IV 02 – 16 Fredrik Andersson
Kai A. Konrad Taxation and Education Investment in the Tertiary Sector
FS IV 02 – 17 Jan Boone ‘Be nice, unless it pays to fight’: A New Theory of FS IV 02 – 18
Kai A. Konrad Altruism and Envy in Contests: An Evolutionarily Stable Symbiosis
FS IV 02 – 19 Helmut Bester
Kai A. Konrad Delay in Contests FS IV 02 – 20 Kjell Erik Lommerud
Bjørn Sandvik Odd Rune Straume
Good Jobs, Bad Jobs and Redistribution FS IV 02 – 21
Steffen Huck Vicki Knoblauch Wieland Müller
On the Profitability of Collusion in Location Games FS IV 02 – 22
Ralph Siebert Learning by Doing and Multiproduction Effects over the Life Cycle: Evidence from the
Semiconductor Industry
FS IV 02 – 23
Jürgen Bracht Saul Lach Eyal Winter
Modeling Oligopolistic Price Adjustment in Micro Level Panel Data
FS IV 02 – 24
Steffen Huck
Kai A. Konrad Strategic Trade Policy and the Home Bias in Firm Ownership Structure
FS IV 02 – 25 Daniel Krähmer Delegation versus Authority FS IV 02 – 26
Thomas Knaus
Robert Nuscheler Incomplete Risk Adjustment and Adverse Selection in the German Public Health Insurance System
FS IV 02 – 27
Kurt R. Brekke Robert Nuscheler Odd Rune Straume
Quality and Location Choices under Price Regulation
FS IV 02 – 28
Kai A. Konrad Inverse Campaigning FS IV 02 – 29 Sebastian Kessing A Note on the Determinants of Labour Share
Movements
FS IV 02 – 30 Sebastian Kessing Employment Protection and Product Market
Competition
FS IV 02 – 31 Michal Grajek Identification of Network Externalities in Markets
for Non-Durables
FS IV 02 – 32 Robert M. Adams
Lars-Hendrik Röller Robin C. Sickles
Market Power in Outputs and Inputs: An Empirical Application to Banking
Bei Ihren Bestellungen von WZB-Papers schicken Sie bitte unbedingt einen an Sie adressierten Auf-kleber mit sowie je paper eine Briefmarke im Wert von 0,51 Euro oder einen "Coupon Reponse Inter-national " (für Besteller aus dem Ausland)
Please send a self addressed label and postage stamps in the amount of 0.51 Euro or a "Coupon- Reponse International" (if you are ordering from outside Germany) for each WZB-paper requested