Environmental Performance Review
Environmental Performance Review: 2012 2
Contents
Executive Summary ... 3
1. Introduction ... 8
2. Carbon Footprint ... 9
3. Strategy and Reporting ... 13
4. Energy in Buildings... 15
5. Transport ... 24
6. Research and Teaching ... 17
7. Waste ... 19
8. Engagement & Promotion ... 15
9. Construction ... 26
10. Water ... 27
11. Procurement ... 27
12. Biodiversity ... 29
Environmental Performance Review: 2012 3
Executive Summary
Key Achievements in 2012:
Nearly all of the environmental indicators used assess our environmental footprint improved in 2012. The consumption of electricity, gas and water were all less than 2011. The amount of land transport, waste to landfill and paper consumption was also down on 2011, while the percentage of waste diverted from landfill was up. The only indicator that has had a negative shift was the amount of air travel, which increased by 11.9% over 2011.
There is increasing collaboration between campus services and the academic body on environmental projects. Three summer scholarship projects were delivered in the 2012/13 summer and a scholarship for a Masters project has been established for 2013/14 (with the assistance of $25,000 of funding from Corporate Express). All of these projects apply the research outputs from different schools across the University to deliver practical outputs for Campus Services, with co-ordination by an academic supervisor and a campus services supervisor.
The continuation of the energy management programme with a focus on
optimising the control of mechanical plant and effective tender processes has led to on-going energy cost savings. Currently, gas expenditure is currently about $60,000/yr below 10-year targets for expenditure, while electricity expenditure is about $650,000/yr below target.
The strong relationship that has been built with the Greater Wellington Regional Council Public transport team has led to the University providing regular input into the Wellington City Bus Review, which has resulted in improved bus services to the University. GWRC is also giving increased consideration to offering
discounts to tertiary students after regular lobbying from the University.
The Campus Hub has construction is proceeding ready for opening in early 2013. Environmentally Sustainable features have been incorporated into the design including energy efficiency through the mixed mode ventilation system which maximises the use of fresh air and uses a displacement system to minimise the need for heating and cooling. Other measures include efficient lighting design and mechanical plant, variable speed pumps and fans. Provision is also made for water conservation, cyclist facilities and the introduction of a recycling bin system that is being scoped for expansion to the rest of the University. These are just some of the examples of the sustainability aspects of the building.
Environmental Metrics:
Units 2007 2008 2009 2010 2011 2012 % change ‘11 v ‘12
Energy Use in Buildings
Electricity kWh 19,725,899 18,913,029 19,187,442 19,558,820 19,956,306 19,700,448 -1.3% Gas kWh 16,687,767 14,850,121 15,740,497 14,807,681 15,443,427 14,769,912 -4.4% Total kWh 36,413,666 33,763,150 34,927,939 34,366,501 35,399,733 34,470,360 -2.6% Business Travel Land km 874,990 997,875 733,189 668,092 387,774 693,973 -0.8% Air km 32,259,843 30,065,341 34,999,543 39,352,287 41,302,268 46,211,219 11.9% Total km 33,134,833 31,063,216 35,727,936 40,020,379 41,690,042 46,905,192 12.5% Commuting*
Staff car driving km 3,483,000 3,483,000 3,483,000 3,248,000 3,248,000 3,248,000 N/A Student car driving km 2,389,000 2,389,000 2,389,000 2,389,000 2,389,000 2,389,000 N/A % staff car drivers % 39% 39% 39% 36% 36% 36% N/A % student car drivers % 7% 7% 7% 7% 7% 7% N/A
Water
Water used m3 181,562 215,112 164,821 142,166 141,188 123,929 -12.2% Waste^
Waste to landfill kg 504,510 416,090 458,915 465,410 557,702 397,340 -28.8% Mixed waste recycled kg 35,984 31,973 37,700 33,840 25,830 15,560 -39.8% Paper recycled kg 182,700 210,280 201,660 187,500 225,420 182,100 -19.2%
Cardboard recycled kg 24,850 24,904 0.2%
% of waste recycled % 31% 37% 34% 32% 33% 36% 8.8%
Consumables
Virgin paper used reams 60,376 56,912 54,877 58,198 51,954 51,277 -1.3% Recycled paper used reams 1,180 2,425 3,199 3,177 2,642 3,145 19.0%
Environmental Performance Review: 2012 5 2012 Action Plan Targets and Achievement:
Action Area Target(s) Achievement
Strategy & Reporting
To complete the action points set out in this document, with greater emphasis placed on the higher priority actions.
39 of the 47 planned actions (83%) were completed or in progress. In the top 3 priority areas 14 of the 19 planned
actions were brought to an effective conclusion.
Promotion & Engagement
That the Environmental Committee
Communications Plan is implemented with increased engagement by staff and
students.
The majority of the Communications Plan was
implemented. No noticeable change in engagement by staff
and students.
--Teaching & Research
Initiate at least 4 research projects with practical application for the University.
Three summer scholarships and one Masters project established through campus services collaboration with
academic supervisors.
Develop a stronger network for all
academic staff interested in sustainability.
Achieved. The initial workshop for the development of the Smart Green project has provided the foundation for on-going collaboration among academics with a sustainability interest.
Waste Minimisation
To include the waste strategy
requirements in the cleaning and waste tender.
Achieved. OCS awarded contract with OCS Wasteline now
working on waste strategy.
To successfully implement a pilot waste and recycling system at Te Aro and Karori and achieve the waste targets at those sites.
Cleaning tender deferred until late 2012 and thus delayed pilot. Hub now being used as pilot area, with recycling
Environmental Performance Review: 2012 6
Action Area Target(s) Achievement
Energy Efficiency
A reduction in electricity consumption of 2% compared to 2011 for equivalent staff & student numbers and built floor area.
Electricity consumption in 2012 was 1.1% less than 2011 for equivalent staff & student numbers and built floor area. Note: Electricity consumption actually decreased by 1.3%, total building floor area remained about the same, however staff and student numbers decreased by 1%
--A reduction in natural gas consumption of 2% compared to 2011 for equivalent staff & student numbers, built floor area and climate conditions.
Gas consumption in 2012 was 9.9% less than 2011 for equivalent staff & student numbers, built floor area and climate conditions. Note: Gas use actually decreased by 4.4% while the built floor area remained the same and student/staff numbers decreased, as above, however there were 6.4% more heating degree days (heating demand from air temperature) in 2012 than in 2011.
Travel Demand Management
A 3% drop in the demand for staff parking (as measured by the number of staff with parking permits or on the waiting list)
Not achieved. The number of staff with parking permits or
on the waiting list has increased by 1.7%
Campus Development Provide ESD training for all Campus Services Project Managers.
Partially achieved. Project Managers have attended GreenStar training, but no in-house training has followed.
Awaiting compilation of all campus design standards
--Sustainable Procurement
To review at least 3 key suppliers for information on their environmental practices and how they support our environmental objectives.
Not achieved.
Water Management Maintain water consumption at the same level as 2011.
Achieved (and exceeded). Water consumption reduced by
Environmental Performance Review: 2012 7
Action Area Target(s) Achievement
Biodiversity To commence work on the development
of the Biodiversity Plan
Achieved. Master Scholarship established and undergrad students have commenced work on inventory of campus
biodiversity.
Environmental Compliance
To continue to maintain environmental
1. Introduction
The University continually monitors its environmental performance and every year reports on key indicators to measure its environmental impact, including a full carbon footprint in line with the Greenhouse Gas Protocol.
The actions to reduce the University’s environmental impact over the past year were planned in the 2012 Environmental Action Plan. In total 48 actions / projects were planned for the 2012 calendar year which helped make VUW more environmentally sustainable. The prioritised action areas included:
1. Strategy and Reporting 2. Promotion and Engagement 3. Teaching and Research 4. Waste 5. Energy 6. Transportation 7. Construction 8. Procurement 9. Water 10. Biodiversity 11. Environmental Compliance
This report quantifies the University’s environmental impacts for 2012 (including its carbon footprint) and reports on progress compared to previous years in its key environmental indicators. A review is also provided for each of the action areas listed above, including the achievement of the targets set in each area and a completion status of the actions planned.
Environmental Performance Review: 2012 9
2. Carbon Footprint
The organisational boundary for Victoria University when calculating the carbon footprint in general includes all VUW property and entities that are majority controlled by VUW or VUW subsidiaries. However, it excludes student accommodation and any tenants where metering of resource use is in place. 2012 Greenhouse Gas Emissions Profile:
The reporting of the University’s Greenhouse Gas (GHG) emissions follows The Greenhouse Gas Protocol published by the World Resources Institute and World Business Council for Sustainable Development in March 2004.
Scope 1: Direct GHG emissions from sources that are owned or controlled by VUW:
Type of Emission Consumption Units CO2 factor kg CO2e
Natural Gas 14,769,912 kWh 0.191 kg/kWh* 2,821,053
Diesel (Generators) 779 litres 2.66 kg/l* 2,072
Fleet Vehicles
Diesel litres 2.70 kg/l* 19,283
Petrol litres 2.34 kg/l* 75,352
Total 2,917,760
* CO2 factors sourced from Guidance for Voluntary Corporate Greenhouse Gas Reporting – Data and
Methods for the 2011 Calendar Year published by the Ministry for the Environment in October 2012.
Note: although it is for the 2011 year, it is the latest official data available.
Scope 2: Indirect GHG emissions from the generation of purchased electricity consumed by VUW, but physically emitted at the facility where the electricity is generated.
Type of Emission Consumption Units CO2 factor kg CO2e
Electricity 19,700,448 kWh 0.129 kg/kWh* 2,541,358
* CO2 factors sourced from Guidance for Voluntary Corporate Greenhouse Gas Reporting – Data and
Methods for the 2011 Calendar Year published by the Ministry for the Environment in October 2012.
Environmental Performance Review: 2012 10
Scope 3: Other indirect GHG emissions that occur as a consequence of VUW’s activities but are not owned or controlled by the University. VUW has elected to monitor and report on the following sources of emissions as the most relevant sources of Scope 3 emissions.
Type of Emission Consumption Units CO2 factor kg CO2e
Air Travel Domestic Trans Tasman International 3,446,885 4,581,574 38,182,760 km km km 0.167 kg/km* 0.0952 kg/km* 0.109 kg/km* 575,630 436,166 4,161,921 Commuter Travel Driver Passenger in Car Motorcycle / Scooter Walk / Run Cycle Bus Train 5,637,000 4,269,000 706,000 3,384,000 353,000 7,539,000 20,630,000 km km km km km km km 0.24 kg/km^ 0 kg/km^ 0.08 kg/km^ 0 kg/km^ 0 kg/km^ 0.09 kg/km^ 0.03 kg/km^ 1,127,400 0 56,480 0 0 678,510 618,900 Land Transport Taxis Rental Cars Mileage 13,333 14,399 802 litres km litres 0.114 kg/l* 0.237 kg/km* 2.34 kg/l* 31,199 33,694 1,876 Waste Landfill waste Paper recycled 397,340 182,100 kg kg 0.65 kg/kg* -0.44 kg/kg^ 258,271 -80,124 Total 7,899,923
* CO2 factors sourced from Guidance for Voluntary Corporate Greenhouse Gas Reporting – Data and
Methods for the 2011 Calendar Year published by the Ministry for the Environment in October 2012.
Note: although it is for the 2011 year, it is the latest official data available.
Environmental Performance Review: 2012 11 Natural Gas 2,821,053 kg 21.1% Diesel Generators 2,072 kg 0.0% Vehicle Fleet 94,635 kg 0.7% Electricity 2,541,358 kg 19.0% Commuter Travel 2,481,290 kg 18.6% Air Travel 5,173,716 kg 38.7% Land Transport 66,769 kg 0.5% Waste 178,147 kg 1.3%
Environmental Performance Review: 2012 12 Environmental Metrics
Units 2007 2008 2009 2010 2011 2012 % change ‘11 v ‘12
Energy Use in Buildings
Electricity kWh 19,725,899 18,913,029 19,187,442 19,558,820 19,956,306 19,700,448 -1.3% Gas kWh 16,687,767 14,850,121 15,740,497 14,807,681 15,443,427 14,769,912 -4.4% Total kWh 36,413,666 33,763,150 34,927,939 34,366,501 35,399,733 34,470,360 -2.6% Business Travel Land km 874,990 997,875 733,189 668,092 387,774 693,973 -0.8% Air km 32,259,843 30,065,341 34,999,543 39,352,287 41,302,268 46,211,219 11.9% Total km 33,134,833 31,063,216 35,727,936 40,020,379 41,690,042 46,905,192 12.5% Commuting*
Staff car driving km 3,483,000 3,483,000 3,483,000 3,248,000 3,248,000 3,248,000 N/A Student car driving km 2,389,000 2,389,000 2,389,000 2,389,000 2,389,000 2,389,000 N/A % staff car drivers % 39% 39% 39% 36% 36% 36% N/A % student car drivers % 7% 7% 7% 7% 7% 7% N/A
Water
Water used m3 181,562 215,112 164,821 142,166 141,188 123,929 -12.2% Waste^
Waste to landfill kg 504,510 416,090 458,915 465,410 557,702 397,340 -28.8% Mixed waste recycled kg 35,984 31,973 37,700 33,840 25,830 15,560 -39.8% Paper recycled kg 182,700 210,280 201,660 187,500 225,420 182,100 -19.2%
Cardboard recycled kg 24,850 24,904 0.2%
% of waste recycled % 31% 37% 34% 32% 33% 36% 8.8%
Consumables
Virgin paper used reams 60,376 56,912 54,877 58,198 51,954 51,277 -1.3% Recycled paper used reams 1,180 2,425 3,199 3,177 2,642 3,145 19.0%
Total CO2e emissions tonnes 14,084 12,827 13,213 13,009 13,362 13,360 0.0%
* Note: Commuting data was recorded for staff and students in 2007. The commuting patterns in following years are assumed to be the same as 2007 for students, while staff travel patterns were resurveyed in 2010. In 2013 the travel patterns of both staff and students will be re-surveyed.
3. Strategy and Reporting
Much of the day-to-day delivery of the initiatives in the Environmental Action Plan is handled by the Environmental Manager. The Environmental Committee provides a forum for more strategic planning and direction. In 2012, representatives were from Humanities (Angi Buettner) and Law (Catherine Iorns) were added to the
Environmental Committee to give wider representation across the University faculties. The Environmental Policy was updated with changes being introduced to reflect a stronger commitment to Maori perspectives on environment and
sustainability and encouragement of sustainability teaching and research. Planning for some key strategic developments likely to be delivered in 2013 commenced. Firstly, the scoping for an additional position in Environmental Management to support the programme with a focus on engagement and generating greater buy-in from staff and students. Secondly, Charles Daugherty, Assistant Vice-Chancellor Research, has led planning for the development of the ‘SmartGreen’ project which aims to brings academics from around the University to collaborate on sustainability research projects that make a contribution to national, local and on-campus intiatives.
Reporting processes continued as usual.
Target Achievement
To complete the action points set out in this document [the 2011 Environmental Action Plan], with greater emphasis placed on the higher priority actions.
39 of the 47 planned actions (83%) were completed or in progress. In the top 3 priority areas 14 of the 19 planned actions were brought to an effective conclusion.
Action Completion
Report on overall environmental performance of
2011. Completed
Fill the vacant positions of the re-structured Environmental Committee and hold regular Committee meetings.
Partially Completed. Additional reps for Humanities and Law added – still vacant positions for Engineering and Toihuarewa
-- Update the Environmental Policy following feedback from the University and wider stakeholders.
Environmental Performance Review: 2012 14
Action Completion
Report on key environmental indicators, where data is collected monthly, in the CS report (energy, waste and recycling, air travel, water).
Completed
Develop a business case and make an
application to the University’s strategic fund to provide additional resourcing to the committee
Initial approval given for the creation of Environmental Co-ordinator role by COO.
Develop the Action Plan for 2013. Completed
Recommend strategic initiatives through SMT as appropriate.
Completed on an
Environmental Performance Review: 2012 15
4. Promotion & Engagement
It is important to maintain regular publicity of environmental achievements as it helps provide staff and students with reminders that they need to be making
sustainable choices each day. In 2012, the VicENVIRONMENT newsletter, which gets distributed around staff continued along with other regular communication channels such as Vic News and the website. A communications plan has been developed to guide and schedule communication actions both internally and externally. Most of the scheduled actions in the communications plan have been delivered as part of business as usual. However, there is still a need to develop the website content and increase the frequency of news stories to more proactively highlight the positive results from environmental sustainability and generate greater engagement. Actions are planned for 2013 to address this.
Target Achievement
That the Environmental Committee Communications Plan is implemented with increased engagement by staff and students.
The majority of the Communications Plan was implemented. No noticeable change in engagement by staff and students.
Action Completion
Deliver the Communications Plan, which includes the following key outputs:
Preparation of a calendar for annual communications
Contributions to annual publications
Update (and maintain) website content
Write and distribute quarterly
VicENVIRONMENT internal newsletter
Regular stories for communication channels including VicNews, Victorious and external outlets.
Completed Completed
Some content updated, but still requires further work
Completed on an ongoing basis Regular stories in VicNews and some external outlets
--
Re-activate Environmental Champions Network with the Launch of the Green Office Assessment Programme
Green Office was launched to the
Champions Network but not continued due to lack of participation
--Environmental Performance Review: 2012 16
Action Completion
Support student lead initiatives through collaboration with the VUWSA
Environmental Officer and relevant environmental clubs.
Completed on an ongoing basis although on campus student activity is not as strong as previous years
Environmental Performance Review: 2012 17
5. Teaching and Research
As the University has developed its environmental management programme to reduce its impacts at an operational level, it has recognised the need to promote sustainability in teaching and research as well. The University has already established a wide range of courses and research expertise relating to environmental
sustainability. The intention is to foster collaboration between the different disciplines and apply teaching and research to sustainability opportunities on campus to generate practical solutions.
In 2012, further progress has been made to bring the operational and academic aspects of the University closer together through sustainability projects. Three summer scholarship projects were delivered in the 2012/13 summer and a scholarship for a Masters project has been established for 2013/14 (with the
assistance of $25,000 of funding from Corporate Express). All of these projects apply the research outputs from different schools across the University to deliver practical outputs for Campus Services, with co-ordination of an academic supervisor and a campus services supervisor.
Additionally, in 2012 the AVC Research, Charles Daugherty, led the establishment the Smart Green – a project to bring together expertise from around the University in a co-ordinated approach to address environmental challenges at a national, local and campus level. It has already led to a formal MoU with the City Council and the establishment of a Post-Doctoral Fellow – Cities and Urban Nature position. The Smart Green project is still in its infancy but has the prospect of providing considerable strategic value for the University.
Target Achievement
Initiate at least 4 research projects with practical application for the University.
Achieved. Three summer scholarships and one Masters project established through campus services collaboration with academic supervisors.
Develop a stronger network for all academic staff interested in sustainability
Achieved. The initial workshop for the development of the Smart Green project has provided the foundation for on-going collaboration among academics with a sustainability interest.
Environmental Performance Review: 2012 18
Action Completion
Provide a formal submission to the
Under-Graduate Review to promote the prominence of environmental sustainability
Completed
Establish network for Victoria academic staff interested in sustainability research.
Completed through the Committee mailing list and the SmartGreen collaboration and blog
Encourage the uptake of sustainability related research topics with practical application for the University through summer scholarships. Aim to have 4 scholarships established for the 2012/13 summer period
Completed,
although there are 3 summer
scholarships and 1 Masters
Establish a quarterly ‘Sustainability Lecture’ to
foster collaboration and community involvement. Not established yet
Investigate where the greatest opportunities for growth in sustainability research and teaching lie and develop a plan to best integrate it with the University’s Strategic Plan
Some initial information collated but plan yet to be
developed
Environmental Performance Review: 2012 19
6. Waste
Waste, or more specifically recycling, is the most visible and engaging aspect of campus environmental action. Often, when people think of sustainability the first thing that comes to mind is recycling. Thus it is important that an effective and visible recycling scheme is delivered on campus.
In 2012 waste and recycling collection services were included in the tender process for cleaning services. It was decided that waste and recycling have a natural synergy with cleaning and it would provide strategic advantage to link them together. OCS was awarded the cleaning contract and following on from that a waste strategy is being developed with OCS Wasteline. The first component of this is the installation of 17 recycling receptacles as part of the Hub fit out. This will be used as trial to assess the user interaction with the bins, the servicing requirements for the bins and the impact on the waste to landfill. The other aspects of the waste strategy will be refined and implemented through 2013 and following years.
The recorded waste data in 2012 showed a significant improvement. Total reported waste to landfill dropped by 29%, while the percentage of waste that gets diverted from landfill into recycling increased from 33% to 36%. These are encouraging figures, as there have been no significant changes to infrastructure and indicate that staff and student behaviours are changing to generate less waste on campus.
Targets Achievement
To include the waste strategy
requirements in the cleaning and waste tender.
Achieved. OCS awarded contract with OCS Wasteline now working on waste strategy.
To successfully implement a pilot waste and recycling system at Te Aro and Karori and achieve the waste targets at those sites.
Cleaning tender deferred until late 2012 and thus delayed pilot. Hub now being used as pilot area, to be incorporated with furniture fit out.
Environmental Performance Review: 2012 20
Action Completion
Finalise and implement the Waste
Strategy, which has three key milestones:
Include the waste reduction and diversion targets and recycling system requirements in the tender process for cleaning and waste services.
Pilot the new waste and recycling system at Te Aro and Karori campuses.
Expand the system throughout the rest of the University
Completed
Replaced with Hub pilot – underway
Originally planned for 2013
N/A
Continue to encourage localised systems for organic waste collection
Completed on an ongoing
basis
Continue to promote waste minimisation and recycling through standard
communication channels
Completed on an ongoing
Environmental Performance Review: 2012 21
7. Energy in Buildings
Electricity and Natural Gas account for 40% of the University’s carbon footprint. In 2012 several large items of old mechanical plant were replaced with new, more efficient models including new boilers at the Karori campus and the Student Union Building. In addition, the continuous commissioning service was renewed with our Building Management System providers whereby the controls strategies, time schedules and temperature set points of mechanical plant get reviewed and optimised. The University has also entered into the DemandSMART programme whereby at times of peak load on the electricity network in the lower North Island VUW will be paid to use the Laby generator as a means of reducing load on the network. Although this does not reduce energy use, it makes more effective use of our assets and provides an income stream. The cost savings from all of these projects implemented in 2012 is estimated at $91,000/yr.
The detailed energy monitoring compiled by a Building Science post graduate student continued. The analysis enables close tracking of energy trends by building and quick diagnosis of energy waste and saving opportunities. It also provides a student with useful work experience.
Progress towards 10-yr Energy Strategy Targets:
TOU Electricity Expenditure Gas Expenditure
Business as
Usual Target Actual
Business as
Usual Target Actual
2007 $2,369,709 $2,302,896 $1,969,866 $897,530 $867,053 $976,148 2008 $2,762,785 $2,514,327 $2,042,745 $1,042,632 $906,556 $754,062 2009 $3,172,637 $2,654,159 $1,909,571 $1,188,235 $898,343 $716,928 2010 $3,456,214 $2,658,024 $1,963,155 $1,270,587 $840,092 $739,345 2011 $3,990,091 $2,963,861 $2,336,645 $1,441,481 $882,314 $822,440 2012 $4,331,034 $3,175,043 $2,520,063 $1,441,481 $839,786 $779,862
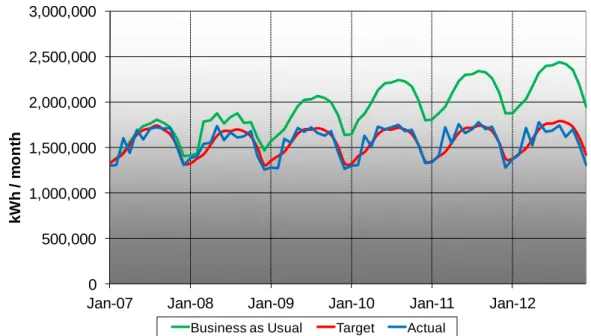
Environmental Performance Review: 2012 22 0 500,000 1,000,000 1,500,000 2,000,000 2,500,000 3,000,000
Jan-07 Jan-08 Jan-09 Jan-10 Jan-11 Jan-12
k W h / m o n th
TOU Electricity Consumption
Business as Usual Target Actual
Figure 2: Progress towards 10-yr electricity consumption targets
Electricity consumption for 2012 was 2% better than the target for the 10-yr strategy and 28% below Business as Usual.
0 500,000 1,000,000 1,500,000 2,000,000 2,500,000 3,000,000 3,500,000
Jan-06 Jan-07 Jan-08 Jan-09 Jan-10 Jan-11 Jan-12
k W h /m o n th Gas Consumption
Business as Usual Target Actual
Figure 3: Progress towards 10-yr gas consumption targets
Gas consumption for 2012 was 41% above the target for the 10-yr strategy, but 17% below Business as Usual.
Environmental Performance Review: 2012 23
Target Achievement
A reduction in electricity consumption of 2% compared to 2011 for equivalent staff & student numbers and built floor area.
Electricity consumption in 2012 was 1.1% less than 2011 for equivalent staff & student numbers and built floor area. Note: Electricity consumption actually decreased by 1.3%, total building floor area remained about the same, however staff and student numbers decreased by 1%
A reduction in natural gas consumption of 2% compared to 2011 for equivalent staff & student numbers, built floor area and climate conditions.
Gas consumption in 2012 was 9.9% less than 2011 for equivalent staff & student numbers, built floor area and climate conditions. Note: Gas use actually decreased by 4.4% while the built floor area remained the same and
student/staff numbers decreased, however there were 6.4% more heating degree days (heating demand from air temperature) in 2012 than in 2011.
Action Completion
Continue to engage a Building Science student to deliver the monthly energy tracking programme used to highlight energy savings and anomalies from normal consumption patterns.
Completed on an ongoing
basis
Continue optimising the control strategies of mechanical plant through the Building Management System, including the introduction of standardised levels of service for operation schedules and space temperatures.
Completed on an ongoing
basis
Work with ITS to deploy GreenTrac software to audit the use of computers overnight, recording energy consumption and user patterns.
Then determine which software
application will deliver the best strategy for overnight shut-down of computers.
Completed. Audit done and trial of in-house and third party packages also completed. Preferred vendor identified. Seeking funding approval in 2013.
Ensure that replacement mechanical plant is designed to energy efficient standards
Completed on an ongoing
basis
Review any potential energy saving
Environmental Performance Review: 2012 24
8. Transport
A University inherently generates a lot of travel – staff and students commuting to and from the campus each day, as well as air travel for staff to attend conferences and present research. Transport accounts for over half of the University’s
greenhouse gas emissions.
The environmental impact of air travel remains a challenge for the University. Air travel kilometres continue to increase – up 12% in 2012. Video conferencing alternatives continue to be promoted, and now the ‘reason for travel’ is being captured as part of the booking process, so those alternatives will be able to be better targeted at specific travellers. However, there is still no effective strategy in place to reduce air travel.
0 10,000,000 20,000,000 30,000,000 40,000,000 50,000,000
Jan Feb Mar Apr May Jun Jul Aug Sep Oct Nov Dec
K il o m e tr e s T ra v e ll e d
Cumulative Annual Air Travel (APX)
2008 2009 2010 2011 2012 Figure 4: Air Travel booked through APX (NB: this excludes P-card travel)
The strong relationship that has been built with the Greater Wellington Regional Council Public transport team has led to the University providing regular input into the Wellington City Bus Review, which has resulted in improved bus services to the University. GWRC is also giving increased consideration to offering discounts to tertiary students after regular lobbying from the University.
Despite the continued increase in pricing for staff parking permits and the improvements to sustainable commuting options, the demand for on-campus parking increased by 1.3% in 2012.
Environmental Performance Review: 2012 25
Targets Achievement
A 3% drop in the demand for staff parking (as measured by the number of staff with parking permits or on the waiting list)
Not achieved. The number of staff with parking permits or on the waiting list has increased by 1.7%
Action Completion
Distribute VUW walking maps around campus at Orientation and
Re-Orientation
Not completed. Only used the online version – no further maps printed due to budget constraints.
Promote availability of inter-campus Snapper card and manage top-ups.
Completed on an ongoing
basis.
Continue relationship with GWRC (Greater Wellington Regional Council) and make a submission on Wellington Bus Service Review
Completed with ongoing collaboration on the network
and fare reviews
Investigate the feasibility of funding a discount for staff bus travel.
Deferred pending outcome of GWRC Network review and if the VUW subsidy for route 17 is still required.
--
Monitor patronage of motorcycle andcycle parking facilities and improve as appropriate.
Completed on an ongoing
basis
Implement and promote a carpooling strategy for staff.
Strategy developed with implementation planned for
2013
Continue planned price increase for parking permits, with notification to permit holders when time to re-issue for 2013
Completed
Analyse the data collected on the reasons given for making air travel and develop strategy to reduce travel in areas where there is best potential to utilise alternatives.
Reasons for travel analysed. Strategy for reducing air travel needs to be developed with senior support.
--Environmental Performance Review: 2012 26
9. Construction
As the University builds new facilities or renovates existing buildings it presents an opportunity to include environmental features into the design. The Campus Hub project is the major construction work currently taking place on campus.
Sustainability has been central to the design and build of the project to ensure the building is energy efficient, uses sustainable materials, minimises water use etc. There are always many smaller renovation projects that take place around the University. Generally these projects also incorporate sustainable design, but there are still improvements that can be made to ensure that sustainability is
systematically included in all construction projects and that Project Managers receive appropriate training.
Target Achievement
Provide ESD training for all Campus Services Project Managers
Partially achieved. Project Managers have attended GreenStar training, but no in-house training has followed. Awaiting compilation of all campus design
standards
Action Completion
Deliver an in-house ESD training session for all Campus Services Project Managers to gain input into the revised Environmentally
Sustainable Design Guidelines and up-skill the Project Managers.
Not Completed
Gain endorsement for revised Environmentally Sustainable Design Guidelines and incorporate them into the Campus Services Project Framework.
N/A. ESD Guidelines now part of project to consolidate all design
--Environmental Performance Review: 2012 27
10. Procurement
As part of the University’s broader responsibility, Victoria should be working with key suppliers to encourage sustainable business practices. The goods and services they supply have an environmental impact; will in use at the University, but also before and after. In 2012, there was only minimal action in this area; most of the planned initiatives have been rescheduled for 2013.
Target Achievement
To review at least 3 key suppliers for information on their environmental practices and how they support our environmental objectives.
Not achieved.
Action Completion
Endeavour to gain environmental representation on the University Tender Panel.
Completed.
Work with the key suppliers (with high environmental impact and University expenditure) to improve environmental reporting and performance.
Not completed –
Environmental Performance Review: 2012 28
11. Water
In recent years, the University has made significant reductions in water consumption on campus – a 34% reduction over 3 years. The main cause has been the repair of leaks in underground reticulation and improving plumbing in bathrooms. In 2011, the rate of water reduction flattened off, which suggested that the easy
opportunities for water savings have been exhausted, however considerable reductions (12.2%) were again achieved in 2012 without any proactive initiatives.
Target Achievement
Maintain water consumption at the same level as 2011
Achieved (and exceeded). Water consumption reduced by 12.2%.
Action Completion
Continue programme of annual exterior leak detection across all campuses
Not completed. Leak detection survey deferred due to budget
constraints.
When replacing tap ware and cisterns, install water efficient products and reducing valves.
Completed on an ongoing
Environmental Performance Review: 2012 29
12. Biodiversity
Victoria is spread across four campuses of Wellington’s urban landscape, and has very little land held in natural or rural environments. However, we still have an important role to play in protecting and enhancing the biodiversity found within our landscape, as our habitats inter-connect with surrounding ecosystems via ecological corridors. A scholarship has been established to fund a Masters project to create a biodiversity plan for the University campuses. The successful student will start in 2013, after applications have closed. Good progress continues on the restoration of the Mount St Cemetery, which is a valuable natural space adjoining the Kelburn campus. The community garden on University land in Aro St is also progressing well with the addition of another site (also on University land) further up the street.
Target Achievement
To commence work on the development of the Biodiversity Plan
Achieved. Master Scholarship established and undergrad students have
commenced work on inventory of campus biodiversity.
Action Completion
Progress the development of a
Biodiversity Plan through a multi-year student research project through the School of Biological Sciences
Completed with Masters project to continue through
to 2014
Continue the development of the Community Garden
Completed on an ongoing
Environmental Performance Review: 2012 30
13. Environmental Compliance
University’s discharges to air and water are consistently well below Council environmental regulations. Due to budget constraints, the voluntary audit of
emissions was not completed in 2012. There have been no significant changes to the University’s operations, so there is no reason to suspect that any environmental breaches are occurring. All trade waste consents have been granted and are up to date.
Target Achievement
To continue to maintain environmental
compliance Achieved
Action Completion
Manage process of obtaining trade waste consents from Council and complying with any regulatory requirements.
Completed
Conduct the annual Environmental Compliance Audit. Not completed. Compliance audit deferred due to budget constraints. NB: Discharges are historically well below consented levels and compliance audit is only voluntary.