Advance Artificial Neural Network Classification
Techniques Using EHG for Detecting Preterm Births
Ibrahim Olatunji Idowu, Paul Fergus, Abir Hussain, Chelsea Dobbins, Haya Al-Askar School of Computing and Mathematical Sciences,
Liverpool John Moores University Byrom Street, L3 3AF, UK.
[email protected], [email protected], P.Fergus, A.Hussain, C.M.Dobbins{@ljmu.ac.uk}
Abstract — Worldwide the rate of preterm birth is increasing, which presents significant health, developmental and economic problems. Current methods for predicting preterm births at an early stage are inadequate. Yet, there has been increasing evidence that the analysis of uterine electrical signals, from the abdominal surface, could provide an independent and easy way to diagnose true labour and predict preterm delivery. This analysis provides a heavy focus on the use of advanced machine learning techniques and Electrohysterography (EHG) signal processing. Most EHG studies have focused on true labour detection, in the window of around seven days before labour. However, this paper focuses on using such EHG signals to detect preterm births. In achieving this, the study uses an open dataset containing 262 records for women who delivered at term and 38 who delivered prematurely. The synthetic minority oversampling technique is utilized to overcome the issue with imbalanced datasets to produce a dataset containing 262 term records and 262 preterm records. Six different artificial neural networks were used to detect term and preterm records. The results show that the best performing classifier was the LMNC with 96% sensitivity, 92% specificity, 95% AUC and 6% mean error.
Keywords — Electrohysterography(EHG); Preterm Delivery; Term Delivery, Classification, artificial neural networks, AUC, ROC and Features extraction
I. INTRODUCTION
Premature birth is a global health issue that continues to be a major problem in obstetrical practice. In England and Wales, seven percent of babies are born prematurely and in 2009, it cost the UK National Health Service close to £2.95 billion per year. In 1994 in the United States, it was estimated that $820 million was spent, per annum, on hospital treatment for women suspected of having preterm labour and $360 million on women who actually went on to deliver during their stay [2].
Premature labour occurs when a woman starts to experience continuous contractions that tighten the uterus muscles causing the cervix to open earlier than normal. According to the World Health Organisation (WHO), preterm birth is the delivery of a baby before 37 weeks of gestation, while term birth refers to the delivery of a baby between 37 and 42 weeks of normal gestation [1].
Researcher has shown that roughly one-third of pregnancies are medically indicated or encouraged to bring forward the delivery for the best interest of the mother or baby. Another one-third occurs because the membranes rupture, prior to labour (PPROM). Lastly, spontaneous contractions (termed preterm labour or PTL) can develop, which results in preterm
delivery. Further studies, such as [5] and [6], show other risk factors that can cause preterm delivery, including any invasive procedure or surgery, underweight or obese mother, ethnicity, social deprivation, long working hours/late night, alcohol and drug use, and folic acid deficiency. This can then lead to cervical and uterine abnormalities, recurrent antepartum haemorrhage, illnesses and infections.. However, there is still a great deal of ambiguity about the level of danger that each factor possesses.
Efforts have been made to mitigate the effects of preterm births. Predicting preterm birth and diagnosing preterm labour before it occurs is generating a lot of interest because of its potential to enhance prevention. Perhaps one of the most interesting approaches in the prediction of preterm deliveries is the use of advanced machine learning algorithms and Electrohysterography (EHG) signal processing. This approach has seen some interesting results that suggest it may be an interesting line of enquiry to pursue. EHG is used to measure electrical activity in the uterus, while machine learning algorithms are trained to distinguish between term and preterm EHG records through the detection of patterns in data, while managing variance between subjects [3], [4].
This paper focuses on using advanced artificial neural network classification techniques, using EHG signals, to detect the onset of preterm births. Various machine learning classifiers are compared using an open dataset containing 300 records on pregnant subjects. The dataset contains 262 records for women who delivered at term and 38 who delivered prematurely [7]. Using signal processing and oversampling techniques, pre-selected features have been extracted from raw EHG signals that are suited to classifying term and preterm records. The results from our experiment, indicates that the selected classifiers in this paper outperform a number of approaches used in other studies.
The structure of our paper is as follows. Section II discusses related studies in this field. Section III describes the experimental methodology. Section IV presents the results and Section V discusses the results before the paper is concluded in Section VI.
II. RELATED STUDIES
Artificial Neural Networks (ANN) have been used effectively in research to classify term and preterm delivery records [11], [12]. For example, Alaskar et al. [13] proposed a
neural network that builds on the back-propagation network, called the self-organized layer inspired by immune algorithm (SONIA), to classify both term and preterm labour using EHG signals. The algorithm improves recognition and generalization in the back-propagation learning algorithm and has produced an accuracy of 70.82% compared with other similar classification techniques. Baghamoradi et al. [14] used the TPEHG database in [7] to compare sample entropy with thirty cepstral coefficients extracted and three respectively from each signal recording using sequential forward selection and Fisher’s discriminant. A multi-layer perceptron (MLP) neural network classified the feature vectors into term and preterm records. The results show that the three cepstral coefficients produced the best classification results with 72.73% (±13.5). Using all thirty coefficients produced an overall accuracy of 53.11% (±10.5). The sample entropy performed the worst with an accuracy of 51.67% (±14.6).
The k-NN algorithm has been used by Diab et al. [15] with an emphasis on Autoregressive (AR) modelling and wavelet transformation pre-processing techniques. The study focused on classifying contractions into three types using data obtained from 16 women. Group 1 (G1), were women who had their contractions recorded at 29 weeks, and then delivered at 33 weeks; Group 2 (G2) were also recorded at 29 weeks, but delivered at 31 weeks, and Group 3 (G3) were recorded at 27 weeks and delivered at 31 weeks. Classification occurred against G1 and G2 and against G2 and G3 using, the k-NN algorithm combined with the pre-processing method of AR. As well as this, an Unsupervised Statistical Classification Method (USCM), combined with the pre-processing method of Wavelet Transformation, was also used. The USCM adopted the Fisher Test and k-Means methods. The wavelet transformation, combined with USCM, provided a classification error of 9.5%, when discerning G1 against G2, and 13.8% when classifying G2 against G3. Using AR, k-NN provided a classification error of 2.4% for G1 against G2 and 8.3% for G2 against G3. In both classifications, the AR and k-NN methods performed better than the USCM. Furthermore, the classification accuracy for G1 and G2 was always lower than the equivalent G2 and G3 classifications. This suggests that it is easier to distinguish between pregnancies recorded at different stages of gestation than it is to distinguish between the time of delivery.
Support Vector Machines (SVM) have also been successfully used to classify term and preterm deliveries [16]. This classifier classifies contractions as either labour or non-labour, using different locations on the abdomen. Majority voting (WMV) decision fusion rules, including a Gaussian radial basis function (RBF), form the basis for classification. The feature vectors include the power of the EHG signal, and the median frequency. The support vector machine shows some promising results. For example, in [17], for a single SVM classifier, at one particular location on the abdomen, the result shows a 78.4% accuracy – the overall classification accuracy, for the combined SVM, was 88.4%. Finding the coefficients,
for the decision boundary, occurs by solving a quadratic optimization problem.
III. METHODOLOGY
For term deliveries, true labour only starts within 24 hours. However, for preterm deliveries, it may start within 7 to 10 days. The change in EHG activity, from non-labour to labour, is dramatic; throughout the rest of pregnancy, any change in EHG is more gradual. Therefore, it is expected that a raw dataset of EHG signals requires efficient pre-processing [3].
Study [18] illustrates how EHG signals can be pre-processed through different frequency related parameters. The study uses different linear and non-linear signal preprocessing techniques, via three different channels, to discern term and preterm deliveries. The pre-processing technique, used in [18], passed the EHG signal through a Butterworth filter configured to filter 0.8-4 Hz, 0.3-4 Hz, and 0.3-3Hz frequencies. However, [19] found that uterine electrical activity occurred within 1Hz and that the maternal heart-rate (ECG) was always higher than 1Hz. Furthermore, 95% of the patients measured had respiration rates of 0.33 Hz or less. Hence, this research considered that a 0.34-1 Hz bandpass filter removed most of these effects and also movement artifacts. In this paper the raw TPEHG signals were passed through the same Butterworth filter to focus on data between 0.34 and 1Hz.
A. Raw Data Collection
This paper uses the same dataset as [4] and [7] to generate the four features (root mean square, median frequency, peak frequency and sample entropy)used in the experiment. The raw uterine EHG signal has been extracted from Physionet [20], using the WFDB tool. The retrieved EHG signals were recorded using four bipolar electrodes adhered to the abdominal surface and spaced at a horizontal, vertical, distance of 2.5cm to 7cm apart. The total number of records in the EHG dataset is 300 - 38 preterm records and 262 term records. Each of the records were either recorded early, <26 weeks (at around 23 weeks of gestation) or later, =>26 weeks (at around 31 weeks). Within the 300 record dataset, three signals have been obtained simultaneously, ‘per record’. This has been achieved by recording through three different channels.
B. Signal Processing/ Feature Extraction
Table 1 below, shows the details for the TPEGH dataset, used in this paper. Each record in the dataset is approximately 30 minutes long, with a sample frequency of 20Hz, and a 16-bit resolution, with an amplitude range ± 2.5mV. The signals were filtered using an analogue three-pole Butterworth filter to obtain the 0.34 to 1Hz band, which contains most of the EHG information [19]. After filtering the dataset, both linear and nonlinear features are extracted to produce our feature set. These include root mean square, median frequency, peak frequency and sample entropy.
Recording Time Number of Recordings Time of Recordings Deliveries Recording Weeks Early Term 143 22.7 39.7 Term Later 119 30.8 39.6 Total Term Recording 262 Early Preterm 19 23.0 34.2 Later Preterm 19 30.2 34.7
Total Preterm Records 38
Total Number of Records 300
C. Oversampling of EHG Signals
The TPEHG dataset is unbalanced (262 term and 38 preterm), which has a significant impact on machine learning algorithms as classifiers are more prone to detect the majority class. Therefore, given that there are more term records, the probability of detecting a preterm record is low. To address this issue the minority class (preterm) is oversampled using the Synthetic Minority Over-Sampling Technique (SMOTE). The technique is effective in solving class skew problems [21]. SMOTE is used to generate 262 preterm records, using the 38 records that are already available. The oversampling results will then be compared with the results from the original data (262 term and 38 preterm).
D. Validation Method Used in Experiment
Several validation techniques are considered in this paper to determine the overall accuracy of each of the classifiers used in the experiments.
1) Holdout Cross-validation technique: This technique divides the dataset into two sets where 80% is used for training and the remaining 20% for testing. In the experiments, 30 iterations are used to calculate the error rate for each of the classifiers.
2) K-fold Cross- validation techniques: This technique estimates the classifiers accuracy. In the experiments, k-fold validation is performed using 5 folds and 1 repetition for the mean errors to compare the true positive (sensitivity) and true negatives (specificity). In our experiment, sensitivity refers to be preterm while specificity refers to term.
3) Receiver Operatior Curve (ROC): This technique is used to provide a graphical representation of the analysis of the cut off values for each of the classifiers based on the sensitivity and specificity error rate.
4) Area Under the Curve (AUC): This technique provides an acceptable evaluation and metric performance for each of the classifiers considered in this paper.
IV. EXPERIMENTAL DESIGN
In this paper, six advanced artificial neural network classifiers have been evaluated. This includes the
back-propagation trained feed-forward neural network classifier (BPXNC), levenberg-marquardt trained feed-forward neural network classifier (LMNC), automatic neural network classifier (NEURC), radial basis function neural network classifier (RBNC), random neural network classifier (RNNC) and the perceptron linear classifier (PERLC) [22].
In the BPXNC, the network is trained to map a set of input data by iterative adjustment of the weights. The information from inputs is fed forward through the network to optimize the weights between neurons. Moreover, the optimization of the weights is made by backward propagation of the error during the training or learning stage. The BPXNC then reads the input and output values in the training dataset and changes the value of the weighted links to reduce the differentiation between the predicted and observed values. The error in prediction is reduced across several training cycles (epoch 50) until the network reaches the best level of classification accuracy while avoiding overfitting [23].
The levenberg-marquardt trained feed-forward neural network classifier (LMNC) is similar to the BPXNC. It has similar functionality, however, it is much more memory intensive. Furthermore, during the training stage, training is stopped when the performance on an artificially generated tuning set of 1000 samples per class is reached (based on k-nearest neighbour interpolation) and thereafter does not improve anymore [22].
An automatic neural network classifier (NEURC) has a single hidden layer. This classifier tries three random initializations, with fixed random seeds, and returns the best result according to the tuning set. This is done in order to obtain a reproducible result but is more computational demanding [22].
The radial basis function neural network classifier (RBNC) is mostly used in complicated pattern recognition and classification problems, such as biomedical datasets that are nonlinear. The classifier has one hidden layer with unit radial basis units. The mapping properties of the RBCN can be modified through the weights in the output layer.
The Random neural net classifier (RNNC) is a feed-forward neural net with one hidden layer of N sigmoid neurons. The input layer rescales the input features to unit variance; the hidden layer has normally distributed weights and biases with zero mean and standard deviation [22].
Linear perceptron linear classifiers (PERLC) are the simplest type of neural network classifier and are trained with a supervised training algorithm. This classifier assumes that the true classes of the training data are available and incorporated in the training process. The input weights in this classifier can be adjusted iteratively by the training algorithm so as to produce the correct class mapping for the output. However, the problem with this classifier is that it does not have a hidden layer therefore this leads to bias in result accuracy.
V. RESULTS
This section presents the classification results for term and preterm delivery records using the TPEHG dataset. The 0.34-1 Hz filter on Channel 3 is used with 80% holdout technique and k-fold cross-validation. The initial validation provides a base line for comparison against all subsequent evaluations in this section
A. Results for 0.34-1 Hz Filter on Channel 3
This evaluation uses the 0.34-1 Hz filtered signals on Channel 3 with six classifiers. The performance for each classifier is evaluated, using the sensitivity, specificity, mean error, standard deviation, and AUC values with 30 simulations and randomly selected training and test testing sets for each simulation.
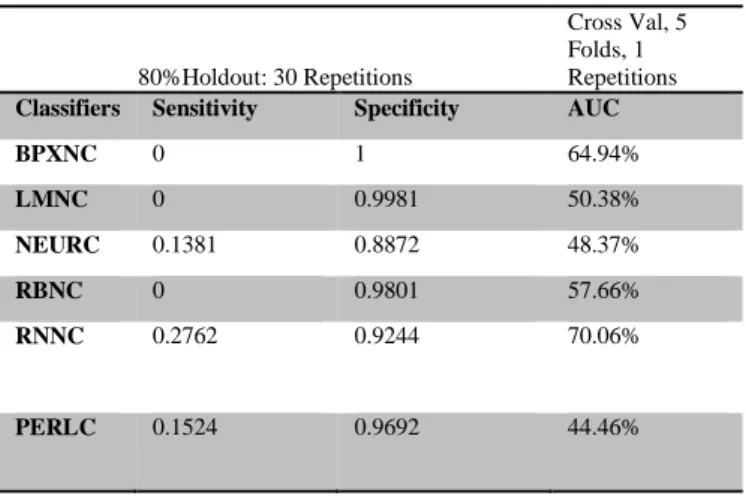
1) Classifier Performance: The first evaluation uses the original TPEHG dataset (38 preterm and 262 term). Table 2, illustrates the mean averages obtained over 30 simulations for the sensitivity, specificity, and AUC. As shown in Table 2, the sensitivities (preterm), in the initial test, are low for all classifiers. This was expected because there are a limited number of preterm records from which the classifiers can learn. Consequenlty, specificities are higher than sensitivities.
TABLE2:ORIGINALTPEHGSIGNAL(262TERMAND38PRETERM)
80%Holdout: 30 Repetitions
Cross Val, 5 Folds, 1 Repetitions
Classifiers Sensitivity Specificity AUC
BPXNC 0 1 64.94% LMNC 0 0.9981 50.38% NEURC 0.1381 0.8872 48.37% RBNC 0 0.9801 57.66% RNNC 0.2762 0.9244 70.06% PERLC 0.1524 0.9692 44.46%
Table 3 illustrates the results from a k-fold cross validation technique, used to improve the results obtained from the holdout method.
TABLE3: ORIGINALTPEHGSIGNAL(262TERMAND38PRETERM)
VALIDATION
80%Holdout: 30 Repetitions
Cross Val, 5 Folds, 1 Repetitions
Classifiers Filter Mean
Err Standard Deviation Mean Err BPXNC 0.1267 8.4690E-17 0.1300 LMNC 0.1283 0.0092 0.1567 NEURC 0.2077 0.0090 0.1767 RBNC 0.1440 0.0031 0.1633 RNNC 0.1577 4.7483E-04 0.1667 PERLC 0.1342 0.00486 0.2133
The k-fold cross-validation results, using five folds and both 1 and 30 repetitions show that the k-fold cross-validation improved the error rates, for some classifiers. However, these results are not considered statistically significant. Furthermore, the lowest error rates could not be improved below the minimum error rate expected, which is 12.67% (38 preterm /300 deliveries).
2) Model Selection: The receiver operator characteristic (ROC) curve shows the cutoff values for the false negatives and false positive rates. It has been used for each of the classifiers, using the TPEHG dataset 0.34-1 Hz filter. Figure 1 indicates that, none of the classifiers performed particulary well. The AUC values in Table 2 support these findings with very low accuracy values
Fig1. Received Operator Curve for 0.34-1Hz Signal Original TPEHG Dataset
The poor results indicate that the classification algorithms do not have enough preterm records to learn from, in comparison to term records.
B. Resulst for 0.34-1 Hz TPEHG filter on Channel 3 – Oversampled using SMOTE
The 38 preterm records have been re-sampled using the SMOTE technique. The SMOTE algorithm allows a new dataset to be generated that contains an even split between term and preterm records (262 each), which have been oversampled using the original preterm records.
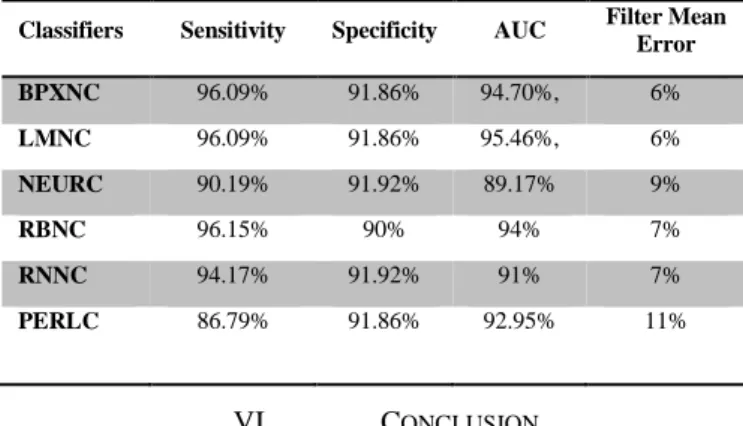
1) Classifier Performance: Table 4 indicates that the sensitivities, for all of the algorithms, has improved significantly, while specificities decreased slightly. In addition, the AUC results also show a significant improvement for all of the classifers. In particluar, the LMNC has dramatically improved with a value of 95.46%.
TABLE4:SMOTETPEHGSIGNAL(262TERMAND262PRETERM)
80%Holdout: 30 Repetitions Cross Val, 5 Folds, 1 Repetitions Classifiers Channel 3 0.34-1HZ Sensitivity Channel 3 0.34-1HZ Specificity Channel 3 0.34-1HZ AUC
BPXNC 0.960897435 0.918589743 94.70% LMNC 0.960897435 0.918589743 95.46% NEURC 0.901923076 0.919230769 89.17% RBNC 0.961538461 0.900000000 94% RNNC 0.941666666 0.919230769 91% PERLC 0.867948717 0.918589743 92.95%
Table 5 shows that the mean error rates, produced by all of the classifiers, are lower than the cross-validation mean errors and significantly lower than expected error rate, which is 262/524, i.e. 50 %.
TABLE5:SMOTE TPEHG SIGNAL (TERM AND PRETERM) CROSS
VALIDATION RESULT FOR FILTER 0.34-1HZ
80%Holdout: 30 Repetitions Cross Val, 5 Folds, 1 Repetitions Classifiers Channel 3 0.34-1HZ Filter Mean Err Channel 3 0.34-1HZ Standard Deviation Channel 3 0.34-1HZ Mean Err BPXNC 0.060215963 0.014024028 0.084130019 LMNC 0.060215963 0.014024028 0.101338432 NEURC 0.089439623 0.015789619 0.1510516252 RBNC 0.069171937 0.010512986 0.086042065 RNNC 0.069529832 0.012271863 0.099426386 PERLC 0.106779183 0.005229640 0.196940726
2) Model Selection: Again, the ROC curve shows the cutoff values for the false negative and false positive rates. Figure 2 shows a significant improvement. The results present a strong case for oversampling and indicate that better predictive models are possible for predicting term and preterm records.
Fig2: Received Operator Curve for Oversampled 0.34-1Hz Signal TPEHG
Dataset
In summary, the results are better than [4], [12] and [13]. As it can be seen from Table 6, the LMNC, BPXNC and the RBNC have produced the best AUC, Sensitivity, and Specificity values, with low filter mean error rates.
TABLE6:SUMMARY PERFORMANCE OF THE CLASSIFERS
Classifiers Sensitivity Specificity AUC Filter Mean Error
BPXNC 96.09% 91.86% 94.70%, 6% LMNC 96.09% 91.86% 95.46%, 6% NEURC 90.19% 91.92% 89.17% 9% RBNC 96.15% 90% 94% 7% RNNC 94.17% 91.92% 91% 7% PERLC 86.79% 91.86% 92.95% 11% VI. CONCLUSION
The development of medical information systems has played an important role in the biomedical domain. This has led to the extensive use of Artificial Intelligence (AI) techniques for extracting biological patterns in data. Furthermore, data pre-processing and validating techniques can also be used to analyze biological datasets for classification problems. In this paper, six classifiers have been used to classify term and preterm records from the TPEHG dataset, filtered between 0.34 and 1 Hz. The results show that the best performing classifier was the LMNC with 96% sensitivity, 92% specificity, 95% AUC and 6% mean error. These results are encouraging and suggest that the approach posited in this paper is a line of enquiry worth pursuing.
Perhaps one negative aspect of the work is the need to utilize oversampling to increase the number of preterm samples. A better way would be to balance the dataset using actual recordings obtained from pregnant women who delivered prematurely. This will be the focus of future research, alongside a more extensive investigation into different machine learning algorithms and techniques.
REFERENCES
[1] WHO, “Born Too Soon: The Global Action Report on Preterm Birth,” Geneva, 2012.
[2] W. K. Nicholson, K. D. Frick, and N. R. Powe, “Economic burden of hospitalizations for preterm labor in the United States.,” Obstet. Gynecol., vol. 96, no. 1, pp. 95–101, Jul. 2000.
[3] J. D. Iams, “Prediction and early detection of preterm labor.,” Obstet. Gynecol., vol. 101, no. 2, pp. 402–12, Feb. 2003.
[4] P. Fergus, P. Cheung, A. Hussain, D. Al-Jumeily, C. Dobbins, and S. Iram, “Prediction of Preterm Deliveries from EHG Signals Using Machine Learning.,” PLoS One, vol. 8, no. 10, p. e77154, Jan. 2013.
[5] R. Rattihalli, L. Smith, and D. Field, “Prevention of preterm births: are we looking in the wrong place?
The case for primary prevention.,” Arch. Dis. Child. Fetal Neonatal Ed., vol. 97, no. 3, pp. F160–1, May 2012.
[6] P. Steer, “The epidemiology of preterm labour.,”
BJOG, vol. 112 Suppl , no. March, pp. 1–3, Mar. 2005.
[7] G. Fele-Zorz, G. Kavsek, Z. Novak-Antolic, and F. Jager, “A comparison of various linear and non-linear signal processing techniques to separate uterine EMG records of term and pre-term delivery groups.,” Med. Biol. Eng. Comput., vol. 46, no. 9, pp. 911–22, Sep. 2008.
[8] W. Liu and E. Y. Wu, “Comparison of non-linear mixture models: sub-pixel classification,” Remote Sens. Environ., vol. 94, no. 2, pp. 145–154, Jan. 2005. [9] H. E. Recent, R. Of, and I. In, “Pattern Classification
Using Neural Networks,” no. November, 1989. [10] H. M. Rai, A. Trivedi, and S. Shukla, “ECG signal
processing for abnormalities detection using multi-resolution wavelet transform and Artificial Neural Network classifier,” Measurement, vol. 46, no. 9, pp. 3238–3246, Nov. 2013.
[11] W. L. Maner and R. E. Garfield, “Identification of human term and preterm labor using artificial neural networks on uterine electromyography data.,” Ann. Biomed. Eng., vol. 35, no. 3, pp. 465–73, Mar. 2007. [12] “Physiological time-series analysis using approximate
entropy and sample entropy,” Am. J. Physiol. Hear. Circ. Physiol., vol. 278, no. 6, pp. H2039–49, 2000. [13] H. Al-Askar, L. Moores, and B. Street, “The
Application of Self-Organised Network Inspired by Immune Algorithm for Prediction of Preterm Deliveries from EHG Signals,” cms.livjm.ac.uk, 2013. [14] H. A. S. Mohammad-Sina Baghamoradi , Mohsen
Naji, “Evaluation of cepstral analysis of EHG signals to prediction of preterm labor,” in 18th Iranian Conference on Biomedical Engineering, 2011, pp. 14– 16.
[15] B. Moslem, B. Karlsson, M. O. Diab, M. Khalil, and C. Marque, “Classification performance of the frequency-related parameters derived from uterine EMG signals.,” Conf. Proc. IEEE Eng. Med. Biol. Soc., vol. 2011, pp. 3371–4, Jan. 2011.
[16] M. C. Moslem B, Khalil M, Diab MO, Chkeir A, “A Multisensor Data Fusion Approach for Improving the Classification Accuracy of Uterine EMG Signal,” 18th IEEE Int. Conf. Electron. Circuits Syst., vol. 1, no. 1, pp. 93–96, 2011.
[17] M. C. Moslem B, Khalil M, Diab MO, Chkeir A, “A Multisensor Data Fusion Approach for Improving the Classification Accuracy of Uterine EMG Signal,” 18th IEEE Int. Conf. Electron. Circuits Syst., vol. 1, no. 1, pp. 93–96, 2011.
[18] G. J. Leman H, Marque C, “Use of the electrohyster- ogram signal for characterization of contractions during pregnancy,” IEEE Trans Biomed Eng, vol. 46, no. 10, pp. 1222–1229, 1999.
[19] W. Maner, “Predicting term and preterm delivery with transabdominal uterine electromyography,” Obstet. Gynecol., vol. 101, no. 6, pp. 1254–1260, Jun. 2003. [20] PhysioNet, “The Term -Preterm EHG Database
(TPEHG- DB),” physionet.org, 2012. [Online]. Available:
http://www.physionet.org/physiobank/database/tpehgd b. [Accessed: 03-Jun-2013].
[21] J. Richman and J. Moorman, “Physiological time-series analysis using approximate entropy and sample entropy,” Am. J. Physiol. …, vol. 278, no. 6, pp. H2039–49, 2000.
[22] 37steps, “Pattern Recognition Tools,” Version 5, 2013. .
[23] A. Ghaffari, H. Abdollahi, M. R. Khoshayand, I. S. Bozchalooi, A. Dadgar, and M. Rafiee-Tehrani, “Performance comparison of neural network training algorithms in modeling of bimodal drug delivery.,”
Int. J. Pharm., vol. 327, no. 1–2, pp. 126–38, Dec. 2006.
[24] L. M. Taft, R. S. Evans, C. R. Shyu, M. J. Egger, N. Chawla, J. A. Mitchell, S. N. Thornton, B. Bray, and M. Varner, “Countering imbalanced datasets to improve adverse drug event predictive models in labor and delivery.,” J. Biomed. Inform., vol. 42, no. 2, pp. 356–64, Apr. 2009.