Working paper
Are Health Problems Systemic?
Politics of Access and Choice
under Beveridge and Bismarck Systems
Zeynep Or (Irdes)
Chantal Cases (Irdes)
Melanie Lisac (Bertelsmann Stiftung)
Karsten Vrangbæk (University of Copenhagen)
Ulrika Winblad (Uppsala University)
Gwyn Bevan (London School of Economics)
September 2009
DT n° 27
www.irdes.fr • Tél: 01 53 93 43 02 • Fax: 01 53 93 43 07 • E-mail: [email protected]
l Director of publication: Chantal Cases l Scientific adviser: Thierry Debrand
l Copy editing: Franck-Séverin Clérembault - Anne Evans l Layout compositor: Khadidja Ben Larbi
l Distribution: Suzanne Chriqui, Sandrine Bequignon
Are Health Problems Systemic?
Politics of Access and Choice under Beveridge and Bismarck Systems
Zeynep Or∗,a , Chantal Casesa, Melanie Lisacb,Karsten Vrangbækc, Ulrika Winbladd, Gwyn Bevane
Abstract
Industrialised countries face similar challenges for improving the performance of their health system. Nevertheless the nature and intensity of the reforms required are largely determined by each country’s basic social security model. This paper looks at the main differences in performance of five countries and reviews their recent reform experience, focusing on three questions: Are there systematic differences in performance of Beveridge and Bismarck-type systems? What are the key parameters of health care system which underlie these differences? Have recent reforms been effective?
Our results do not suggest that one system-type performs consistently better than the other. In part, this may be explained by the heterogeneity in organisational design and governance both within and across these systems. Insufficient attention to those structural differences may explain the limited success of a number of recent reforms.
Keywords: Health system, Beveridge, Bismarck, reforms, performance
JEL Classification: I18, 057.
Résumé
Pour améliorer la performance de leur système de santé, les pays industrialisés relèvent des défis assez semblables. Néanmoins, la nature et l'intensité des réformes exigées sont en grande partie déterminées par le modèle de protection sociale mis en œuvre dans chaque pays. Examinant les principales différences de cette performance dans cinq pays, cet article compare leur expérience récente de réforme à partir de trois questions majeures : Y a-t-il des différences systématiques de performance entre les systèmes de type beveridgien et bismarckien ? Quels sont les principaux paramètres du système de soins à l’origine de ces différences ? Les réformes récentes ont-elles été efficaces ?
Nos résultats ne suggèrent pas qu'un système-type est invariablement meilleur qu’un autre. L'hétérogénéité de la conception organisationnelle et de la gouvernance tant à l’intérieur qu’à travers ces systèmes explique en partie leurs écarts. Une attention insuffisante à ces différences structurelles peut expliciter le succès limité d'un certain nombre de réformes récentes.
Mots-clefs : Systèmes de santé, Beveridge, Bismarck, réformes, performance
∗
Corresponding author: Zeynep Or, IRDES, 10 rue Vauvenargues, 75018 Paris, France. Tel: +33 1 5393 4341; Email: [email protected].
a
Institute for Research and Information in Health Economics, Paris, France.
b
Bertelsmann Stiftung, Guetersloh, Germany.
c
Department of Political Science, University of Copenhagen, Denmark.
d
Department of Public Health and Caring Sciences, Uppsala University, Sweden.
e
1. Introduction
Finding the right balance between cost containment, promoting choice and quality, and preserving or enhancing equity of access to care has been one of the major drivers of health reforms in most European countries. While the objective of universal coverage has been attained in most countries, this has not always been sufficient to ensure equity of access by need and not by ability to pay, or an equitable distribution of supply. At the same time there has been increasing political pressure to re-organise delivery in order to improve the quality of publicly financed health care, particularly by reducing waiting times and giving more choice to patients. However, the nature and intensity of these problems seem to be largely determined by the basic social security model financing each country’s health care system.
On the one hand, it is often said that Beveridge-type, tax-based National Health Systems ensure more equitable access, as they are universal in coverage and tend to minimise the problems of risk selection and cost shifting by health care providers and insurers. While these systems also appear to perform well in containing overall healthcare costs, they have traditionally performed less well in terms of offering choice for users and generating improvements in capacity (waiting times). Thus the major emphasis of reforms in countries with these systems, such as the UK, has been to increase choice and reduce waiting times.
On the other hand, one of the hallmarks of Bismarck-type, insurance-based, systems is the plurality of providers and abundance of choice. However, the major challenge for these systems is cost containment. As a result, there has been a noticeable increase in the level of government control and regulation, which may be constraining choice and/or access. For example, both France and Germany are trying to control the “choice” of providers by introducing “soft” (i.e. optional) gatekeeping arrangements.
These trends could suggest that a process of convergence in health care systems is taking place and the difference between Beveridge and Bismarck is no longer as significant. At the same time, there may be other key contextual parameters of the health system which need to be taken into account in addressing the specific problems in each country, such as payments to physicians for public and private patients. It could be argued that these reforms have mainly involved adjustments at the margin and the more fundamental parameters which distinguish each system remain largely intact.
Therefore, this paper focuses on three questions: Are there really systematic differences in performance of Beveridge and Bismarck-type systems? What are the key parameters, beyond the financing base of health care system which underlie these differences? Have recent reforms adequately addressed the observed weaknesses of each system and so eroded key differences between them?
The paper starts off, in Section 2, with an overview of differences in performance of selected Beveridge and Bismarck systems (Denmark, England, France, Germany, and Sweden). Section 3 identifies each system’s key structural parameters which may explain these differences using a common framework to describe different working practices, values and capacity underlying each system. Section 4 reviews a number of recent reforms addressing performance problems, and common to each system, with the aim of identifying organisational and political requirements for these reforms to be successful.
2.
Comparison of health system performance in five countries
The principal objectives of the health care system in all countries are to maximise health outcomes, quality of care, ease and equity of access, while at the same time containing costs. The overall performance of a health system can be measured by the extent to which these objectives are being met. Within this very broad framework, the performance of two Bismarck (Germany, France) and three Beveridge-type (Denmark, Sweden, England) systems is assessed in this section.
Performance assessment of health care systems is a complex task which needs to take into account a large number of parameters simultaneously. Extensive work has been carried out on developing an appropriate framework and methodology for cross-country performance assessment. Our aim here is not to provide a full performance assessment of each system but to review a limited set of comparable data to test the hypothesis that there are systematic differences between Bismarck and Beveridge-type systems with respect to different performance dimensions.
We select a number of different indicators for each dimension to cover different aspects of the health system and/or different segments of the population. The choice of indicators is also determined by the availability of comparable cross-country data, which is often problematic. We then calculate a score for each country and on each dimension based on their average performance rank on a scale of one to five.
Cost containment
As part of any assessment of the performance of the health care systems, it is important to evaluate not just how each system performs in terms of health outcomes, but also how much each system costs. In Figure 1, we compare the cost of resources consumed by each health care system with three common indicators: total health care expenditure, public health expenditure and total pharmaceutical expenditure, all expressed as a percentage of GDP. Together, these three indicators give an idea about the opportunity cost of the resources used by the health sector within each country. The two Bismarck-type systems, France followed by Germany, have the highest total and public health care expenditure as percentage of GDP. They both devote about 11% of their GDP to the health sector. The share of public health expenditure in France is slightly higher than in Germany (9% against 8.2%). Of the three Beveridge-type systems, the United Kingdom has the lowest total and public health expenditure (about 8 and 7 per cent of GDP), but there is little differences between Denmark and
Sweden (about 9 and 8 per cent of GDP). In terms of pharmaceutical expenditures however, the differences are more marked. The share of pharmaceutical expenditure in GDP in France (1.8%) and Germany (1.6%) is more than twice as high as in Denmark (0.8%), which has the smallest share; Sweden (1.3%) and the UK (1.2%) are in the middle.
Figure 1. Total, public health and pharmaceutical expenditures in five countries, 2006
Total health expenditure
9.2 9.5 10.6 11.1 8.4 UK Sw eden Denm ark Germ any France % of GDP Expenditure on pharmaceuticals 1.2 0.8 1.6 1.8 1.3 UK Sw eden Denm ark Germ any France % of GDP
Public health expenditure
7.5 7.7 8.1 8.9 7.3 UK Sw eden Denm ark Germ any France % of GDP
Source: OECD Health data, 2008.
Health outcomes
Defining a single health outcome measure combining various aspects of health status and health is both challenging and problematic1. Here, we use three commonly used health outcome indicators to cover different situations: neonatal mortality, life expectancy at age 65, and five-year survival rates after breast/prostate cancer for women and men respectively. Neonatal mortality is largely used for benchmarking effectiveness of health care interventions during pregnancy and childbirth. Life expectancy at age 65 provides a widely established summary measure of the health status of the elderly population which is not always covered by other measures. Both of these indicators are also affected by life style and socio-economic factors which could be seen as outside the scope of health systems. Survival rate after cancer provides a more direct indicator of health system effectiveness (OECD, 2006). Life expectancy at age 65 goes from 20 years in France to 17 in Denmark (Figure 2). Sweden has the lowest neo-natal mortality rate and the UK the highest (1.8 and 3.5 per 1000 live births). Sweden also has the highest five-year survival rate for breast cancer, followed closely by France, and England the lowest (82, 80 and 70 per cent). Germany has the highest five-year survival rate for prostate cancer and Denmark the lowest (76.4 and 38.4 per cent). Hence, there is no clear-cut distinction in terms of these outcomes between Beveridge and Bismarck-type countries. France and Sweden consistently outperform the UK and Denmark while Germany is typically placed in between.
1
The technical and theoretical difficulties of producing such a measure are discussed widely around the WHO 2000 exercise of performance measurement. See for example, Smith (2002).
Figure 2. Health outcomes in five countries, 2006
Neonatal mortality
Deaths/1000 live b irths
3.5 3.2 1.8 2.6 2.5 UK Denm ark Sw eden Germ any France Life expentancy at 65 years 18.4 17.7 19.2 18.85 20.4 UK Denm ark Sw eden Germ any France
Breast cancer survival
5-year survival rate (%)
82 69.8 73.6 75.5 79.8 England Denm ark Sw eden Germ any France
Prostate cancer surv.
5-year survival rate (%)
66 50.9 38.4 76.4 73.7 England Denm ark Sw eden Germ any France
Source: OECD Health data, 2008, relative survival rates from Eurocare-3, aged standardised, diagnosed between 1990-94 followed up until 2000.
Responsiveness
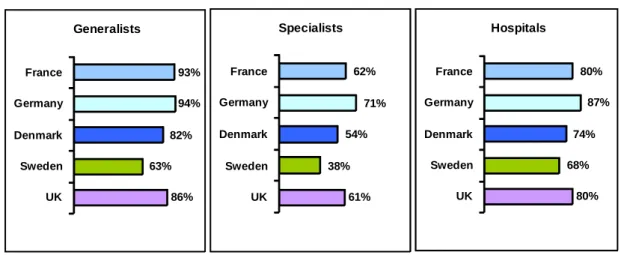
Increasingly, attention is not just being paid to improving health outcomes but also the responsiveness of health care provided (OECD, 2006). This is often assessed in terms of patient’s experience with health care. Figure 3 provides the results from a recent European survey on quality of care (Eurobarometer, 2007). The question is asked on the quality of three types of care: hospital, generalist and medical, and surgical specialists2.
The percentage of people reporting that quality of GP and specialist care is fairly or very good is the highest in France, followed by Germany and Denmark closely. The picture is somewhat different for hospital care: the percentage of people reporting that quality is good is the highest in Sweden, followed by Denmark, while France is in the middle just above Germany and the UK. Clearly, people’s assessment of quality depends on a mixture of things including their expectations, hence making cross-country comparisons difficult.
2
QA3.1 to 4. “Can you please tell me if you think that the quality of each of the following is very good, fairly good, fairly bad or very bad?”
Figure 3. Responsiveness: satisfaction with the care provided
(% of persons reporting that the quality of the following are fairly or very good)
77% 90% 85% 79% 83% UK Sweden Denmark Germany France Hospitals 87% 68% 91% 88% 93% UK Sweden Denmark Germany France Generalists 71% 71% 75% 77% 87% UK Sweden Denmark Germany France Specialists Source: Euro-barometer, 2007. Access to care
Ensuring that all segments of the population can obtain health care at the right time and place is also being seen as an important objective. Figure 4 gives the percentage of people reporting that access is fairly easy or very easy for each type of care. Sweden performs particularly poorly on this measure with one third of the population reporting that access to generalists is difficult and with this proportion rising to two thirds for specialist care. Germany, on the other hand, performs significantly better in terms of access to all three types of care. Surprisingly however, the percentage of people reporting that access is difficult to hospitals and specialists is very similar in France and in the UK. It is possible that people’s expectations differ from country to country, which might explain some of these results. Nevertheless, the limited survey data available from France supports the fact that access to certain types of specialist care, outside of the Parisian region, could be quite difficult because of the unequal distribution of specialists (ESPS, 2004).
Figure 4. Access to care: persons reporting that it is fairly or very easy to gain access
80% 68% 74% 87% 80% UK Sweden Denmark Germany France Hospitals 86% 63% 82% 94% 93% UK Sweden Denmark Germany France Generalists 61% 38% 54% 71% 62% UK Sweden Denmark Germany France Specialists Source: Euro-barometer, 2007.
In order to obtain more objective information on the problems of access in these systems, we tried to gather information on waiting times for primary/secondary care in each country. However, it is very difficult to compare these data as the way the information is collected differs significantly between countries. The perceived wisdom is that long waiting times are a problem of Beveridge-type systems. The fact that France and Germany do not collect any data on waiting times is sometimes used to argue that this is not a problem in these counties (Scilliani and Hurst, 2003). However, at least in France, there are some indications that access to elective surgery in some regions could be a problem for those who are not willing to pay the extra fees asked by private providers. Moreover, data suggests that the size of the problem varies between the three countries with Beveridge-type systems.
Table 1 presents the available information on access to primary or specialist care in five countries. The data for England and Germany refer to out patient visits while those for Sweden and France refer to GP appointments only. In England data correspond to effective lengths of wait collected from receipts of GPs’ requests to first outpatient appointment while in other countries it comes from specific surveys. In Denmark the question asked is on the ability to get quick help from a GP, rather than the waiting time involved. Bearing in mind these caveats, the percentage of people obtaining an appointment within the same day is quite similar in France and Sweden. The information is not available on the urgency of the problem treated, but in France for example, only 14 % of those who waited more than 48 hours for a GP visit wanted to have an earlier appointment while one over three person wanted to have an earlier appointment for a specialist visit for which average waiting time is estimated to be over four weeks (ESPS 2004, IRDES). These data also need to be interpreted cautiously given that there may be systematic cross-country differences in the way individuals report on access to care.
Table 1. Waiting times for outpatient visits
1. Survey. Research Unit for General Practice. Århus University. 2006. 2. IRDES, Health, health care and insurance survey, 2004. 3. Compendium of Health Statistics, 2008. 4. Zok (2007), concerns SHI-insured individuals seeking an appointment for an acute condition. 5. Sjukvårdsdata i Fokus, SKL
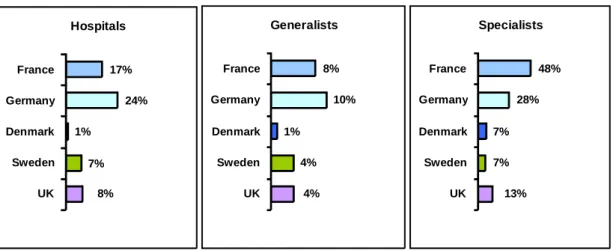
Affordability
Ideally one’s access to care should be determined by need and not by his/her socio-economic status or availability of health services (objective of equity). One criterion to judge how fairly health care is distributed will be its financial burden for users. Eurobarometer survey provides some information on people’s perception on affordability. Given the co-payment arrangements often differ between primary and secondary care services, the question is asked separately for hospital, GP and specialist services. Figure 5 presents the percentage of the population reporting that these services are not affordable.
Figure 5. Affordability of health care: percentage of persons reporting the following are not very or not at all affordable
8% 7% 1% 24% 17% UK Sweden Denmark Germany France Hospitals 4% 4% 1% 10% 8% UK Sweden Denmark Germany France Generalists 13% 7% 7% 28% 48% UK Sweden Denmark Germany France Specialists Source: Euro-barometer, 2007 %
Denmark1 Ability to get quick help from GP in acute
conditions. Acceptable to excellent: 66
Ability to contact clinic by phone. Acceptable to
excellent 71
% of patients getting an appointment with a GP
within the same day 65
% of patients getting an appointment with a GP
within 48 hours 80
% of patients wishing an earlier appointment with
an out-patient specialist 32
England3 % of patients with referrals seen within 4 weeks
for outpatient appointment 40
% of patients with referrals who waited more than
8 weeks for outpatient appointment 30
Germany4 % of patients getting an outpatientappointment
within the same day 32
% of patients who waited more than 2 weeks for
out-patient appointment 25
% of patients getting an appointment with a GP
within the same day 64
% of patients getting an appointment with a GP
within the week 87
Sweden5 France2
In the two Bismarck-type systems, the percentage of the population reporting that care is not affordable is significantly higher than in the Beveridge ones. In particular, one out of four people in Germany report that hospital care is not affordable, while one out of two thinks specialist care is not affordable in France. In marked contrast, only 1% of the population in Denmark reports that hospital and/or generalist care is not affordable. It is interesting to note that around 13% of people in the UK report that specialist care is not affordable even though in principle it is free at the point of delivery. This probably reflects use of private specialists by some people for shorter waiting times and travel/time cost for others.
Affordability can also be compared on a more objective basis by looking at out-of-pocket expenditures (Figure 6). Despite Denmark’s well-rated access to GP and specialist care, it has the highest per capita out-of-pocket payments (after adjusting for differences in the cost of living). This is mainly due to copayments for pharmaceuticals (despite exemptions) and for dentistry, physiotherapy etc.
Figure 6. Out-of-pocket payments per capita, 2006
/capita, US$ PPP 129 430 381 201 145 UK Sw eden Denm ark Germ any France
Source: OECD Health Data 2008. Authors’ estimations for the UK based on data from the OHE and the OECD.
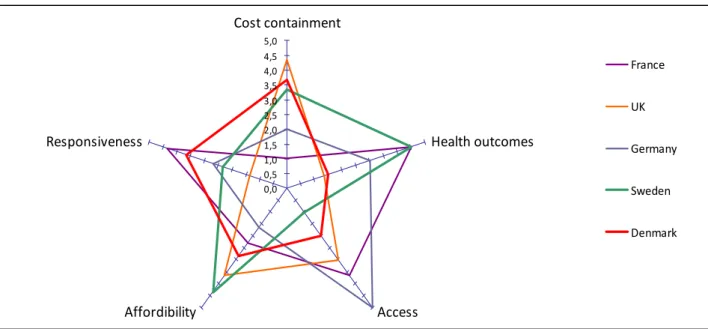
Putting the performance pieces together
In order to provide a more synthetic picture of how countries vary across the dimensions presented here, we have constructed a simple score for each country on each of the five performance dimensions taking their average ranks on a scale of one to five for each sub-indicator. Figure 7 presents the positioning of countries on the different dimensions. We calculated the country ranks in a way that for each dimension (on the axes) the better performers get higher points, the highest point (best performance) being 5. For example, concerning cost containment the UK has the highest score (best performer) and France has the worst, given their average ranking on the three indicators presented above (total, public health and pharmaceutical expenditures).
These comparisons illustrate systemic differences on three dimensions: the Beveridge-type systems appears to perform better on cost containment and affordability; and Bismarck-type systems appears to perform better on access to care (defined as availability of services when required). There appears, however, to be no clear systemic differences in performance on health outcomes and responsiveness:
Sweden and France consistently perform better than the others on health outcomes; and France and Denmark on responsiveness.
Figure 7. Health system performance: comparison of five countries
Click here to download a printable version of figure 7 (version imprimable de la figure 7 en téléchargeant ce lien) http://www.irdes.fr/EspaceAnglais/Publications/WorkingPapers/DT27Figure7.pdf
3. Comparison of structural parameters
The previous section has highlighted a number of similarities but also significant differences within Bismarck and Beveridge systems in health performance which need to be explained. There may be other aspects of health system which need to be examined simultaneously for understanding these differences in performance and for developing appropriate policy responses. Therefore, this section proposes a comparison of the main structural parameters of Beveridge and Bismarck systems which can differ substantially in their organisational design in carrying out their functions which are likely to affect both their performance and resource use.
In order to conceptualise the design and structure of each country’s health system, we distinguish four broad features: the governance of the system, its underlying values, financial incentives for the providers and consumers, and the capacity of the system. In reality, each of these would consist of further layers of parameters. For example, the system governance, among other things, refers to the degree of decentralisation in decision-making which could be different for hospital and ambulatory sector in one system.
We would also suggest that these key features are not independent of each other (Figure 8). For example, both “governance” structure and the way doctors are paid may influence capacity (in terms of doctor supply), but available capacity may also have an influence on how payment mechanisms are adjusted. This has implications on cost, quality and equity of health care as well as for health reform. For instance, copying a reform implemented in one country may not work in another country if other
0,0 0,5 1,0 1,5 2,0 2,5 3,0 3,5 4,0 4,5 5,0 Cost containment Health outcomes Access Affordibility Responsiveness France UK Germany Sweden Denmark
systemic differences exist between the two countries and may only become effective when combined, in a certain way, with other (structural) reforms of the system.
Figure 8. The structural features of health care system
For each of the health system features, we provide below a brief review of the situation in each country in our study. Table 2 provides a summary of country-specific parameters.
A. Values
The fundamental principles of Bismarck-type health systems could be summarised as plurality, solidarity and freedom. Both in France and Germany the contributions are mainly based on the ability to pay3. France has achieved universal coverage in 2000 with the introduction of free insurance (CMU) for the poorest part of the population. Germany introduced mandatory universal health insurance in 2007.
In both countries ambulatory care delivery is based on historical principles of private practice: patients are free to choose their physicians and, in contrast to Beveridge-type systems, general practitioners do not have a formal gatekeeping role. In France, freedom of installation for generalists and specialists and the freedom of prescription are also seen as basic rights by the physicians. The only regulatory mechanism for controlling supply is the yearly quotas for limiting the number of medical students. This explains the very unequal distribution of doctors across regions which became a serious subject of concern for policy. In Germany however physicians’ settlement is regulated by the regional physician associations jointly with the regional sickness funds. In order to ensure equal distribution of physicians across regions, the Federal Joint Committee (GBA, which consists of representatives of the sickness
3
However, privately insured persons in Germany (around 10% of the population) pay according to sex, age and health status.
Values
Capacity
Governance
Performance
Financial
incentives
funds, physicians, hospitals and patients) determines physician/inhabitant ratios that are mandatory at the regional level.
The fundamental principle in Beveridge-type health care systems, on the other hand, is its universal coverage; all citizens have a fundamental right to health care irrespectively of their financial contribution to the system. In all three countries health care systems are based upon underlying values such as equity and solidarity. In Denmark and England, health care is free for all residents with few exceptions but out-of-pocket payments in Denmark are almost three times higher than in England. While patients in Sweden pay a small patient fee per visit, these payments are well regulated to control out-of-pocket expenditures (see Table 2). Yet, in all three countries the increase of supplementary health care insurances with a spread of private hospitals and clinics in the past decade might lead to an erosion of the equity principle and instead lead to greater emphasis on values such as patient choice and access. The growth in private insurance in Denmark is driven by tax exemptions and waiting times, although waiting time guarantees have gradually reduced this problem. In England traditionally, private insurance for elective hospital care is also a perk of executive remuneration and had the benefit of enabling those who were insured to have operations much more quickly than through the NHS. However, dramatic reductions in waiting times for elective care in the NHS4 between 2001 and 2008 are seen as one explanation for the fall in private spending on elective surgery such as knee and hips by about 10% in 2007 (Trigg, 2008).
B. Governance
In broad terms governance of systems health care concerns all the actions and means (policies, customs, laws and institutions) which affect the way health care is provided. Governance thus can be situated at different levels (corporate, financial and clinical). Providing a complete analysis of the governance structures and various initiatives for improving clinical governance is beyond the scope of this paper. Here we just aim to point out some major country differences in corporate governance structures.
Gatekeeping, for example, is one basic parameter which differs across the systems studied here and affects significantly the way health care is provided. In Denmark, England and Sweden, health care has been organised around general practitioners being gatekeepers for the system. Gatekeeping is considered as a mechanism of cost containment, in part because of the evidence that specialists induce demand for costly and sometimes unnecessary procedures, but also because it equates with an established primary care system where emphasis is both on prevention and treatment. In contrast, in France and Germany, general practitioners work as “independent providers” with no particular responsibility for assuring coordination between outpatient and inpatient care and across different sectors. Therefore, in these countries there have been continuing struggles to promote integrated care for patients.
Another distinguishing feature of Beveridge-type systems, in terms of governance, is that they are integrated. That means that both the provision and the financing of health care services are handled within one organizational system. Before 1991, the English NHS had a hierarchical integrated model, in which the same organisations were responsible for meeting the needs of their populations and for running providers. Such organisations can either be funded equitably for their populations or for the performance of providers, but not both. Hence, the attraction of the model of an internal market with a purchaser-provider split, in which purchasers are funded for their populations and contract with independent providers. England has tried four variations of this model in its efforts to improve provider performance: competition in the first internal market from 1991 to 1997; partnership in a “third way” between 1997 and 2000; publishing performance in “star ratings” between 2001 and 2005; and again an internal market from 2006 (Bevan and Robinson, 2005). In contrast, the governments in Scotland, in 2003, and Wales, in 2008, have decided to abandon the purchaser-provider split and revert to an integrated hierarchical organisation (NHS Scotland, 2003; Welsh Assembly Government, 2008).
A further issue is the presence or absence of central government in decisions of total funding of health care. Cost control might be easier when exercised by a central government. In the Beveridge countries discussed here, England has a model where the decision on total NHS spending is the prerogative of national government. Denmark has recently centralized decision-making regarding taxation. The expenditure level is still subject to negotiations between the national government and the regional authorities but the national government obviously has gained more direct control. In Sweden decisions on spending are ultimately made by regional authorities but, like in Denmark, subject to agreements and monitoring by the national government, which may withhold block grants. In France and Germany, national governments have limited say in decisions on expenditure by the insurers.
A common characteristic for the Danish and the Swedish health care systems is their long tradition of local self-government, where regional units are responsible for the provision of health services and the national government has mainly the role of regulator and supervisor. In both Denmark and Sweden, regional units are elected political bodies. The Swedish county councils also hold a strong position by their right to levy proportional income taxes from their population, whereas taxation for health care was centralized to the state level in the 2007 structural reform in Denmark. The UK government essentially determines spending on the NHS of the four countries, but following devolution in 1998, each country (England, Northern Ireland, Wales and Scotland) is free on setting their priorities and governing styles albeit with the same set of values.
Public/private mix
Despite being both social insurance based, the role and functioning of insurance funds differ significantly between France and Germany. In Germany there are two parallel insurance systems: Social health insurance (SHI), covering about 88% of the total population5, and private health insurance, covering about 10% of the population. There are about 210 private, non-profit SHI and 52 private for-profit health insurers in Germany, while in France three public insurance schemes cover 95% of the population.
Both in France and in Germany health care provision relies heavily on private providers. In ambulatory sector, physicians work in private, and in general as solo practice. Inpatient care is delivered both by public and private non-profit and for profit hospitals. Patients choose their hospital freely between public and private providers. Private for-profit hospitals represent about one third of all beds in both countries, and they are specialised in particular in elective surgery (in France they represent two thirds of all stays for surgery). In Germany, the majority of private for-profit hospitals are part of the state hospital plans and therefore underlie the same regulations concerning access and payment. In France the private providers are allowed to charge extra fees to patients but the reimbursement is based on fixed tariffs.
Beveridge-type systems have traditionally been run by the public with few private providers (less than 1% of all beds in Denmark, England and Sweden, despite an increasing trend), although GPs are predominantly salaried in Sweden but not in Denmark and the UK (see below). In Denmark hospital care is mostly delivered by public hospitals owned and operated by the regions. In Sweden, in the whole health care sector, only about 15 percent of doctors and 10 percent of nurses work privately. But, there are vast local variations in this respect. In the Stockholm region almost one third of doctors work privately in comparison with the northern region where the same figure is only 6 percent. In England, there has been a recent emphasis on plurality of provision for publicly-financed care with the creation of foundation trusts, which enjoy greater autonomy from national government, and of private independent sector treatment centres to provide diagnostic and elective services, intended to create an independent sector market.
C. Capacity
Traditionally, there is a wide choice of health care providers in France and Germany, and the density of physicians and hospitals per capita remains comparatively high (see Table 3). Large variations are found across countries for ratios of acute hospital beds and generalists per 1000. Germany has by far the highest ratio of acute hospital beds per 1000 (6.2): this is twice that of Denmark, almost twice that of France and almost three times that of Sweden and England. France has by far the highest ratio number of generalists per 1000 (1.7): almost twice that of Germany and almost three times that of Denmark, Sweden and England. There is less variation in the ratios of specialists per 1000: Denmark
5
SHI covers all individuals with a yearly income up to 48,150 Euros (BMG, 2008). Individuals whose yearly income exceeds this income threshold three years in a row are allowed to opt out of SHI and buy full-coverage private
and Germany have the highest (2.4), France and England the lowest (1.7), with Sweden in the middle (1.9).
In Sweden, even if the national government has emphasized the importance of primary health care since the 1960s, the county councils have chosen to focus more heavily on hospital care. Today, the number of generalists per capita is one third of that in France and 20% less than in Denmark. The ratio between hospital doctors and GPs in Sweden is approximately 3:1 today leading to an over-representation of specialised hospital care, despite that the number hospital beds per capita is half of in Denmark for example (2.2 versus 3.1 per 1000 habitants).
Denmark England Sweden France Germany 1. Values 1.1. Basic principals Universality, equity Universality, equity Universality, equity Plurality, liberty, solidarity Plurality, liberty, solidarity 2. Governance
2.1. Resource allocation Decentralised Central Decentralised
Central, regional
deconcentration Regional level
2.2. Capacity planning
Primary care Regions Subregional Regions Individual National and
regional level
Hospital care Regions Subregional Regions Central State level
2.3. Public/private mix (% of private providers)
Primary care 100% .. 25% 100% 100% Hospital care 1% 1% 1% 33% 32% 3. Financial dis/incentives 3.1. Payment methods1 GP Capitation+ FFS Capitation+ performance Salary+ FFS FFS FFS
Specialist FFS Salary Salary FFS FFS
Hospital DRG +GB DRG DRG +GB DRG DRG
3.2. Cost sharing ( for a regular case)
Free at the point of delivery Yes Yes No No No
a. GP care at least
Differs betw een regions, minimum 11 €. 30% of negotiated tariff = 7€ + 1€ per 10 Euros per quarter maximum 95 € /year (for all services, GP, hospital, specialist) No limit 2% of gross household income (1% for chronically ill) b . Specialist care at least Differs bw regions, from 21€ to 32 € , on average 28€. Around 9€ to 18€ if has a referral, around 25€ otherw ise 10€ if outpatient specialist is first physician visited in that quarter
maximum 95 €/year No limit See above
c. Hospital care at least
Same as specialist
16€/day +20% of total cost for non-vital care
10€/day
maximum 95 €/year No limit 280 €/year
4. Capacity
4.1. Level of resources2
no of GP/1000 hab itant 0,8 0,7 0,6 1,7 1
Specialist/1000 hab . 2,3 1,7 1,9 1,7 2,4
Acute b eds/1000 hab . 3,1 2,2 2,2 3,8 6,2
4.2. Distribution (geographical)3
Specialists4 19,1 14,6 19,4 20 17,8
Hospital b eds 7,3 16,8 13,4 15,5 11,4
1. DRG = Activity based payment, GB = Global budget 2. Source: OECD Health data 2008.
4. Refers to total number of doctors for Denmark and England.
3. Coefficients of variation across regions/counties w ithin each country. The smaller the coefficient, the more equal is the distribution of specialists and beds.
In England, between 1997 and 2007, there were dramatic increases in staff working in the NHS: the numbers (full time equivalents) of general practitioners increased by 17%, and medical and dental staff in hospital and community health services rose by 53% (The Information Centre, 2008a; 2008b). Even after these dramatic increases, the ratios of specialists and general practitioners per capita are the lowest and second lowest of the five countries.
D. Financial incentives/ disincentives
In France, almost all the physicians in ambulatory care, as those working in for-profit hospitals, contract with health insurance and they are paid on a fee-for-service according to a negotiated schedule (sector 1). Some of the physicians are authorized by the health insurance funds to charge higher fees (called sector 2), but the reimbursement to patients by public health insurance is made on the basis of the negotiated fee for sector 1. There is no official limit on these fees charged by doctors in sector 2, and patients’ associations deplore increasingly high extra billings charged, particularly by surgeons. At present, 35% of specialists and 15% of generalists work in sector 2, but their distribution is very uneven. In some areas access to physicians, particularly specialists, who do not charge extra fees (sector 1) is quite limited.
In Germany as well, ambulatory care providers are reimbursed according to a fee-for-service system. Since they are mostly private for-profit providers, they have a legitimate interest in maximizing their own profits. However, income maximization is only possible to a certain extent because there are fixed budgets for general and specialist outpatient care. The attempt to introduce same type of spending constraints in France was declared anti-constitutional after long strikes and strong opposition by specialists (Or, 2002).
In Germany, social health insurance is based on the benefit-in-kind principle (ie. health care is free at the point of access for patients except for certain co-payments (see Table 2), providers are directly reimbursed by sickness funds. In France health insurance is organized according to the cost-reimbursement principle (ie. patients pay first and get reimbursed by their insurer), while this is usually only the case for privately insured in Germany. In France, the copayment rate varies for different health services and goods: about 20% for inpatient care, 30% for ambulatory care; between 35% and 65% for pharmaceuticals. About 85% of the population own a supplementary insurance which can cover these copayments, but the generosity of contracts varies widely. The poorest 7% of the population benefit from a free complementary insurance.
In Denmark and England, general practitioners and specialists run privately owned clinics, but receive most of their income through public reimbursement based on general agreements on fees and working conditions between the regions and the medical associations. All generalists are paid a combination of capitation and fee-for-service payments. In Sweden, since the county councils run most of the health care, almost all physicians and other staff categories are salaried employees.
The massive increase in NHS funding in the UK in 2000 was followed by new contracts for specialists and general practitioners. General practitioners can now withdraw from 24-hours responsibility for patient care and received massive increases in pay from an explicit set of incentives designed to pay for performance in achieving targets set in a Quality and Outcomes Framework (QOF). Both contracts have been criticised as they resulted in paying much more for working fewer hours: the average increases in pay for specialists and general practitioners who were partners were 27% and 58%, and the reduction in the average hours they worked per week were one and seven hours (Comptroller and Auditor General, 2007; 2008).
There is a small amount of cost-sharing in Sweden. Patients pay a fee at each visit in the form of a flat-rate payment with an annual cap of 95 € for the expenditure on all health services. The user fees differs between regions (see Table 2), but patients under 20 years old are mostly exempted.
Denmark, on the other hand, appears to have a surprisingly high level of out-of-pocket payments which is concentrated on dental services (for citizens above 18), physiotherapy, and pharmaceuticals. However, both in Denmark and in England, there are no copayments for primary medical care, hospital and community health services. Citizens may choose to pay out-of-pocket in order to gain quicker access to privately practicing specialists and private hospitals.
4.
Policy responses: Recent reform initiatives
Of course, these health system parameters that were identified in the previous section are not necessarily going to remain frozen in time and, indeed, have been changing, as reforms have been implemented to improve performance. In this section, we focus on two major recent reform initiatives which may be seen as transforming the fundamental parameters of Bismarck and Beveridge systems: the introduction of “soft” gatekeeping in France and Germany, and the attempts to introduce more (and private) choice by extending waiting time guarantees in Denmark and in Sweden and by increasing the range of providers in England. In particular, we examine whether there has been some convergence in health care systems as a result of these reforms.
Bismarck towards Beveridge? Gatekeeping comes to France and Germany
As expected from the performance rankings above, for both France and Germany the most important policy issues are the high levels of total health care expenditures and costs together with concerns over quality. Both in France and in Germany increasingly it has been admitted that lack of care coordination between providers and sectors is one of the major problems leading to inadequate use and supply of health services (over use of specialist and hospital services, duplicate treatments, wrong referrals...), high costs and possibly lower quality of care.
In this context, a non-mandatory (“soft”) gatekeeping scheme has been introduced in Germany since 2000 and in France since 2005, in order to reduce total healthcare cost and improve system efficiency and care quality. In contrast with the Beveridge countries where all the generalists work as gatekeepers to specialist and hospital care and all the patients need a referral for access to these services, the participation to gatekeeping scheme is voluntary both for patients and for providers in both countries.
In Germany, sickness funds and single providers can negotiate selective contracts with gatekeeping arrangements. All sickness funds are asked to set up gatekeeping programs in the next years. In France, the National Health Insurance Fund and the representative professional associations signed a national agreement introducing the regular physician scheme set out in the health care reform of 2004. Patients are asked to declare a “preferred doctor” (which could be a specialist). If patients avoid this “soft” gatekeeping, then they are penalized financially: the rate of reimbursement s/he is entitled to from the health insurance fund is reduced from 70% to 60%; and GPs and specialists in sector 1 are entitled to charge a supplemental fee, up to 17.5% of the official rate. These financial penalties apply if an individual chooses not to register with a preferred doctor, visits a GP other than his/her preferred doctor (except in an emergency) or if the patient consults a specialist without a referral. The overall reimbursement schemes are so complex that both health professionals and patients find it difficult to understand how/which scheme if reimbursement applies. This explains partly the high participation rate in France, compared with Germany, as most believe that they would not be reimbursed at all if they were not to use referral by GP. Another reason for low enrollment of patients in gatekeeping programs in Germany is that this only exempts them from a low ambulatory practice fee (10€ per calendar quarter), so the incentives for patients are relatively low.
In Germany, GPs receive a flat-rate premium for every patient that enrolls in their list. The amount of this payment differs between sickness funds. In France however, there is no specific payment for “preferred doctors”, hence no real contract is made with these doctors who are supposed to act now as gatekeepers. In Germany, gatekeeping contracts between sick funds and GPs can include such requirements as GPs participating in training courses (e.g. on patient-oriented communication), or using of evidence-based treatment guidelines. These contractual requirements vary between sickness funds. In France, generalists receive an extra payment (40€/year) for patients suffering from a list of "chronic and/or costly diseases" such as cancer, diabetes, severe high blood pressure, long term
psychiatric disease, etc. GPs are expected now to help their patients with the coordination of treatments and provide better quality care but they have no specific engagement to do this, and the payment mechanism (fee-for-service) remains the same.
Moreover, in order for GPs to be able to take on their role as gatekeepers, training and education need to be adapted to their new role. Currently, ambulatory GPs are in a rather weak position compared to specialists in both countries, despite some recent initiatives to promote general practice in medical schools. This is due to the fact that specialists have a dominant position in the majority of regional/national physician associations and have more influence in decision-making. New models of care that are promoted by the national government with the aim to strengthen general practice are thus not very popular. At the same time, at least in Germany, surveys show that patients and providers put a high value on free choice of doctors (Wasem, 1999).
Therefore both in France and in Germany the impact of this new gatekeeping scheme has been of little significance to date. The participation rates remain very low in Germany: out of 31 million individuals who have the option only 5.9 million actually enrolled with a GP (Redaktionsbüro Gesundheit, 2007). In France the majority of the population declared a “preferred doctor”, but there is little visible change in consumption patterns.
Beveridge towards Bismarck? Improving choice in Denmark, Sweden and England
Access has been the main problem in English, Swedish and Danish health care and the issue of long waiting times has dominated the health debate since the end of the 1980s. Since early 1990s, several attempts have been made to deal with this problem, with some mixed success. Patient choice was a major parameter of these reforms.
In Denmark, in 1993, free choice of hospital for patients was introduced so that, once referred by a GP, patients could choose among all public hospitals in Denmark, and some private non-profit hospitals with the same level of specialization (Strandberg-Larsen et al. 2007). However, patients’ choice was limited to the hospitals that had an agreement with the region. Denmark introduced, in 2002, further a waiting time guarantee, called “extended free choice”, that extended choice to a number of private facilities and facilities abroad for patients with expected waiting times of more than two months. This appears to have had a positive impact as the average time for most of the elective surgery has been declining since 2002: halving the time waited for cataract and orthopedic surgery between 2000 and 2006 (from about 30 to 15 weeks). The extended choice scheme is mostly used for eye surgery, orthopedic surgery, ear, nose and throat treatment and plastic surgery.
There has been limited utilization of both “free choice” and “extended free choice”, perhaps because of travel costs, limited information on quality matters, traditions, and patient preferences for treatment close to home (Vrangbæk et al. 2007). It does, however, seem to have improved productivity of local providers. In Denmark, in October 2007, the waiting time guarantee was further reduced to one month.
It seems that the improvement made in managing waiting times in Denmark was achieved through a combination of productivity gains and increased allocation of funds to health care.
In Sweden, the first waiting time guarantee was introduced in 1991, to assure medical care within three months for 12 procedures for which there were problems of long waiting times. The agreement guaranteed that patients who could not get these services in their own hospital within three months would be offered the same care at another public or private hospital at the expense of the home hospital. Around 500 million SEK (about USD 70 million) were allocated for this guarantee, which remained in force until end of 1996 by yearly agreements, but no additional funding was provided (Hanning and Lundstrom, 1998). This focused intervention to reduce waiting times has been effective in the short term; it helped to reduce backlogs and to improve management of waiting lists. Nevertheless, waiting times started to go up again after 1994. Moreover, giving priority to just 12 health conditions raised questions on the fairness and suitability of these areas as priority in the long term and the policy was abandoned in 1997 (Hanning and Winblad Spångberg, 2000).
In 2005, a new “national waiting time guarantee” was agreed between the Federation of County Councils and the Swedish government to guarantee the patient a contact with a health care centre within a day, an appointment with a GP within a week, an appointment with a hospital specialist within 90 days, and a maximum waiting time of 90 days between diagnosis and treatment. However, these guarantees are not linked to specific financial incentives, nor are there are formal sanctions for providers that fail to achieve them The only incentive is that a patient’s home-county, on the central level, has the responsibility to pay for the costs of treatment outside the county if they cannot fulfil the time limits set (Sveriges Kommuner och Landsting, 2005).
In addition to the waiting-time guarantee, several political initiatives have been taken to increase the patient choice in Sweden. For instance, a national policy was introduced in year 1989 and updated in year 2000 which gives patient the right to choose care-provider within primary care as well as specialist care in the whole country. In contrast to Denmark the patients’ right to choose is not legislated. Instead the Federation of County Councils and all counties made a voluntarily agreement to introduce the patient choice policy (Fredriksson and Winblad, 2008). Despite all these efforts waiting times remain to be a major problem in Sweden.
In England, greater choice of specialists and hospitals appears to be a key demand of patients. Compared to most other European countries, British people were among the most dissatisfied with their opportunities for making choice: only 30% said that these were ‘good’ or ‘very good’, compared to 73% in Spain and 70% in Switzerland (Coulter and Magee, 2003). Hospital market reforms have been phased into NHS from 2002-2006 under the flag of “patient choice”. The cornerstone of the reform is that all patients referred for specialist care will be able to choose between up to five public or private providers at the point of referral for elective care. There are four principal elements to these reforms: a national electronic booking system to offer patients a choice of 4-5 providers for first outpatient
appointment; increasing the range of providers available, with greater independence for NHS Trusts and use of the private sector (new independent sector treatment centers); a website providing information on available services and comments posted by users, supported by a system in which ‘money follows the patient’ (‘Payment by Results’). Recent evaluation of these policies found problems in implementation (Dixon et al., 2010) and no hard evidence of them having a beneficial impact yet (Bevan, 2008; Audit Commission and Healthcare Commission, 2008). On the specific policy of patient choice, the evaluation by the Audit Commission and Healthcare Commission (2008) found that patients all wanted access to a high quality local hospital, and that location and transport were the most important influences on choices in the current scheme. Difficulties have been identified with the impacts of patient choice on quality (Robertson and Torlby, 2007; Bevan, 2008), on social and geographical equity in access (Appleby, 2003), and the cash-limited budgets of local insurers (Bevan and Robinson, 2005). In addition, using the private sector for improving choice appears to have come at a cost. To encourage entry to the hospital market, the government offered quite generous contracts to private investors including revenue guarantees for five years, irrespective of activity volume, and payment above the national tariff (Audit Commission and Healthcare Commission, 2008: p.51).
5. Conclusions
A number of conclusions can be drawn from this comparison of Beveridge and Bismarck systems based on the experiences of five countries.
First, on the basis of a range of comparable data, we find that there are differences between Bismarck and Beveridge systems but only in certain respects. In terms of cost containment and affordability, Bismarck-type systems appear to be less successful than Beveridge-type systems. In contrast, Beveridge-type systems perform relatively poorly in terms of access, defined as availability of services when required. Yet it should be noted that this is based on surveys of patients’ own assessment. It has not been possible to find comparable measurements of waiting times. In other performance dimensions such as outcomes achieved and responsiveness we do not see any clear distinction between these systems.
Second, our analysis shows that a range of structural features of health systems needs to be taken into consideration when addressing performance deficiencies. Despite their common funding principles, organisational design and governance context can differ substantially within and across Beveridge and Bismarck-type systems. In particular, we compared four broad parameters: governance; each system’s underlying values; financial incentives for providers and consumers; and system capacity. Careful consideration of these in the implementation phase may help to improve the success of any reform attempt. For example, despite being both insurance-based, the structure and functioning of insurance funds differ significantly between France and Germany. The large number of sickness funds in Germany might partly explain low participation in its gatekeeping program compared with France where three public insurance schemes cover almost all of the population.
There are also significant differences between the taxed-based systems of Denmark, England and Sweden. For example, in Denmark the majority of physicians are paid a combination of per capita and fee-for service while in Sweden they are mostly salaried. England introduced pay-for-performance in the new GP contract. Our analysis suggests that these differences in parameters across countries are closely linked to the way health care is supplied and consumed and hence have a direct impact on the success of reforms introduced.
Third, when we look at some recent reforms, common to each system, there seem to be a lack of a holistic approach. The experience of Denmark and Sweden with waiting times guarantees is instructive. Despite both countries taking similar measures, more or less at the same time, in terms of introducing choice of providers and waiting time guarantees, the results obtained are quite different. Waiting times remain a major problem in Sweden, while in Denmark this now seems to be less of an issue. Our analysis in Section 3 suggests that differences between the two countries in terms of health care capacity and payment methods for doctors might explain these different outcomes. In particular, the experience of Sweden suggests that choice may have a limited impact on the productivity of health care providers when they are paid on a salary basis. Moreover, “choice” might become a chimera when there is no real effective choice because of constraints on supply. Attempts in England to tackle such constraints through pluralism and expansion in supply have, so far, proved to be expensive and disappointing.
In the case of France and Germany, both countries introduced a gatekeeping scheme, ostensibly to improve quality but also to constrain demand and healthcare spending. In both countries the measure has mainly consisted of directing patients (through financial incentives) to see a generalist first. However, this was not accompanied by any serious attempt to change working practices and the underlying values of a private medical practice operating on a fee-for-service basis. For example, in France, there has been no significant change in contractual arrangements with general practitioners to work as gatekeepers. Also, in order for general practitioners to act effectively as gatekeepers, specific training and education measures are required but have not been introduced.
Finally, the experience of the five countries reviewed in this paper suggests that taking a piecemeal approach to health reform is likely to be sub-optimal. While countries of the same type may share some common problems in terms of improving health care performance adopting a “copy-and-paste” approach to health care reforms without taking into account the specific structural features of each country is likely to be ineffective.
Acknowledgements
We would like to thank to the members of the European Health Policy Group for their constructive comments on previous version of this paper and, in particular, Carolyn Tuohy and Claus Wendt for their valuable input.
References
Appleby J., Harrison A., Devlin N. (2003). “What is the Real Cost of More Patient Choice?” London: King’s Fund. http://www.kingsfund.org.uk/publications/kings_fund_publications/what_is_the_real.html Audit Commission and Healthcare Commission (2008). “Is the treatment working?” London: Audit Commission. http://www.audit-commission.gov.uk/reports/NATIONAL-REPORT.asp
Bevan G. (2008) “Is choice working for patients in the English NHS?” BMJ; 337: a935.
Bevan G., Robinson R. (2005). “The interplay between economic and political logics: path dependency in health care in England”, J Health Politics Policy Law; 30: 53-78.
Comptroller and Auditor General. (2007). “Pay Modernisation: A new contract for NHS consultants in England”. [HC 335 2006-2007] London: The Stationery Office
<http://www.nao.org.uk/publications/nao_reports/06-07/0607335.pdf>
Comptroller and Auditor General. (2008). “NHS Pay Modernisation: New Contracts for General Practice Services in England”. [HC 307 Session 2007-2008] London: The Stationery Office
<http://www.nao.org.uk/publications/nao_reports/07-08/0708307.pdf>
Coulter A., Magee H. (2003). “The European Patient of the Future”. Maidenhead: Open University Press, 2003
Dixon A., Robertson R., Bal R. (2010). “The experience of implementing choice at point of referral: a comparison of the Netherlands and England”, Health Economics Policy and Law, forthcoming.
ESPS. (2004). « Enquête Santé et Protection sociale », IRDES.
http://www.irdes.fr/EspaceRecherche/Enquetes/ESPS/EnqueteESPS.html
Eurobarometer. (2007). Public Opinion in the European Union, November 2007. Report available on line: http://ec.europa.eu/public_opinion/archives/eb/eb67/eb67_en.pdf
Fredriksson M., Winblad U. (2008). “Consequences of a decentralized healthcare governance model: Measuring regional authority support for patient choice in Sweden”, Social Science and Medicine, 67: 271-279.
Hanning M., Lundström M. (1998). “Assessment of the waiting time guarantee for cataract surgery”, Int. Journal of Technology Assessment in Health Care, 14(1):180-193.
Hanning M., Winblad Spångberg U. (2000). “Maximum waiting time - a treat to clinical freedom? Implementation of a policy to reduce waiting times”, Health Policy, 52: 15-32.
NHS Scotland. (2003). Partnerships for Care. Scotland’s Health White Paper. Edinburgh: The Stationery Office <http://www.scotland.gov.uk/Resource/Doc/47032/0013897.pdf>
OECD (2006). Health care quality indicators project, conceptual framework paper, by Kelly E. and Hurst J., OECD Health Working Papers, no. 23, Paris
Or Z. (2002). From Measures to Action: Improving the Performance of Health Care Systems, A review of four countries”, OECD Labour Market and Social Policy Occasional Papers, No.57, 2002.
Redaktionsbüro Gesundheit (Ed.). (2007). Regionale Hausarztmodelle in Deutschland. Recherche des Redaktionsbüros Gesundheit bei den gesetzlichen Krankenkassen und Kassenärztlichen Vereinigungen. Stand: Dezember 2007.
www.uke.uni-hamburg.de/institute/allgemeinmedizin/downloads/institut-allgemeinmedizin/BMG-Uebersicht-HA-Modelle-Dland.pdf
Robertson R., Torlby R. (2007). Patient choice, King’s Fund Briefing, January 2008.
Scilliani L., Hurst J. (2003). Explaining Waiting Times Variations for Elective Surgery across OECD Countries, OECD Health Working Papers, no. 7, Paris.
Smith P.C. (2002). ‘Measuring health system performance’, European Journal of Health Economics, 3: 145-148.
Strandberg-Larsen M., Nielsen M.B., Vallgårda S., Krasnik A., Vrangbæk K., Mossialos E. (2007). Denmark: Health system review. Health Systems in Transition; 9(6): 1-164
Sveriges Kommuner och Landsting. Vårdgaranti – Fritt vårdval – Prioritering (2005).
http://www.skl.se/artikel.asp?A=16050&C=4049 Accessed at: 2008-04-08
Trigg, N. (2008) Private health market ‘shrinks’. <http://news.bbc.co.uk/1/hi/health/7699563.stm> The Information Centre (2008a). General and Personal Medical Services: England 1997-2007, http://www.ic.nhs.uk/webfiles/publications/nhsstaff2007/gp/GP%20Bulletin%201997-2007.pdf
The Information Centre (2008b). NHS Hospital and Community Health Services: Medical and Dental staff. England 1997-2007.
http://www.ic.nhs.uk/webfiles/publications/nhsstaff2007/med%20and%20den/Revised%20Medical%20 and%20Dental%20bull%2097-07.pdf
Vrangbæk K., Østergren K., Okkels B., Winblad U. (2007). ‘Patient reactions to hospital choice in Norway, Denmark and Sweden’, Health Economics Policy and Law, 2: 125–152.
Wasem J. (1999). Das Gesundheitswesen in Deutschland: Einstellungen und Erwartungen der Bevölkerung. Wissenschaftliche Analyse und Bewertung einer repräsentativen Bevölkerungsstudie. Eigenverlag Janssen-Cilag, Neuss.
Welsh Assembly Government. (2008). Proposals to Change the Structure of the NHS in Wales. Consultation Paper. Cardiff: Welsh Assembly Government.
http://www.wlga.gov.uk/english/library/nhs-structure-consulation-document/>.
Zok K. (2007). Warten auf den Arzttermin: Ergebnisse einer Repräsentativumfrage unter GKV- und PKV-Versicherten, WIdO-monitor; 4(1): 1-7.