ISSN: 1693-6930, accredited First Grade by Kemenristekdikti, Decree No: 21/E/KPT/2018
DOI: 10.12928/TELKOMNIKA.v18i2.14818 822
HAR-MI method for multi-class imbalanced datasets
H. Hartono1, Yeni Risyani2, Erianto Ongko3, Dahlan Abdullah41Department of Computer Science, STMIK IBBI, Indonesia 1Department of Computer Science, Universitas Potensi Utama, Indonesia
2Department of Information Systems, STMIK IBBI, Indonesia 3Department of Informatics, Akademi Teknologi Industri Immanuel, Indonesia
4Department of Informatics, Universitas Malikussaleh, Indonesia
Article Info ABSTRACT
Article history: Received Jul 11, 2019 Revised Jan 19, 2020 Accepted Feb 21, 2020
Research on multi-class imbalance from a number of researchers faces obstacles in the form of poor data diversity and a large number of classifiers. The Hybrid Approach Redefinition-Multiclass Imbalance (HAR-MI) method is a Hybrid Ensembles method which is the development of the Hybrid Approach Redefinion (HAR) method. This study has compared the results obtained with the Dynamic Ensemble Selection-Multiclass Imbalance (DES-MI) method in handling multiclass imbalance. In the HAR-MI Method, the preprocessing stage was carried out using the random balance ensembles method and dynamic ensemble selection to produce a candidate ensemble and the processing stages was carried out using different contribution sampling and dynamic ensemble selection to produce a candidate ensemble. This research has been conducted by using multi-class imbalance datasets sourced from the KEEL Repository. The results show that the HAR-MI method can overcome multi-class imbalance with better data diversity, smaller number of classifiers, and better classifier performance compared to a DES-MI method. These results were tested with a Wilcoxon signed-rank statistical test which showed that the superiority of the HAR-MI method with respect to DES-MI method.
Keywords: Classifier Data diversity
Hybrid approach redefinition-multiclass imbalance
Multi-class imbalance
This is an open access article under the CC BY-SA license.
Corresponding Author: Erianto Ongko,
Department of Informatics,
Akademi Teknologi Industri Immanuel, Medan, Indonesia. Email: [email protected]
1. INTRODUCTION
Class imbalance occurs if a class or several classes become underrepresented so it is also called a minority class because it has instances that are much smaller than other classes [1]. In machine learning research, class imbalance problems are the main challenges that attract the attention of a number of researchers [2]. Research on this issue is included in the 20 main research topics that are the most interesting in machine learning, especially big data. Minority Class is also called a positive class because it is a class with interesting patterns to observe. For comparison, the detection of breast cancer sufferers is often a class with a small number of instances, if the classification process for detection of breast cancer sufferers experiences class imbalance problems then there is a possibility that detection of patients is not obtained even though the sufferer class is very interesting to obtain [3].
There are a number of methods that have been proposed to deal with class imbalance problems such as resampling, cost sensitive, ensemble learning, kernel-based methods, and active learning methods [4]. Multi-class imbalance problems are far more complicated to handle than two-class imbalances.
The multi-class imbalance condition will be more difficult if the desired results are as accurate as possible in accordance with the existing problem. On the other hand, applying the method proposed to handle two-class imbalance problems to handle multi-class imbalance problems does not get the desired results [5]. In general, the algorithm for handling multi-class imbalance is to develop an algorithm used for handling binary class Imbalance through the decomposition method [6]. Another common method is to adopt an ensemble-based approach for use in handling multi-class imbalances [4] and another way is to adapt the intrigue process by building decision trees [7]. A relatively easy way to do is to view multi-class imbalance as a subset of binary problems [8, 9].
The multi-class imbalance problems that will be solved are problems such as many minority-one majority, one minority-many majority, and many minority-many majority [10]. In [1] suggested that to overcome the problem of imbalance class there are 2 (two) things that need to be considered, namely those related to the number of classifiers and diversity (diversity) of data. In [11] propose the Dynamic Classifier Selection (DCS) method for dealing with multi-class imbalance problems, but it has the disadvantage of being a large number of classifiers. In [12] suggested the Dynamic Ensemble Selection (DES)-MI method which gives better results compared to the Dynamic Classifier Selection (DCS) method. The DES-MI method found has a small classifier, but in research conducted by [13] has identified that diversity data obtained by DES-MI is not good enough. The Hybrid Approach Redefinition (HAR) method which is a Hybrid Ensembles approach can overcome the problem of class imbalance with a small number of classifiers and good data diversity, on two-class imbalance problems [14, 15].
This research will optimize the HAR method so that it can be used to overcome multi-class imbalance problems. In the optimization process the preprocessing stages were carried out using the random balance ensemble method proposed by [16] and dynamic ensemble selection so that a candidate ensemble on multiclass problems and processing stages was carried out using different contribution sampling proposed by [17] and dynamic ensemble selection. This research will be conducted using multi-class imbalanced datasets sourced from the KEEL Repository [18]. The results of the study are the Hybrid Approach Redefinition-Multiclass Imbalance (HAR-MI) method that is expected to overcome multi-class imbalance with better data diversity, smaller number of classifiers, and better classifier performance compared to a DES-MI Method.
2. RESEARCH METHOD
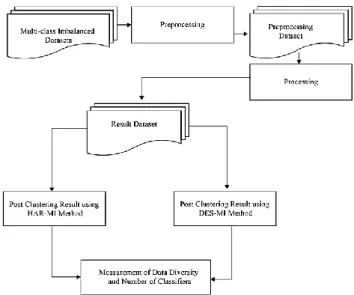
This research will produce the HAR-MI method to overcome multi-class imbalance problems. HAR Method will be carried out an optimization process with HAR-MI method so that it can handle multi-class imbalance problems by adding capabilities from HAR method to determine candidate ensembles by using dynamic ensemble selection on minority classes and majority classes so that they can recognize each subset of minority and majority classes based on 2-Dimensional Datasets proposed by Sáez et al. [10]. The results of HAR-MI method are expected to obtain better data diversity and also a small number of classifiers. The stages of research conducted by researchers from this study can be seen in Figure 1.
In Figure 1, it can be seen that the process that occurs in the dataset selection and preparation stage is determined by the imbalance dataset with varying imbalance ratio. The next process is preprocessing. The process of handling the multi-class imbalance will begin with the preprocessing stage. The purpose of this preprocessing stage is to reduce the number of classifiers. Where the preprocessing stage will be done using the Random Balance Ensemble method and Dynamic Ensemble Selection. The Random Balance Ensemble Method will use Random under Sampling and SMOTEBoost. The results of the preprocessing stage are in the form of a preprocessing dataset which will then proceed to the processing stage. Implementation and validation of the performance of each experiment was carried out using 10-fold cross-validation and compared with the DES-MI method which is very good in dealing with multi-class imbalance problems.
2.1. Preprocessing and processing stage in HAR-MI method
The preprocessing stage was carried out using the Random Balance Ensembles Method and Dynamic Ensemble Selection.The pseudocode of this stage is as follows.
Require: Set S of examples(x1,y1)
Ensure: New set S’ of examples with Random Balance and Dynamic Ensemble Selection 1: totalSize←|S|
2: Determine k as the number of Nearest Neighbor 3: For All Samples in S do
4: Determine the Borderline of Positive or Minority Class as EO𝐶𝑡+
5: Determine the Borderline of Negative or Majority Class as EO𝐶𝑡−
6: End For
7: For All Samples in EO𝐶𝑡+ do
8: Calculate the cn(e)i as neigborhood value for each sample
9: Order Ascending the sample according to the cn(e)i 10: End For
11: Building a candidate ensemble for Safe, Borderline, Rare, dan Outlier according to k value 12: Take a candidate ensemble of Safe, Borderline, Rare, dan Outlier to SP
13: For All Samples in EO𝐶𝑡− do
14: Take a candidate ensemble to SN 15: End For
16: Add Instance from with S|yi=+1 to SP 17: Add Instance from with S|yi=-1 to SN
18: Calculate the size of Majority Class from SN
19: Calculate the size of Majority Class from SP
20: newMajoritySize←Random integer between 2 and totalSize-2 21: newMinoritySize←totalSize – newMajoritySize 8: if newMajoritySize 22: if newMajoritySize <majoritySize then
23: S’ ← SP
24: S’will fill with a random instance from SN
25: Create newMinoritySize – minoritySize artificial 26: else
27: S’← SN
28: S’will fill with a random instance from SP
29: create newMajoritySize – majoritySize artificial 30: end if
31: return S’
Based on the pseudocode above, it can be seen that in the preprocessing stage was carried out using Random Under Sampling and SMOTEBoost. In the Random Under Sampling process the Dynamic Ensemble Selection process will take the form of borderline determination for minority and majority class. Then for samples that are in the borderline minority class EO𝐶𝑡+, the neighborhood value calculation process
cn (e) will be performed, then it will be sorted ascending to determine the candidate ensemble for Safe, Borderline, Rare, and Outlier, then the candidate ensemble will be included in the SP. Next for the sample that is in the borderline the major class will be entered into SN.
After that, the process will continue with the Random Balance Ensemble Method, which will be based on the results of the Dynamic Ensemble Selection. The process starts with the determination of Majority and Minority Size. Then based on the determination of the size, an imbalance class will be handled.
If the size of the new Majority Class is greater than the new Majority Class, this means that the Minority Class is larger than the Majority Class and part of the Minority Class instance will be taken to move to the Majority Class and vice versa. Determination of the sample will be done by Random Under Sampling and the determination of the instance that will be transferred will be done with SMOTEBoost. The Processing stages was carried out using the Different Contribution Sampling and Dynamic Ensemble Selection. The pseudocode of this stage is as follows.
1: Input: S: Training Set; T: Number of Iterations; n: Bootstrap Size; k: neighbors
2: Output: Bagged Classifier: H (x) =sign (∑𝑇𝑡=1ℎ𝑡(𝑥)) where ht [-1, 1] are the induced classifiers
3: Process:
4: For All Samples in S do
5: Determine the Borderline of Positive or Minority Class as EO𝐶𝑡+
6: Determine the Borderline of Negative or Majority Class as EO𝐶𝑡−
7: End For
8: For All Samples in EO𝐶𝑡+ do
9: Calculate the cn(e)i as neigborhood value for each sample
10: Order Ascending the sample according to the cn(e)i 11: End For
12: Building a candidate ensemble for Safe, Borderline, Rare, dan Outlier according to k value 13: Take a candidate ensemble of Safe, Borderline, Rare, dan Outlier to SP
14: For All Samples in EO𝐶𝑡− do
15: Take a candidate ensemble to SN 16: End For
17: for i = 1 to Number of Instance in Preprocessed Dataset do 18: Add Preprocessed Dataset to Si
19 B-SVM will do for classifying Si 20: Determine the Majority Class 21: Determine the Minority Class 22: For All Instance in Majority Class do
23: NewSVSets[] will form by checking and delete the noise in SV Sets 24: NewNSVSets[]will form by multiple RUS
25: end while
26: For All instance from new SV Sets and NSV do 27: Create an instance for Majority Class 28: End For
29: For All Instance in Minority Class do
30: SMOTEBoost Process for SV Sets and create SMOTESets 31: end while
32: For All SMOTESets and NewNSVSets do 33: New PositiveSampleSets
34: End For
35: For All NewNegativeSampleSets and NewPositiveSampleSets do 36: ResultDataSet
37: End For 38: End For
After the preprocessing dataset is generated, the Dynamic Ensemble Selection process will occur at the initial stage for borderline determination of minority and majority class. Then the next step will be the Differential Contribution Sampling process where both majority classes and minority classes will be divided into SV Sets and NSV Sets. NSV Sets in the Negative Sample will undergo a Multiple RUS process, while SV Sets in the Positive Sample will experience a SMOTEBoost.
2.2. Data diversity
In the ensemble learning process, in reality if there is a classifier that can guarantee that there is no misclassification, an ensemble process is not needed on the classifier. The ensemble process in the classifier occurs in the hope that better results can be obtained. Assuming that if there is a misclassification of the classifier in a part it can be covered by merging with other classifiers that also misclassification in other parts [19].
According to Díez-Pastor, Rodríguez, García-Osorio, and Kuncheva [16] it is important to pay attention to the diversity of data in handling imbalance classes. This means that attempted misclassification produced by each classifier is as small as possible and if there is misclassification it is expected to occur on different objects or parts [20]. Suppose that Z= {𝑧1, . . . , 𝑧𝑛} which is a dataset that is in the decision region
ℜ𝑛, so that 𝑧
𝑗∈ ℜ𝑛 it is an instance involved in the classification problem. Then the output of the classifier
𝐷𝑖 as a classifier paired comparison matrix (relationship pairwise classifier) can be seen in Table 1.
Table 1. Relationship pairwise classifier matrix [20]
Dk Correct (1) Dk Wrong (0)
Di Correct (1) N11 N10
Di Wrong (0) N01 N10
Diversity data can be calculated using Q-Statistics [21].
Qi,k
=
𝑁11𝑁00−𝑁01𝑁10
𝑁11𝑁00+𝑁01𝑁10 (1)
2.3. Classifier
Classifiers can generally be defined as Decision Region ℜ𝑛that place an object into a set class Ω,
where Ω consists of class 𝜔1, 𝜔2, until 𝜔𝑛. This can be seen in (9) [20].
𝐷: ℜ
𝑛→ 𝛺
(2)Where D is the classifier and is the set of each point in the decision region ℜ𝑖 which is intended for class 𝜔𝑖.
2.4. Classifier performance
ROC Curve is one statistical method that is often used to determine the performance of a classifier. This curve is generated by plotting the true positive fraction of a positive sample in the Y axis with the false positive fraction of a negative sample (False Positive Rate) in the X axis [22]. The concepts of True Positive and False Positive can be seen in the Confusion Matrix as can be seen in Table 2 [23].
Table 2. Confusion matrix [24]
Classified as positive Classified as negative
Positive samples True Positive (TP) False Negative (FN)
Negative samples False Positive (FP) True Negative (TN)
The number of performance classifier measurement parameters in the two class problems are as follows [25].
T Prate = 𝑇𝑃 𝑇𝑃 + 𝐹𝑁 (3) F Prate = 𝐹𝑃 𝑇𝑁+𝐹𝑃 (4) TN rate = 𝑇𝑁 𝑇𝑁 + 𝐹𝑃 (5) Recall = TPrate (6) Precision = PPValue = 𝑇𝑃 𝑇𝑃 + 𝐹𝑃 (7) F-Measure = 2𝑅𝑃 𝑅+𝑃 (8) G-Mean = √𝑇𝑃𝑟𝑎𝑡𝑒 . 𝑇𝑁𝑟𝑎𝑡𝑒 (9)
True Positive Rate (TPrate) is stated as a recall which states the percentage of data captured is relevant data. Positive Predictive Value (PPValue) is stated as Precision which states the percentage of relevant data identified to be taken. F-Measure states the harmonic average value between recall and precision. The F-Measure value is usually smaller than 2, the higher the value of F-Measure states that both recall and precision are quite high. G-Means on the other hand states the balance between positive samples and negative samples [23]. Performance measurement in multi class imbalance is basically a modification of two class problems, and in general there are 2 (two) parameters used, namely:MAvA and MFM [26].
𝑀𝐴𝑣𝐴 = ∑ 𝐴𝐶𝐶𝑖
𝑁 𝑖=1
𝑚 (10)
where m is the number of classes and 𝐴𝐶𝐶𝑖 stands for the accuracy rate for the class I and MAvA
is the average value of accuracy.
𝑀𝐹𝑀 =𝐹 − 𝑚𝑒𝑎𝑠𝑢𝑟𝑒𝑖
𝑚 (11)
where MFM is the multi-class F-Measure.
3. RESULTS AND ANALYSIS
3.1. Dataset description
This study uses a multi-class imbalanced dataset that is sourced from the KEEL Repository. The dataset selected in this study has represented a low, medium and high imbalance ratio. For datasets with a low imbalance ratio are Balance Scale datasets, datasets with moderate imbalance ratio are Car Evaluation datasets, and dataset with high imbalance ratio are Red Wine Quality datasets, Ecoli, and Pageblocks. Dataset description can be seen in Table 3 [18].
Table 3. Dataset description[18]
Dataset #Ex #Atts Distribution of class IR
Balance scale 625 4 288/49/288 5.88
Car evaluation 1728 6 384/69/1210/65 18.62
Red wine quality 1599 11 10/53/681/638/199/18 68.1
Ecoli 336 7 2/2/5/20/35/52/77/143 71.5
Pageblocks 548 10 3/8/12/33/492 164
3.2. Testing result
The first test is to obtain a comparison of the number of classifier and diversity data obtained by using HAR-MI and DES-MI method. Testing of each method will be carried out as many as 10 testing for each dataset. The average test results can be seen in Table 4.
Table 4. Testing result for number of classifier and data diversity for each method
Dataset
HAR-MI method DES-MI method
Number of Classifier Data Diversity (Q-Statistics) Number of Classifier Data Diversity (Q-Statistics) Balance scale 191.6 0.397 197.2 0.421 Car evaluation 471.6 0.457 487.9 0.461
Red wine quality 397.8 0.431 395.3 0.411
Ecoli 91.1 0.397 121.2 0.413
Pageblocks 117.8 0.441 119.6 0.456
Based on the results in Table 4, it can be seen that HAR-MI Method gives better results on better data diversity in the three datasets when compared with DES-MI Method. The test results for the HAR-MI method classifier are better in the Balance Scale, Car Evaluation, Ecoli, and Pageblocks datasets. For the Red Wine Quality dataset, DES-MI is slightly superior compared to HAR-MI. There is a tendency if the number of attributes increases, the sampling process, especially on Random Under Sampling, requires a larger
classifier. However, the difference in the number of classifiers is not very significant. The results of testing MAvA and MFM can be seen in Table 5.
Table 5. Testing Result for MAvA and MFM for Each Method
Dataset HAR-MI method DES-MI method MAvA MFM MAvA MFM
Balance scale 66.71 0.71 61.29 0.61
Car evaluation 97.68 0.97 94.27 0.945
Red wine quality 45.24 0.43 41.81 0.395
Ecoli 57.31 0.58 49.67 0.51
Pageblocks 47.81 0.49 45.92 0.44
In Table 5 it can be seen that HAR-MI Method gives better results for MAvA and MFM when compared to DES-MI Method. Both methods have provided excellent MAvA and MFM values. A good MAvA means that the accuracy of the classification has been very good, where the misclassification that occurs is very minimal. This means that the instance of the minority class has been classified correctly and also the majority class instances that are incorrectly classified as minority classes are also minimal. This is because F-Measure states how many instances in the minority class are correctly defined and also measures how many instances in the majority class are incorrectly classified as minority classes.
3.2. Testing result
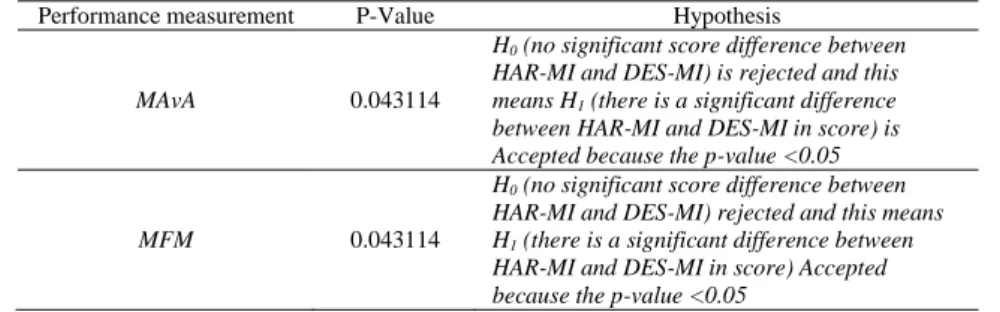
The statistical test is performed using the Wilcoxon signed-rank test which is a statistical procedure to measure performance based on pairwise comparison [27]. Wilcoxon tests are carried out to compare the performance of the HAR-MI method with the DES-MI method using MAvA and MFM. The results obtained can be seen in Table 6.
Table 6. Wilcoxon signed-rank test for comparing performance measurements using MAvA and MFM
Performance measurement P-Value Hypothesis
MAvA 0.043114
H0 (no significant score difference between
HAR-MI and DES-MI) is rejected and this means H1 (there is a significant difference
between HAR-MI and DES-MI in score) is Accepted because the p-value <0.05
MFM 0.043114
H0 (no significant score difference between
HAR-MI and DES-MI) rejected and this means H1 (there is a significant difference between
HAR-MI and DES-MI in score) Accepted because the p-value <0.05
Based on the results of testing with the Wilcoxon signed-rank test that can be seen in Table 6, there is a significant difference between HAR-MI and DES-MI and this indicates that the superiority of the HAR-MI method.
4. CONCLUSION
Based on the test results it can be seen that HAR-MI method gives better results compared to DES-MI method for both the number of classifier, data diversity, and also the performance classifier. It should be noted that for the number of classifiers, where if the dataset has many attributes such as the Red Wine Quality, then the HAR-MI method can produce poor results. In general, the imbalance ratio does not have a significant effect on the test results. This means that both HAR-MI method and DES-MI method can handle the imbalance problem class very well. Future research, it is expected that HAR-MI method can be optimized so that it can be applied to datasets for a large number of attributes without causing a large number of classifiers. The main attention needs to be given to the sampling method used in the HAR-MI method. It is necessary to find another sampling alternative at the preprocessing and processing stages.
ACKNOWLEDGEMENTS
This work was supported by the Grant of Ministry of Research, Technology, and Higher Education (KEMENRISTEKDIKTI) of the Republic of Indonesia.
REFERENCES
[1] S. Wang and X. Yao, "Multiclass imbalance problems: Analysis and potential solutions," IEEE Transactions on Systems, Man, and Cybernetics, Part B (Cybernetics), vol. 42, no. 4, pp. 1119–1130, 2012.
[2] B. Krawczyk, "Learning from imbalanced data: Open challenges and future directions," Progress in Artificial Intelligence, vol. 5, pp. 221–32, 2016.
[3] A. Ali, S. M. Shamsuddin, and A. Ralescu, "Classification with class imbalance problem: A review," International Journal of Advances in Soft Computing and Its Application, vol. 7, no. 3, pp. 176–204, 2015.
[4] G. Haixiang, L. Yijing, J. Shang, G. Mingyun, H. Yuanyue, and G. Bing, "Learning from class-imbalanced data: Review of methods and applications," Expert Systems with Applications, vol. 73, pp. 220–39, 2017.
[5] A. Fernández, V. López, M. Galar, M. J. del Jesus, and F. Herrera, "Analysing the classification of imbalanced data-sets with multiple classes: Binarization techniques and ad-hoc approaches," Knowledge-Based Systems, vol. 42, pp. 97–110, 2013.
[6] J. Bi and C. Zhang, "An empirical comparison on state-of-the-art multi-class imbalance learning algorithms and a new diversified ensemble learning scheme," Knowledge-Based Systems, vol. 158, pp. 81–93, 2018.
[7] T. R. Hoens, Q. Qian, N. V. Chawla, and Z-H. Zhou, "Building decision trees for the multi-class imbalance problem," In: Tan P-N, Chawla S, Ho CK, Bailey J, editors, Advances in Knowledge Discovery and Data Mining, Lecture Notes in Computer Science,Springer Berlin Heidelberg; vol. 7301, pp. 122–34, 2012.
[8] E. L. Allwein, R. E. Schapire, and Y. Singer, "Reducing multiclass to binary: A unifying approach for margin classifiers," Journal of Machine Learning Research, vol. 1, 113–141, 2000.
[9] M. Galar, A. Fernández, E. Barrenechea, H. Bustince, and F. Herrera, "An overview of ensemble methods for binary classifiers in multi-class problems: Experimental study on one-vs-one and one-vs-all schemes," Pattern Recognition, vol. 44, no. 8, pp. 1761–1776, 2011.
[10] J. A. Sáez, B. Krawczyk, and M. Woźniak, "Analyzing the oversampling of different classes and types of examples in multi-class imbalanced datasets," Pattern Recognition, vol. 57, pp. 164–178, 2016.
[11] Z-L. Zhang, X-G. Luo, S. García, J-F. Tang, and F. Herrera, "Exploring the effectiveness of dynamic ensemble selection in the one-versus-one scheme," Knowledge-Based Systems, vol. 125, pp. 53–63, 2017.
[12] S. García, Z.-L. Zhang, A. Altalhi, S. Alshomrani, and F. Herrera. "Dynamic ensemble selection for multi-class imbalanced datasets," Information Sciences, vol. 445–446, pp. 22–37, 2018,
[13] P. Pérez-Gállego, A. Castaño, J. R. Quevedo, and J. J. del Coz, "Dynamic ensemble selection for quantification tasks," Information Fusion, vol. 45, pp. 1–15, 2019.
[14] Hartono, E. Ongko, O. P. Sitompul, Tulus, E. B. Nababan, and D. Abdullah, "Hybrid approach redefinition (HAR) method with loss factors in handling class imbalance problem," In International Symposium on Advanced Intelligent Informatics (SAIN), pp. 56–61, 2018.
[15] Hartono, E. Ongko, E. B. Nababan, Tulus, D. Abdullah, and A. S Ahmar, "A new diversity technique for imbalance learning ensembles," International Journal of Engineering & Technology, vol. 7, no. 2, pp. 478–483, 2018.
[16] j. F. Díez-Pastor, J. J. Rodríguez, C. I. García-Osorio, and L. I. Kuncheva, "Diversity techniques improve the performance of the best imbalance learning ensembles," Information Sciences, vol. 325, pp. 98–117, 2015. [17] C. Jian, J. Gao, and Y. Ao, "A new sampling method for classifying imbalanced data based on support vector
machine ensemble," Neurocomputing, vol. 193, pp. 115–122, 2016.
[18] J. Alcalá-Fdez et al., "KEEL: A software tool to assess evolutionary algorithms for data mining problems," Soft Comput., vol. 13, no. 3, pp. 307–318, 2009.
[19] K. Napierala, And J. Stefanowski, "Identification of different types of minority class examples in imbalanced data," In Corchado E., Snášel V., Abraham A., Woźniak M., Graña M., Cho SB. (eds) Hybrid Artificial Intelligent Systems, Springer, Berlin, Heidelberg, pp. 139-150, 2012
[20] L. I. Kuncheva, "Combining pattern classifiers," John Wiley & Sons, pp. 295–327, 2004.
[21] L. I. Kuncheva and C. J. Whitaker, "Measures of diversity in classifier ensembles and their relationship with the ensemble accuracy," Machine Learning, vol. 51, no. 2, pp. 181–207, 2003.
[22] C. Gigliarano, S. Figini, and P. Muliere, "Making classifier performance comparisons when ROC curves intersect," Computational Statistics & Data Analysis, vol. 7, pp. 300–312, 2014.
[23] Y. Sun, M. S. Kamel, A. K. C. Wong, and Y. Wang, "Cost-sensitive boosting for classification of imbalanced data," Pattern Recognition, vol. 40, no. 12, pp. 3358–3378, 2007.
[24] L. Zhang, H. Yang, and Z. Jiang, "Imbalanced biomedical data classification using self-adaptive multilayer ELM combined with dynamic GAN," Biomed Eng. Online, vol. 17, pp. 1-21, 2018.
[25] A. Tharwat, "Classification assessment methods," Applied Computing and Informatics [Internet]. 2018 Aug 21 [cited 2019 Oct 19]; Available from: http://www.sciencedirect.com/science/article/pii/S2210832718301546 [26] R. Alejo, J. A. Antonio, R. M. Valdovinos, and J. H. Pacheco-Sánchez, "Assessments metrics for multi-class
imbalance learning: A preliminary study," In arrasco-Ochoa J.A., Martínez-Trinidad J.F., Rodríguez J.S., di Baja G.S. (eds) Pattern Recognition, Lecture Notes in Computer Science, Springer Berlin Heidelberg,vol. 7914, pp. 335–343, 2013.
![Table 1. Relationship pairwise classifier matrix [20]](https://thumb-us.123doks.com/thumbv2/123dok_us/9757146.2467081/5.892.177.709.838.1147/table-relationship-pairwise-classifier-matrix.webp)
![Table 3. Dataset description[18]](https://thumb-us.123doks.com/thumbv2/123dok_us/9757146.2467081/6.892.215.700.913.1012/table-dataset-description.webp)