A
C
YBER
-S
UPPORT
S
YSTEM FOR
D
ISTRIBUTED
I
NFRASTRUCTURES
Sahar Badri, Paul Fergus, William Hurst.
School of Computing and Mathematical Sciences,Liverpool John Moores University, Byrom Street
Liverpool, L3 3AF, UK
[email protected], {p.fergus, w.hurst}@ljmu.ac.uk Abstract— The Internet is now heavily relied upon by the critical
infrastructures (CI). This has led to different security threats facing interconnected security systems. By understanding the complexity of critical infrastructure interdependency, and how to take advantage of it in order to minimize the cascading problem, enables the prediction of potential problems before they happen. Our proposed system, detailed in this paper, is able to detect cyber-attacks and share the knowledge with interconnected partners to create an immune system network. In order to demonstrate our approach, a realistic simulation is used to construct data and evaluate the system put forward. This paper provides a summary of the work to-date, on the development of a system titled Critical Infrastructure Auto-Immune Response System (CIAIRS). It provides a view of the main CIAIRS segments which comprise the framework and illustrates the functioning of the system.
Keywords; —Critical Infrastructure, Distributed System, System
of Systems, Data Analysis, Cyber-attack. 1. INTRODUCTION
The role of one infrastructure influences the functioning of others. This can be referred to as interdependency. Interdependency is considered the main challenges for critical infrastructures (CI). Operating as a mutually interdependent network, treated as a system of systems, failures and successful cyber-attacks have the potential to cause a cascading effect. Understanding the interconnectivity behaviour between the critical infrastructures, and how it changes depending on the complexity, can reduce the effect before cascading occurs. Moreover, this would control the damage and limit the impact [1].
The risk of cascading failure among distributed systems is the main influential factor behind this research. To date, our previous work has involved creating a support system against cyber-attacks, using the human immune system mechanism as inspiration for the design [2]. The system is titled Critical Infrastructure Auto-Immune Response System (CIAIRS); in this paper, the framework for CIAIRS is presented. The operation process and design for CIAIRS is discussed, along with the evaluation of CIAIRS using a simulation testbed. The simulation is established using a professional plant simulator, where realistic data is constructed through its operation. The data is subsequently used to further our investigation into a support framework for distributed and interconnected systems [2] [3].
Simulation is considered to be a key role in the advancement of critical infrastructure protection. Currently, there are some simulation programs, which contain smart built-in models for many common real systems. These programs can be used to test new security techniques within a safe environment. Specifically, simulation test beds can be used to analyse the inputs and outputs and do all the required challenging work and give realistic and comprehensive results. In addition, simulations are not held back by the use of real-time data construction and can carry out complex models of operation in a relatively short period of time. As such, it is becoming a common technique for the testing of cyber-attack prevention measures and for improving the level of the security techniques [4]. A large critical infrastructure can be represented by creating a simple system and allow for realistic testing to take place [5].
Within this paper, realistic data constructed from a simulation of 8 critical infrastructures is presented in order to test the CIAIRS system. Furthermore, the big data analysis techniques used to identify patterns of abnormal behaviour and share threats between infrastructures are detailed. As such, the remainder of the paper is divided as follows: Section 2, presents a background on critical infrastructures (CI), CI modelling and highlights the important of the simulation. Section 3 introduces the CIAIRS framework components and an overview of the system route. Subsequently, Section 4 contains the evaluation of the system. Finally, Section 5 will conclude the paper.
2. BACKGROUND
In this section, a discussion on critical infrastructure growth and their interdependency characteristics is put forward. The focus is on the interdependency between the critical infrastructures and a number of modelling examples are discussed.
2.1 Critical Infrastructures Interdependency
The National Institute of Standards and Technology (NIST) defines critical infrastructures as any physical or virtual systems that would affect the national security, public economy and health service by their failure or if damage occurred to them [6]. Critical infrastructure assets, as explained by Command et al., and can be divided into three
categories [7]; Firstly, the physical assets, which could be tangible or intangible. Secondly, human assets, that can represent vulnerabilities by having privileged access to important information or systems. Thirdly, cyber assets, which include hardware, software, data, and which all, serve the network functionality.
Infrastructure is the main source of development and economic construction process of any country [8]. Different types of urban developments depend on the size and the provision of infrastructure elements, which help guide the development of new areas. Critical infrastructures are considered to be the head of the development process and the driving force behind economic construction. Urban development depends on the size and the provision of infrastructure elements of style, which contributes to guiding the development of new areas. However, many infrastructures, such as power plants, are considerably outdated and are therefore difficult to repair [6]. This means that disruptions in service provision and weaknesses in security are apparent.
Yusufovna et al., discuss energy resources, finance, food, health, government services, manufacturing, law and legislation, transportation [9]. As Yusufovna et al., discussed, there is a risk of these security weaknesses causing failures which can cascade across borders. For example, they present a survey on different groups of critical infrastructure and detail how many are international and national as well as local and individual. This means that any successful attack may have a political and economic impact which spams across borders.
As previously discussed, in the result of the global expansion, and with the Internet revolution, infrastructures have become highly complex and have increased the interdependency at the physical and network layers. Therefore, the interdependency is considered to be one characteristic that can raise several concerns; in particular the analysis and modelling of interdependencies due to the complicated interactions [10][11]. For that reason, accurate critical infrastructure modelling techniques are imperative for the testing of new security metrics.
2.2 Critical Infrastructure Modelling
Depending on the infrastructure type, the task of an accurate modelling is a challenge. This has led to develop simulation programs that can help diagnose infrastructure weaknesses and simulate their behaviours and interactions. This includes software, such as Tecnomatix [12], and the adaptation of existing software-based simulators such as OMNET++, Simulink and Matlab [13], just to name a few. These simulators allow for affordable representations of critical infrastructure systems, by modelling their behaviour, interactions and the integration of their specific protocol types such as Modbus and DNP3.
The interest in simulation has increased as an appropriate and effective education process in recent years. Simulation has become a process to test concepts, activities, and experiments done through the computer. It has an increasingly
important and prominent role in the cyber-security and critical infrastructure educational process [14]. Al-essa et al., defines simulation as a method for teaching students that bring elements from the real world, overriding difficulties such as material cost or human resources [15]. For that reason, the system proposed in this paper is evaluated through a simulation testbed rather than through a real-world application.
2.3 A Cyber Framework for CI
Simulations helped in enhancing the security level by using new framework concepts. For example, the NIST developed a framework to reduce the risk of cyber-attacks to critical infrastructure [16]. The NIST framework includes sets of procedures and methodologies that help to understand the cyber risks. Moreover, the approach involves flexible, classified, performance-based, and cost-effective method with more security measures. Finally, the framework helps the possessor and specialist of the critical infrastructure to recognize, classify, assess and control the cyber risk [16]. Specifically, the NIST cyber security framework has been set up to strengthen security through the following:
Diagnose the security status of a system. Mend and form a cyber-security program. Detect new chances for new or known standard.
Support the critical infrastructure organisation, to use the cyber-security framework with tools and technologies. Critical infrastructures have benefited from the NIST cyber-security framework. This has been recognised by some notable improvements, such as reducing the time of starting the security program, reduce the risk by recognize the improving areas in the program and improving efficient relationship between law and critical infrastructure [16].
Depending on the previous different frameworks and more which were used in order to improve the critical infrastructure level of security the next section will present our framework.
3. APPROACH FOR CIAIRS
In our research to date, a system framework titled Critical Infrastructure Auto-Immune Response System (CIAIRS), which is able to identify threats to a network and communicate the potential impact, has been put forward [2]. The quality of the framework depends on four main features: Simplicity, Clarity, Boundaries, Expandability [17]. Therefore, these features were taken in mind while forming the research approach.
CIAIRS functionality relies on identifying attacks, then the system assists and guides critical infrastructures on how to behave when abnormal behavior is detected. Furthermore, inspired by the human immune system characteristic the information is then shared to other infrastructures to create an immune system network [2]. In the following sub-sections, the CIAIRS structure is presented along with a detailed account of the various components, which work together to predict the
abnormal behaviours and share them with other infrastructures. Then high level of the CIARIS process is presented. Finally, a simulation of 8 critical infrastructures is presented to construct data for the evaluation of CIARIS.
3.1 CIAIRS Design Overview
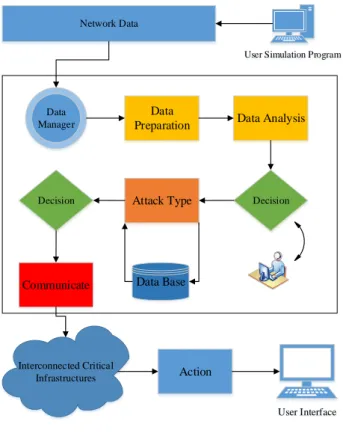
Figure 1 indicates the CIAIRS framework design and the interaction between the various modules which function together to perform the security and communication services. The module linked together comprises the system as a whole and works together in order to detect abnormal behaviours in one infrastructure and share them with others. In doing so the aim is to prevent cyber-attacks from having a cascading impact and spreading to other infrastructures. Threat information can be communicated to allow operators in other infrastructures to take appropriate measures to prevent an attack having an impact.
Network Data
User Simulation Program
Data Manager Data Preparation Decision Interconnected Critical Infrastructures Data Base User Interface Action Data Analysis Attack Type Decision Communicate
Fig. 1. CIAIRS Design
CIAIRS is composed of several mechanisms, interconnected processes and a data collection modules. The different components that form the system, and the flow between the components, are displayed in Figure 1. By extracting the data from the network, which, for the purposes of this research, is provided by the simulation, the data manager is responsible for controlling the intake of information. Extracting the data in blocks prevents overload of the system.
Subsequently, the data passes through a cleaning process to make sure there is no missing information; this stage called the Data Preparation stage. At this point, the data needs to
have features extracted and be analysed. The features correspond to the system behaviour and present the behaviour in a simplified view of the overall network.
By using the features, a data classification process is involved in order to indicate the normal and the abnormal behaviour. In order to compare the attack type, the data is sent to a temporary database until needed. Each block of data is stored as a block of column data, which would help in comparing the CI data collection to the CI database.
Depending on the decision, the network uses the connectivity between infrastructures to share the new abnormal behaviour with interconnected partners. This would assist other infrastructure in planning for an emerging attack or cascading impact. At all times an administrator overviews the system functionality. This whole process is clarified further in the next subsection, which presents two key module components from the CIAIRS design. The Data Manager and the Communication Manager are explained in detail.
3.1.1 CIAIRS Data Manager
Figure 2 presents a Data Flow Diagram for the CIAIRS processing of the infrastructure data. The data manager is responsible for data collection, validation and checking, purifying and storage. Each of these methods requires time (T) and data status (S).
DAC Purifying Model T S DB Data Blocks Network data Cleaning S: Statue - Sleep - Repair - Slow - Overload - Normal -Cyber Set workflow status Data Blocks Data Flow
Fig. 2. CIAIRS DFD Process
3.1.2 CIAIRS Communication
Figure 3 presents the communication process for sharing attacks information between the different partners. This is one of the novelties of the design. After identifying abnormal
behavior in one of the critical infrastructures, the attack information and characteristics are shared with interconnected partners in order to prevent cascading failures. After indicating an abnormal behaviour the CIAIRS communication process starts by checking the connectivity list in order to send an inherited script to the connected infrastructure.
The script, which includes the abnormal behaviour information from features, ID and source are compared to the data source of each interconnectivity CI. By comparing the database source, an indicator selects the corresponding information cell and adds to the database. Base on the result an action of recommendation is distributed order to suggest the right reaction for any future attacks.
Infrastructures Compare data source Compare data source Set field in current item Actions Actions Log to critical connectivity list Inherit Script list Set field in current item
Fig. 3. CIAIRS Communication
3. 2 CIAIRS Simulation
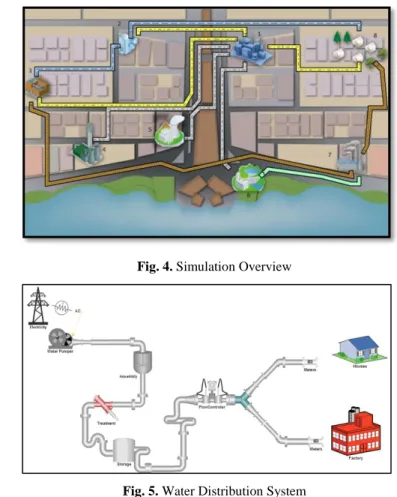
In order to evaluate the discussed system design, as simulation testbed is constructed. Figure 4 presents an emulation of 8 critical infrastructures, which include key service providers such as an Electricity Grid and Water Distribution service. The full simulation is outlined in our past work [2][3]. Each of the critical infrastructure systems is given a graphical icon to represent its function more clearly. They can be expanded within the simulation, to show the different objects, which comprise the system as a whole.
Figure 5 displays one of the presented critical infrastructures: The Water Distribution System. The Water Distributed System consists of a main water resource, the sea, a main electricity cable from the power plant and a transport system to send the water through pipes and feed both the houses in the compound and a factory. The Water Distribution
System is controlled by a FlowControl to pump the water for both the Houses and the Factory, divided equally.
Fig. 4. Simulation Overview
Fig. 5. Water Distribution System
The experiments detailed in Section 3 is used to evaluate the proposed system, form the process layout and constructed the product lifecycle management. As such, the evaluation is presented in the following section.
4. EVALUATION
This section presents the evaluation process for CIAIRS. The evaluation can be either formative or summative [18]. A formative evaluation takes place during the project itself. On the other hand, a summative evaluation takes place after the project is done in order to assess if the outcomes met the aim of the project [18]. Therefore, a summative evaluation is used to improve the service within the CI’s. The system is evaluated using data constructed through a simulation of a network of critical infrastructures. Data analysis is conducted using data visualisation to identify system anomalies and demonstrate that models of behaviour can be constructed and shared with other infrastructures.
In order to reach the aim of the research, two critical infrastructures are chosen as a case study, the Water Distribution System and the Electricity Grid. The impact on service provision to a housing compound is illustrated. The trends in data patterns for both normal and abnormal behaviour can be identified and communicated to prevent future impacts.
The first phase is data collection that conducts with a sampling rate of 4 Hertz (which is every 0.25 of a second). Blocks of data are extracted to prevent data overload and to support building the features from both normal and abnormal datasets [3]. In the next subsection, a data sample is presented, data trends and a statistical production report for one of the CIAIRS infrastructures is also provided as an example.
4.1 Data Sample
In order to understand the behaviour of the system, two data sets are constructed from The Water Distribution Infrastructure System. A normal system set constructed from a two days simulation. Then faults were introduced to the system as abnormal behaviours in order to construct a dataset of the system under attack. For this paper, a fault is introduced into the water pipe 1 and the water pipe connected to the houses compound inside the water distributed critical infrastructure. Table (1) and (2) display data samples from normal behaviour mode and the abnormal mode in the Water Distribution Infrastructure, consecutively.
Table 1. Normal Simulation Data Sample
Time F1 F2 F3 F4 F5 F6 F7 F8 F9 F10
Normal Data Set
1:10:59:14.50 0 3 1 0 0 2 1 3 0 2
1:10:59:14.75 0 3 1 0 0 2 1 3 0 2
1:10:59:15.00 0 3 1 0 0 2 1 3 0 2
1:10:59:15.25 0 3 1 0 0 2 1 3 0 2
1:10:59:15.50 0 3 1 0 0 2 1 3 0 2
Table 2. Abnormal Simulation Data Sample
Time F1 F2 F3 F4 F5 F6 F7 F8 F9 F10
Abnormal Data Set
1:10:59:14.50 3 3 1 3 50 3 1 3 0 2
1:10:59:14.75 3 3 1 3 50 3 1 3 0 2
1:10:59:15.00 3 3 1 3 50 3 1 3 0 2
1:10:59:15.25 3 3 1 3 50 3 1 3 0 2
1:10:59:15.50 3 3 1 3 50 3 1 3 0 2
The simulation consists of 147 components in total. The numbers in the tables represent the units which flow in the water pipe. It is clear that the between the time 1:10:59:14:50 to 1:10:59:15:50 the level of the water was fluctuated.
4.2 Data Trends
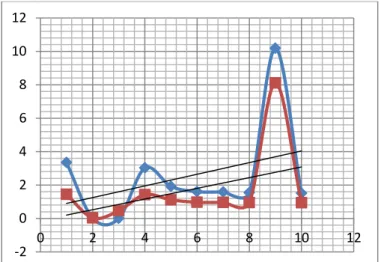
Based on the data collected, a number of features were extracted from both normal and abnormal behaviours. However, for the purpose of this paper, The Water Distribution Infrastructure system relative standard deviation (RSD) was chosen to indicate the change in behavioural patterns between normal and abnormal, which is displayed in figure 6. RSD is a statistical trend that helps in indicating how far the data from the mean and measure the distance for every value from the mean in order to employ the quality assurance.
Figure 6 displays the relative standard deviation for data trend for the Water Distribution Infrastructure with normal and one signal and two failures: water pipe 1 and the water pipe connected to the houses compound inside the water distributed critical infrastructure.
Fig. 6. The normal and abnormal RSD Water Distribution
Figure 6 clarifies the difference between the water rate in a normal system and a failure system with two failures in water pipe 1 and the water pipe connected to the houses compound inside the water distributed infrastructure. The red line, with squares, presents the abnormal behaviour trend while the blue, with diamonds, presents the normal behaviour trend. It is clear that the data does not follow a normal distribution. Moreover, that the failures had a significant impact on the water pipe from the Water Distribution Infrastructure system to Houses component in the Water Distribution Infrastructure system more than any other component.
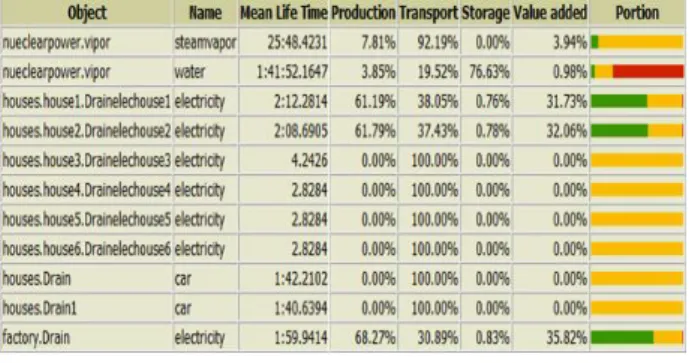
4.3 Statistical Production Report
As the previous subsection presents, the data trends between the normal and abnormal behaviour can be seen. It is this information which can be commutated using CIARIS to interconnected infrastructures. In this case, the faults in the system have affected the percentage of the production for some components in different CI.
Table 3. The Normal Production Statistical Report for the Water Distribution Infrastructure -2 0 2 4 6 8 10 12 0 2 4 6 8 10 12
By comparing the tables 3 and 4 which show the statistical service production report, it is clear that the production of the electricity in the houses have dropped from 71.75% to 61.19% and the production of the electricity in the factory also decreased by 10%. The result indicates that the attacks, which accrued in the Water Distribution Infrastructure faults, have affected the production of the electricity in two other infrastructures including a factory and the housing complex.
Table 4. The Abnormal Production Statistical Report for The
Water Distribution Infrastructure
5. CONCLUSION
The development and evaluation of CIAIRS is presented in this paper. The simulation put forward can be used to create substantial datasets. Critical infrastructure interconnectivity is one of the main challenges. Systems such as CIAIRS can assist to countering the growing cyber-threats and the risk of cascading failures. This paper presented the CIAIRS’s framework. The various components and mechanisms were highlighted in order to present the role of the CIAIRS which shares information with other infrastructures, using the human immune system as a reference model, to create a distributed support network for enhanced cyber-security.
REFERENCES
[1] A. Laugé, J. Hernantes, and J. Mari Sarriegi, “The Role of Critical Infrastructures’ Interdependencies on the Impacts Caused by Natural Disasters,” Crit. Inf. Infrastructures Secur., vol. 8328, pp. PP50–61, 2013.
[2] S. Badri, P. Fergus, W. Hurst, and B. Street, “Critical Infrastructure Automated Immuno-Response System ( CIAIRS ),” in 3rd International conference, Malta, 2016, p. 6.
[3] S. Badri, P. Fergus, and W. Hurst, “A Support Network for Distributed Systems,” n 10th Int. Conf. E-Learning Games., p. 16, 2016.
[4] E. Commission, “Digital Agenda: cyber-security experts test defences in first pan-European simulation,” Eur. Comm. Press Release, no. November, 2010.
[5] C. M. Davis, J. E. Tate, H. Okhravi, C. Grier, T. J. Overbye, and D. Nicol, “SCADA cyber security testbed development,” in 2006 38th Annual North American Power Symposium, NAPS-2006 Proceedings, 2006, pp. 483–488.
[6] National Institute of Standards and Technology, “Framework for Improving Critical Infrastructure Cybersecurity,” Natl. Inst. Stand. Technol., vol. 1, pp. 1–41, 2014.
[7] D. Command and F. Leavenworth, “Critical Infrastructure Threats and Terrorism,” in DCSINT handbook No. 1.02, 1st ed., no. 1, Distribution Unlimited, 2006.
[8] S. Marrone, R. Nardone, A. Tedesco, P. D’Amore, V. Vittorini, R. Setola, F. De Cillis, and N. Mazzocca, “Vulnerability modeling and analysis for critical infrastructure protection applications,” Int. J. Crit. Infrastruct. Prot., vol. 6, no. 3–4, pp. 217–227, 2013.
[9] F. S. Yusufovna, F. A. Alisherovich, M. Choi, E. Cho, F. T. Abdurashidovich, and T. Kim, “Research on Critical Infrastructures and Critical Information Infrastructures,” in 2009 Symposium on Bio-inspired Learning and Intelligent Systems for Security, 2009, pp. 97–101.
[10]S. M. Rinaldi, “Modeling and Simulating Critical Infrastructures and Their Interdependencies,” in System Sciences, 2004. Proceedings of the 37th Annual Hawaii International Conference on, 2004, vol. 00, no. C, pp. 1–8.
[11] B. S. M. Rinaldi, J. P. Peerenboom, and T. K. Kelly, “Identifying, Understanding, and Analyzing: Critical Infrastructure Interdependecies,” Control Syst. IEEE, vol. 21, no. 6, pp. 11–25, 2001.
[12] Siemens, “www.siemens.com/tecnomatix,” 2011.
[13] C. M. Lewandowski, N. Co-investigator, and C. M. Lewandowski, Manufacturing Simulation with Plant Simulation and SimTalk, vol. 1. 2015.
[14] D. Asteteh and O. Sarhan, Education and e-Learning Technology. Jorden: darwael, 2007.
[15] A. AL-esaa, “The effect of using simulation Implementing strategy through computer teaching assistant in the immediate and delayed achievement,” Jorden, 1993.
[16] National Institute of Standards and Technology, “Framework for improving critical infrastructure cybersecurity,” no. April, 2015. [17] A. R. McGee, S. Rao Vasireddy, C. Xie, D. D. Picklesimer, U. Chandrashekhar, and S. H. Richman, “A framework for ensuring network security,” Bell Labs Tech. J., vol. 8, no. 4, pp. 7–27, 2004. [18] R. Hartson and P. Pyla, The UX Book: Process and Guidelines for Ensuring a Quality User Experience. USA: Elsevier, 2012.