New Multi Attributes Procurement Auction for
Agent-Based Supply Chain Formation
Rasoul Karimi, Caro Lucas, Behzad Moshiri Control and Intelligent Processing Center of Excellence
School of Electrical and Computer Engineering University of Tehran, Tehran, Iran
Abstract –Multi Attributes Procurement Auction is a well known solution for negotiation between sellers and buyers. Seller wants to sell the product with more prices while buyer wants to buy the product with fewer prices. This problem has been analyzed by game theory approach and one optimal solution is achieved for the seller and the buyer with this assumption that the seller knows the exact value of the production cost. Production cost is the money that the seller must pay to prepare the product for selling. But this constraint is not acceptable in the new models of supply chain, because the seller (producer agent) is dependent on several supplier agents which supply components in undetermined time and price. In this article, this constraint has been relaxed and a new procurement auction is defined. In this auction, seller agents can take different strategies based on their risk attribute. These strategies is analysed and compared mathematically.
Index Terms – Supply Chain, Procurement Auction, Reverse Auction, Multi Attribute Auction, Mass Customization
I. INTRODUCTION
A multi-agent system is composed of a group of agents that can take specific roles within an organizational structure. Different types of agents may represent different objects, with different authority and capability, and perform different functions or tasks. They can be dynamically organized based on a control or connection structure.
In the other hand, a supply chain consists of suppliers, factories, warehouses, distribution centres and retailers, working together to convert raw materials to products and delivered to the customers. Parties involved in the supply chain have their own resources, capabilities, tasks, and objectives. They cooperate with each other autonomously to serve common goals but also have their own interests. Supply chain management by its very nature has characteristics that makes agent technology as a very suitable to support collaboration in supply chain management. Multi agent systems can be used to model or actually perform tasks in supply chain management due to the similarities of the nature of these two systems shown in Table 1[15].
Nature of Supply Chain
Management Nature of Multi-Agent Systems A Supply Chain consists of
multiple parties working on multi-stage tasks.
A multi-agents system consists of different types of agents with different roles and functions. Each entity in a supply chain
has its own objectives, capabilities, performs certain tasks, and follows certain business rules.
Agents have their own objectives, resources, tasks, and decision rules specified by the user they represent. There is a need to coordinate
material, information, and financial flows between and among all the participating entities.
Agents coordinate with each other through communication and interaction with each other in a network. There is no single authority.
Knowledge is distributed among members in supply chain. Decision making in Supply Chain is through multiparty negotiation and coordination.
Agents are autonomous. They are responsive to monitor changing environment, proactive to take self-initiated action, and social to interact with human and other agents. The structure of the supply
chain is flexible. It can be organized differently to implement different strategies.
Agent system is flexible. Agents can be organized according to different control and connection structures. Tasks in supply chain can be
decomposed to subtasks or multiple tasks can be composed to a large function.
Agent can delegate its task to other agent or coordinate other agents’ tasks to form a higher level system.
Supply chain is dynamic. Entities may join or leave a supply chain.
Agents can be created or discarded from a multi-agent system.
Regard to this similarity, Artificial Intelligence efforts to address the challenges of supply chain and find solutions for them.
In a MAS, agents need a protocol for negotiation and cooperation such as: Auction, Contract Net, and Bargaining. In this paper we examine special kind of auction which is called Multi Attributes Procurement Auction (MAPA). In MAPA, in addition to the price, there are some quality attributes which are important for the buyer and it is interested to buy a product with high quality. As the quality is increased, the price of the product will also be increased. Therefore the buyer needs to make a trade off between quality and price, which could be formulated in a scoring rule. According to the scoring rule, one score is assigned to each seller’s bid and the seller which obtains the best score, wins the auction [3].
Procurement auctions are divided into three categories based on the production cost [4]:
1) Private Cost: The production cost depends only
on the capabilities of the seller which knows the exact value of it. This cost is also independent of other sellers’ cost.
2) Correlated Cost: The production cost of a seller
depends on two factors: production capabilities of the seller and other sellers’ cost.
3) Common Cost: The production cost is equal for all
sellers, but sellers do not know this cost and should estimate it.
In common cost MAPA, seller estimates the cost based on its risk factor. The risk averse seller bids in the way that it would be more likely to win the auction and does not risk to be honest, because it might loss the auction. Sometimes this strategy leads to damage of producer: In order to win the auction, it promises produce the product with high quality or low price but later can not do it and is forced to pay the punishment (this situation is called under estimation). This definition could be confusing because the producer which is not agree to risk, should not promise customer to build the product with price or delivery time that may not satisfy them. However, in the literature of auction, the risk parameter is defined according to the behaviour of agent regard to auction [4]. It means, the agent which is disagree to risk, does not want to loss the auction and prepare its bid in this way. In the auction, it raises the price and in the procurement auction it decreases the price so that win in auctions. But a risk neutral seller bids honestly, and considers price and other quality attributes as it thinks is able to satisfy them.
II.LITERATUREREVIEW
Only a small but steadily growing number of academic papers have considered multi-attribute auctions
so far. A thorough analysis of the design of multi-attribute auctions has been provided by Che[5]. He derived a two-dimensional version of the revenue equivalence theorem [6]. Che also designs an optimal scoring rule based on the assumption that the buyer knows the probability distribution of the supplier’s cost parameter. Branco’s analysis is based on Che’s independent cost model and derives an optimal auction mechanism for the case when the bidding firms’ costs are correlated [7]. A variety of different multiple issue auction algorithms are suggested by Teich, Wallenius and Wallenius [8]. Multi-attribute English auctions have also been analyzed in the context of service allocation amongst artificial agents [9].
E. David [10] assumes that in addition to the price, there are two quality attributes which buyer cares about them. The buyer shows its interest to these attributes by assigning a weight to each of them. The utility function of buyer is defined as:
2 2 1 1 2 1
,
)
.
.
,
(
p
q
q
p
W
q
W
q
U
buyer=
−
+
+
(1)Where W1 and W2 are weights which are assigned to quality attributes q1 and q2 respectively and p is the price of product. The producer knows exact production cost Ө
and computes q1, q2 and p parameters as follow:
* 1 1
.
( )
a
q
w
θ
θ
=
2* 2.
( )
b
q
w
θ
θ
=
(2) 1 * 1 2 1 1 ( ) ( ) ( . . ).( . ). ( ) n n t p a w b w dt t θ θθ
θ
θ
θ θ
− − − = + + −∫
Where a and b are coefficients of q1 and q2 respectively. Also w1 and w2 are announced values of W1 and W2. The announced values of the weights w1 and w2 can be different from the real values of weights W1 and W2. The seller agent decides about its bid according to the its production cost, the scoring rule, and its beliefs about the other sellers. We can see from (2) that the seller’s belief about other agents will influence only the price which it proposes. However, the buyers’ decision about the quality of the service is independent of these beliefs.
The buyer does not tend to announce the real values of W1 and W2 because the producers might increase their price. The deceptive values of w1 and w2 are calculated using the following formula:
1 1 1 .( ) ( , ) . ( ) .( ) ( ) n i i n n t t t dt w W z t t dt dz dt z θ θ θ θ θ θ θ θ θ θ θ θ − − − − = − − +
∫
∫
∫ ∫
(3)U[
θ
,θ
] is cost distribution of product which is obvious for the customer. Based on the number of sellers, the distribution of θ, and the sellers’ optimal strategies, the buyer can announce the optimal scoring function that will optimize its expected revenue from the auction’s result. If wi<Wi, the price will be lower than the price given the actual weights, but the qualities will also be lower, and vice versa. As the producers know exact value of production cost, reverse auction is private cost reverse auction.Wilson [11] was the first to develop the Nash equilibrium solution for first price common value auctions, where all sellers are risk neutral. In his approach sellers bid the value which they think is the expected value of the cost.
III. STATE OF ART
First, we explain our model of supply chain. In the previous era which is known by industrial era, manufactures based on Make To Stock (MTS) strategy, produced products massively. Now we are in the post modernism era and manufacturers have Build To Order (BTO) strategy [12,13]. It means producer builds a product when there is a request for it. A product is composed of several parts and there are different components per each part that customer customizes product by selecting its component. Big manufactures has been changed to the small assemblers and the suppliers are specialized. Most of the today models of supply chain have these attributes. For example TAC benchmark [14] has been defined according to this model.
As in this paper auction is used in the supply chain problem, it is better to call seller as producer agent and buyer as customer agent. Producer agent does not know
the exact production cost as it depends on the supplier agents which supply the underlying components in undetermined time and price. Therefore the producer agent can not use formula (2) for computing the price and quality of the product. In the other hand, the customer agent can not use formula (3) for calculating announced weights for two reasons: First that (3) is achieved by game theory approach which is optimal in the sense of the producer’s strategy. As the producer agent can not operate in this way, the achieved strategy is not optimal for the customer agent. Second that in (3) it is assumed
that the customer agent knows the production cost distribution but we relax this constraint. Relaxing this constraint is rational, because the production cost is private information of the producer agent and it does not want to announce it.
Our aim is to define new strategies for the customer and producer agents based on the given model.
A. Auction Mechanism
We use sealed-bid first-price procurement auction, because it has been used in the literature more than other types. This auction is based on time and price. As the producers do not know the production cost, this auction is a common cost procurement auction. Bidder who obtains the best score in the auctioneer’s scoring rule wins the auction.
B. Customer’s Strategy
Customer customizes a product based on the quality criteria which are important for it such as beautifulness, robustness and greenness. His aim is to buy this product with lowest price, so he arranges a procurement auction.
But delivery time of product is also important quality attribute. The assemble time of product is independent of its components. For example, assembling of a fast computer with high quality components is same as the assembling of a slow computer with low quality components. Therefore, delivery time can not be directly applied through the product customization process. Therefore we should use two attributes procurement auction based on time and price. In this auction, delivery time is considered as a quality attribute and the lower delivery time means the higher quality and vice versa. Aim of customer is to obtain the product in a given quality with the lowest price. So we define the Customer’s scoring rule as follow:
p
.
w)
-
(1
|
t)
-
(1
-w
|
t)
(p,
Cost
=
+
(4) Where t and p are normalized time and price which the producer has proposed. t is in range of [0,1] and p is in range of [0,2]. We will see computation of these two parameters in next section. w is the weight which the customer has assigned to the delivery time criterion. Actually this scoring rule is the customer’s cost function and the bid which minimizes it, is the best bid.This scoring rule is composed of two clauses: the first clause determines the distance between the bid’s quality and the desired quality. The ideal of customer is to obtain the product with the desired quality, not more or less. Much quality causes the much price and less quality does not satisfy the customer. The more w indicates the more interest of the customer to the quality. Not all customers want to purchase a product with higher quality because
either they have no enough money or they have no hurry to get the product. The best bid is which satisfies exactly the customer’s trade off between time and price. For example, suppose that w is 1. It means the customer wants to obtain the product as soon as possible. The best bid is that its delivery time is minimum (0) and in this case, this clause will be zero. Now suppose that w is 0. It means either the customer has no enough money and wants to buy the product with minimum price or it has no hurry and does not want to pay extra money to obtain the product earlier. The best bid is that its delivery time is maximum (1) and in this case, this clause will be zero. The less delivery time, the more price; the customer does not want this situation. The second clause evaluates the bid’s price. The more interest to the price (the lower value of w), the more effect will be posed by the second clause in the scoring rule and vice versa.
C.Producer’s Strategy
The producer sends its bid to the auction, when it receives a new request from the customer. In this bid, delivery time and price of the product are determined. The producer does not know exact value of the obtaining time and price of components and only knows their distribution. The time and price distribution of each component is [minTimei , maxTimei] and [minPricei , maxPricei] respctively which i is component number. These distributions are supposed to be uniform distributions. After receiving the request of customer, the producer finds out the product’s components and computes the delivery time ([tmin, tmax]) and price ([pmin, pmax]) distribution of the product using the delivery time and price distribution of its components as follow:
)
(maxTime
Max
t
)
(minTime
Max
t
i max i min=
=
∑
==
n i iice
p
1 minmin
Pr
(5)∑
==
n i iice
p
1 maxmax
Pr
Where i shows the index of component which is involved in the product. The producer cannot produce the product before acquiring all of its components. Therefore, the minimum time of production is maximum of each component’s minimum obtaining time. For example, if a product has two components which the time distribution of them are [2 5] and [4 8], in the best case, it acquires the first component after 2 days and the second component after 4 days and so, the minimum time of product production would be 4 days. After computing the distributions, the producer determines the exact delivery
time and price of product based on its risk strategy. As there are mixtures and Risk Neutral Producer (RNP) and Risk Averse Producer (RAP), unlike the Wilson work, average of distribution is not optimal for RNP. However, because there is no optimal strategy achieved by game theory approach for RNP where some RAPs participate in the auction, here, the RNP considers the average of distribution despite it is not optimal.
2
/
)
t
(t
Time
2
/
)
p
(p
Price
max min max min+
=
+
=
(6)The reason that RNP does not take the customer’s preference into account is that it tries to be honest and wants to prepare the customer’s order as it is able is build it in appropriate time and price not more or less. Therefore, it considers the average of distributions because this is the best approximate of a stochastic value with uniform distribution. The RAP computes the time and price in the way that its probability in winning the auction be increased and it does not care about under estimation. So if the customer is more interested to the time rather than the price, it supposes that is able to obtain components fast and bids low delivery time, although it might not obtain components fast enough and pay a punishment for delay in delivering the product. Also if the customer is more interested to the price rather than the time, the producer supposes that is able to obtain cheap components and bids a low price, although it might not obtain cheap components and cost of production will be more than its price which leads to damage of producer. So the base price and time of production are computed as follow:
)
t
(t
.
w)
-
(1
t
Time
)
p
(p
.
w
p
basePrice
min max min min max min+
=
+
=
(7)If w is 1, Time is tmin and Price is pmax. But if w is 0, Time is tmax and basePrice is pmin.
It is rational if the producer adds sum value to the cost of product as its own profit. But only RAP adds its own profit to the base price because the RNP is assumed to be honest and announces the right information. The private profit is a percentage of the base price and is computed as follow:
basePrice
.
basePrice
Price
=
+
λ
(8)where indicates the selfishness degree of the producer γ and is in [0,1]. As is increased, it shows more γ
selfishness degree of the producer. The normalized values of t and p are computed by dividing them by (tmax - tmin) and (pmax - pmin) respectively. The normalized t is in [0,1] but the normalized p is in [0,2] because the RAP adds its own profit to the price which in the worse case, is two times of maximum base price.
After submission of all bids, the producer with the best score in the customer’s scoring rule, wins the auction and must produce the product with proposed time and price. If the producer could not produce the product in the determined time, it must pay a punishment for delay. This punishment is a percentage of the product’s price. The producer will not gain any extra direct profit if it produces product sooner than determined time, because if the customer were interested to obtain the product sooner, it would select a higher w. It seems that the best status is that the producer produces the product in determined time. But sometimes it is better for the producer to buy a component later than determined delivery time, because the value of the punishment might be less than the money, which could be saved when the producer buys the component later.
There is one two dimensional reverse auction based on time and price for each component and different suppliers bid in each of them. The producer needs all of the components to produce the product and could not produce the product until acquires all of them. So producer’s decision making in one reverse auction, is dependent to the other reverse auctions. If the product is composed of n parts and there are m suppliers for each component, there are mn different combinations for selecting suppliers. The producer has a scoring rule which assigns a score to each of these combinations:
)
,...,
(
1 n producerValue
Cost
p
p
U
=
−
(9)Where value is the money which producer earns from selling the product. Cost is money which producer pays to buy the combination of (p1,…,pn) components. This cost is the summation of whole components’ price plus the delay punishment value if there is. The producer will buy the components which maximize the scoring rule (9) from the appropriate suppliers.
C. Customer’s Strategy
Suppliers are specialized and offer only one type of component. For example, in computer industry, components such as: Hard, CPU, Keyboard and other components are supplied by different suppliers. For each component, there are several suppliers that are able to offer a component with different time and price. It is because they may be in different locations and so, the transformation cost of component varies. Moreover, they have different constrains and strategies to build a
component. Actually, each supplier is dependent to the smaller suppliers and this fact, adds the uncertainty to the chain. In this paper, we only model one level of suppliers and consider it as the abstract of further levels. There is a correlation between delivery time and price which a supplier can offer a component. The more need of producer to buy a component urgently; the much price will be posed by supplier and vice versa.
IV.PRODUCERS’STRATEGIESANALISYS In this section we analyse the strategy of RNP and the RAP to find out their winning probability in the auction. According to the scoring rule of the customer, one score is assigned to each bid of producers and the producer which its bid obtains the less score, will win the auction. Regard to (4), (7) and (8) the score which RAP obtains is:
)
/(
.
).
1
(
)
1
.(
).
1
(
−
w
w
+
λ
+
−
w
λ
p
minp
max−
p
min (10)And based on (4) and (6) the score of the RNP is:
2
/
)
1
(
|
2
/
1
|
w
−
+
−
w
(11)If we want to compare (10) and (11), values of w, , Pλ min, and Pmax must be known. Without losing generality, we suppose that the
p
min/(
p
max−
p
min)
is 1 so that ourcomputation will be independent of the product price. So (10) can be written as:
λ
λ
+
+
+
−
(
1
)
w
2w
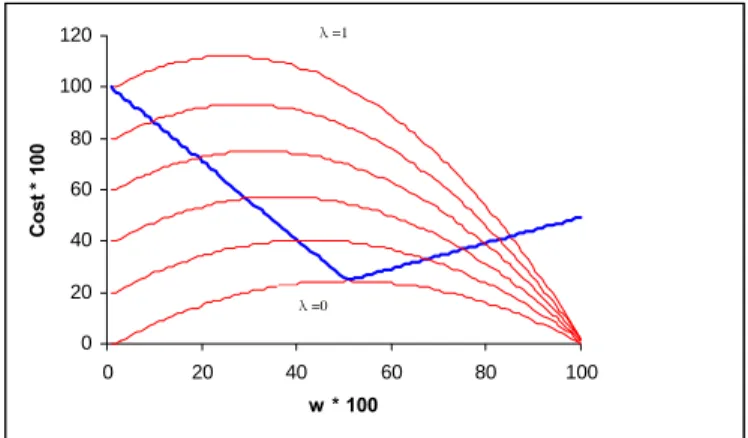
(12)In order to better comparison between (11) and (12), their curves have been drawn in Figure 1.
0 20 40 60 80 100 120 0 20 40 60 80 100 w * 100 C o st * 100
Fig. 1 Cost curves of RNP and RAP
Blue line is cost curve of RNP and the red line curves are the cost curves of RAP with different . Per each w λ
λ =0
and , λ the winner producer is which its cost is lower. When =0, the cost of RAP is always lower than the cost λ of RNP. It is because in one side, producer considers the quality of product exactly as the customer wants. So the first term of (11) is always 0, because this clause determines the distance between the desired quality and the proposed quality. In the other hand, the producer does not add any private profit to the estimated price. Therefore the customer can obtain the product with the considered quality without forcing to pay any extra overhead. When w = 1/2 both costs are equal. In this case we consider the RAP as the winner of auction. When =0.2, for Ws which λ are around 0.5, the cost of RNP is lower than the cost of RAP. It is because in this area, the RNP unintentionally considers the quality as the customer wants and, its cost is lower than the cost of RAP which adds 20 percent to the base price. This area is between the junction points of (11) and (12) which can be computed as follow:
⎪
⎪
⎩
⎪
⎪
⎨
⎧
+
−
+
+
−
=
+
+
+
+
=
)
1
(
2
25
.
2
4
5
.
2
)
1
(
2
)
1
.(
4
25
.
0
5
.
0
2 2 1λ
λ
λ
λ
λ
w
w
(13)So the wining probability of RNP is w2 – w1 :
)
1
(
2
)
1
.(
4
25
.
0
25
.
2
4
2
2λ
λ
λ
λ
+
+
+
+
+
+
−
(14)Please note that w is not known at analyse time and therefore we should compute the winning probability of RNP. This probability means the probability in which w is selected by the customer in the area that the cost of RNP is less that the cost of RAP. As is increased, the chance of λ RNP to win the auction is increased (the distance between junction points of two curves) and its maximum value is 0.84 when is 1. Note that even when = 1, for w>0.84, λ λ RAP still wins the auction. It means that the quality in this area has such importance for the customer that although the price is high, but the customer buys it. Tough with increasing of the , the chance of RAP in winning λ of the auction is decreased (Figure 2), but its own profit is increased. It means that the producer wins the fewer auctions but earns more profit from selling of each product. To draw the profit diagram of RAP, we compute the average of its profit by multiplying its winning probability to the value of profit. The winning probability is complement of (14) and the value of profit is (8). Because we are computing the average of profit, we consider w in (12) as 0.5. This diagram is shown in the figure 3. 0 20 40 60 80 100 0 20 40 60 80 100 λ * 100 W in n in g P rob ab il it y o f R A P
Fig. 2 Winning Probability of RAP is decreased by increasing of λ. At first, as is increased, producer’s profit is λ increased too, because the producer earns more profit from selling of each product, although it wins fewer auctions. But after a point, this profit starts to decreasing, because the producer wins fewer auctions, although it earns more profit from selling of each product.
0 1000 2000 3000 4000 0 20 40 60 80 100 λ * 100 Pr o fit
Fig. 3 Effect of increasing of λ on RAP’s profit VI.CONCLUSION AND FUTURE WORK
In this paper, we developed a new multi attributes procurement auction. It is new because it has been defined for a special model of supply chain, customer has a new scoring rule, and producers have new strategies for biding. Multi Attribute Procurement Auction is a good solution for Supply Chain problem which fits its requirements, but has not been noticed well in this context. For example, If we consider the today model of supply chain, there is no MAPA which provides optimal strategy for customer and producer if both RAP and RNP participate in the auction. In this paper, we tried to define a new MAPA which is usable under the new model of supply chain. In this MAPA, the producer could have two different strategies based on its risk attribute. These two strategies are compared mathematically and also in a simulation. As the
future work, we can define solutions by game theory approach in order to obtain the optimal strategies for customer and producer.
REFERENCES
[1]. L. Rocha-Mier. “Global Supply Chain Management based on Collective Intelligence”. Second world conference on pom and 15th pom conference, cancun, mexico, 2004.
[2] Y. Smet, “Butterfly Auction: Clustering the Bidding Space”, In Proceeding of sixth International Conference on Electronic Commerce Research, Dallas, 2003.
[3] P. David, J. Kalagnanam, “Iterative Multi-Attribute Vickery Auction”, IBM Research mimco, 2002.
[4] P. A. Haile, H. Hong and M. Shum, “Nonparametric Tests for Common Values In First-Price Sealed-Bid Auctions”, November 2003.
[5]. Y.-K. Che, "Design Competition through Multidimensional Auctions," RAND Journal of Economics, vol. 24, pp. 668-680, 1993. [6]. J. G. Riley and J. G. Samuleson, "Optimal auctions," American
Economic Review, vol. 71, pp. 381-392, 1981.
[7]. F. Branco, "The Design of Multidimensional Auctions," RAND Journal of Economics, vol. 28, pp. 63-81, 1997.
[8]. J. Teich, H. Wallenius, and J. Wallenius, "Multiple-issue auction and market algorithms for the world wide web," Decision Support Systems, vol. 26, pp. 49-66, 1999.
[9]. N. Vulkan and N. R. Jennings, "Efficient mechanisms for the supply of services in multi-agent environments," Decision Support Systems, vol. 28, pp. 5-19, 2000.
[10]. E. David , R. Azoulay-Schwartz , S. Kraus, “Bidders' strategy for multi-attribute sequential english auction with a deadline”,
Proceedings of the second international joint conference on Autonomous agents and multiagent systems, July 14-18, 2003,
Melbourne, Australia
[11] S. Fatima, M. Wooldridge, and N. R. Jennings, “Sequential auctions for objects with common and private values”, In Proceedings of the Fourth International Conference on Autonomous Agents and Multi-Agent Systems, Utrecht, Netherlands , 2005.
[12]. W. Bourke. “Mass Customization- Survival and growth in the ‘To-Order’ Sector. Production Information Management”,1999.
[13]. F. T. Piller, R. Reichward. Leading Mass Customization and Personalization from an Emerging Stage to a Mainstream Business Model. 2nd
interdisciplinary world congress on mass customization and personalization. 2003.
[14]J. Collins, R. Arunachalam, N. Sadeh, “The Supply Chain Management Game for the 2005 Trading Agent Competition”, December 2004.
[15]. Y. Yaoun, T.P Liang, J.J. Zang, “Using Agent Technology to Support Supply Chain Management: Potentials and Challenges”,
http://merc.mcmaster.ca/workingpapers.html