The role of intermediate trade in the change of carbon flows
within China
Jing Meng, Zengkai Zhang, Zhifu Mi, Laura Diaz Anadon, Heran
Zheng, Bo Zhang, Yuli Shan, Dabo Guan
PII:
S0140-9883(18)30405-5
DOI:
doi:
10.1016/j.eneco.2018.10.009
Reference:
ENEECO 4180
To appear in:
Energy Economics
Received date:
11 January 2018
Revised date:
27 September 2018
Accepted date:
5 October 2018
Please cite this article as: Jing Meng, Zengkai Zhang, Zhifu Mi, Laura Diaz Anadon,
Heran Zheng, Bo Zhang, Yuli Shan, Dabo Guan , The role of intermediate trade in the
change of carbon flows within China. Eneeco (2018), doi:
10.1016/j.eneco.2018.10.009
This is a PDF file of an unedited manuscript that has been accepted for publication. As
a service to our customers we are providing this early version of the manuscript. The
manuscript will undergo copyediting, typesetting, and review of the resulting proof before
it is published in its final form. Please note that during the production process errors may
be discovered which could affect the content, and all legal disclaimers that apply to the
journal pertain.
ACCEPTED MANUSCRIPT
The role of intermediate trade in the change of
carbon flows within China
Jing Meng a,b, Zengkai Zhang c, Zhifu Mid*, Laura Diaz Anadon b, Heran Zheng e, Bo Zhangf, Yuli Shane, Dabo Guane*
a
Department of Politics and International Studies, University of Cambridge, Cambridge CB3 9DT, UK
b
Cambridge Center for Environment, Energy and Natural Resource Governance, Department of Land Economy, University of Cambridge, Cambridge, CB3 9EP, UK c
College of Management and Economics, Tianjin University, Tianjin 300072, China d The Bartlett School of Construction and Project Management, University College
London, London, WC1E 7HB, UK e
Water Security Research Centre, School of International Development, University of East Anglia, Norwich, UK
f
School of Management, China University of Mining & Technology (Beijing), Beijing, 100083, PR China
ABSTRACT
In recent years, evaluating the emissions embodied in trade (EEIT) has become an important area of policy and research. Multiregional input-output (MRIO) analysis, which links producers and final consumers, is a widely-used method for quantifying the EEIT. However, the role of intermediate trade in driving changes in the EEIT is still not fully incorporated in MRIO analysis and as a result poorly understood. Here, we present a framework that separately identifies the drivers of the emissions embodied in the trade of final and intermediate products. We implement this framework in a case study in which we analyse the changes in CO2 emissions embodied in interprovincial trade in China from 2007 to 2012. We find that the largest changes are a rising final demand, which is associated with increased emissions that are to some extent offset by decreasing emissions intensity and changing interregional dependency. Regionally, the rising imports and the growth in final demand in less developed regions in the north and central (e.g.,
* Corresponding author at: The Bartlett School of Construction and Project Management, University College London, London, WC1E 7HB, UK.
ACCEPTED MANUSCRIPT
Hebei and Henan) reduced the CO2 emissions outsourced by central coastal regions and drove the traded embodied CO2 flows between the central and western regions. The framework enriches our understanding of the role played by intermediate trade in the relocation of emissions.
KEYWORDS: Structural decomposition analysis; multiregional input-output analysis; CO2; Trade; intermediate products
Highlights
We present a framework that splits the emissions flow between the original emission sources and final consumers.
We decompose the change in emissions flow embodied in final and intermediate products.
The framework can enrich our understanding of the role played by intermediate trade. We analyse the changes in CO2 emissions embodied in interprovincial trade in China
ACCEPTED MANUSCRIPT
1. Introduction
Along with rapid growth in economic activity, humanity’s demand for resource endowments (e.g., energy, water, land and biodiversity) has increased substantially, particularly over the past 20 years (Wu and Chen 2017; Yu et al. 2013; Chen et al. 2018) Since globalisation entails the separation of production and consumption, a key consideration when calculating national emissions is whether to use production-based or consumption-based accounting principles (Davis and Caldeira 2010a; Peters et al. 2011). The difference between these two accounting methods is given by the emissions embodied in trade (EEIT). It is increasingly recognised that changes in trade patterns and volume have considerable effects on regional resource consumption and EEIT (Meng et al. 2016; Lenzen et al. 2013; Lenzen et al. 2012; Oita et al. 2016). Thus, evaluating EEIT has become a hot issue in policy and research. The predominant approaches for measuring EEIT are the emissions embodied in bilateral trade (EEBT approach) and the multiregional input-output analysis (MRIO) approach (Peters 2008). The EEBT approach has the same geographic limits as single region input-output (SRIO) analysis cannot identify the final consumers of products (Peters and Hertwich 2008; Zhang et al. 2014; Su and Ang 2013). The MRIO approach endogenously determines intermediate trade for further processing and links the consumption of finished goods (i.e., final demand, as opposed to the intermediate products) to the original source of physical production. The main difference between MRIO and EEBT, i.e., a country's indirect absorption patterns and its indirect trade balance of emissions from bilateral trade with other countries, has clearly been addressed by Su and Ang (2011). Recently, MRIO is widely used to measure the emissions that are generated to satisfy the needs of consumers in a region, regardless of the location of generation (Davis and Caldeira 2010b).
Previous studies have reported that CO2 emissions embodied in international trade and interregional trade changed dramatically in the past decade (Mi et al. 2017b; Peters and Hertwich 2008; Arto and Dietzenbacher 2014). Similar patterns have also been observed for many environmental issues, such as air pollution (Moran and Kanemoto 2016; Li et al. 2018; Malik et al. 2016), energy (Su and Ang 2012), and raw material (Weinzettel and Kovanda 2011). Thus, there have been attempts to quantify the contribution of socioeconomic drivers to the change in EEIT (Malik and Lan 2016; Arto and Dietzenbacher 2014) by using structural decomposition analysis (SDA) (Dietzenbacher and Los 1998). These studies typically considered the Leontief inverse matrix effect, which reflects the intra- and inter-regional dependency of sectors as one factor reflecting the entire supply chain. However, these decompositions considering Leontief inverse matrix as a factor provide insufficient information on the role of
ACCEPTED MANUSCRIPT
intermediate products in embodying and driving the EEIT (Meng et al. 2016; Li et al. 2016; Liu et al. 2016; Davis and Caldeira 2010b)
In a world characterised by fragmented interregional production processes along the value chain of final products, trade in intermediate products--the parts and materials imported to make products for consumption domestically and abroad--reflects the interregional dependency of production and is a growing force in interregional trade (De Backer and Yamano 2011; Sturgeon and Gereffi 2009). More than half of the CO2 emissions embodied in international and interprovincial trade in China have been attributed to trade in intermediate goods (Davis and Caldeira 2010a; Feng et al. 2013). The growth in intermediate trade has been boosted by localizing stages of production in different regions and integrating them into global value chains (Meng et al. 2017). Lower trade barriers and falling communication and transportation costs have enabled the unbundling of factories and offices (Baldwin 2006), meaning that production and service activities can be more broadly distributed within a country or traded globally. In turn, it is likely that if there are increasing anti-globalisation and protectionist measures and if regional gaps in labour cost or production efficiencies shrink, the growth of intermediate trade will slow down. Thus, a better understanding of the CO2 emissions embodied in intermediate trade can provide insights into the environmental impacts of how production chains develop and of government policies to shape such production chains. However, the MRIO framework determines intermediate trade products endogenously as part of global supply chain. As a result, it is difficult to distinguish the effect of changes in intermediate trade structures from the whole production supply chain within the traditional MRIO approach.
To address this limitation in the MRIO framework, in this study, we quantify the socioeconomic contributions to change in CO2 emissions among 30 provinces in China from 2007 to 2012, with a particular emphasis on the impact of changes in traded intermediate products for further processing and final products. This approach involves two steps. Focusing on the change in trade, we first split EEIT between regions (e.g., from
r to s) into three parts: (a) emissions released in region r due to the export of final products to s (first part), (b) emissions from the exported intermediate products related to goods consumed in region s, which are finalised in region s (second part), and (c) finalised in regions other than r and s (third part)). The second step is to decompose the three parts separately to quantify the driving forces of change in the emissions embodied in traded intermediate and final products.
This paper is organised as follows. In Section 2, we conduct a brief literature review on the MRIO-based SDA studies. In Section 3, we provide an introduction to MRIO-based SDA methodology, including a detailed mathematical formulation of the framework. In Section 4, we present the analysis of the drivers of changes in emissions embodied in China’s interprovincial trade from 2007 to 2012. Section 5 includes a discussion and
ACCEPTED MANUSCRIPT
conclusions.2. Structural Decomposition Analysis
Index decomposition analysis (IDA) and structural decomposition analysis (SDA) are two methods to quantify the driving factors behind the evolution of a dependent variable. SDA enables us to distinguish between a range of production effects and final consumption effects that IDA fails to capture (Feng et al. 2012; Ang 2004; Ang 2005). Moreover, SDA is capable of assessing both direct and indirect effects along entire supply chains (Miller and Blair 2009). Therefore, SDA has been widely used for identifying the drivers of changes involved in a range of environmental issues, such as energy use (Su and Ang 2012), CO2 emissions (Guan et al. 2008; Mi et al. 2017a; Mi et al.), air pollution (Liang et al. 2013; Guan et al. 2014a), water use (Roson and Sartori 2015), raw materials (Weinzettel and Kovanda 2011), and nitrogen emissions (Wier and Hasler 1999). SDA breaks down changes over time in a dependent variable into contributions from underlying factors, such as technological change, affluence, and population growth. These factors can act as either accelerators or retardants.
Most SDA-related studies have focused on changes in endowments in individual regions (Su and Ang 2012), such as China (Mi et al. 2017a; Guan et al. 2008; Guan et al. 2009; Guan et al. 2014a; Chang and Lahr 2016), the United States (Feng et al. 2015; Liang et al. 2016), the United Kingdom (Baiocchi and Minx 2010), Spain (Cansino et al. 2016) and Norway (Yamakawa and Peters 2011). These studies typically explain changes in the ‘national’ budget of particular endowments as the sum of changes in underlying factors, such as the use of endowments, the Leontief inverse matrix, the commodity shares of final demand, the final demand category, the per capita total final demand and the population. However, SDA approaches applied in single region input-output (SRIO) analysis come with some limitations; e.g., it provides few insights into interregional trade.
To incorporate interregional trade, a series of recent studies have conducted MRIO-based SDA to quantify the drivers of energy uses and CO2 emissions (Arto and Dietzenbacher 2014; Lenzen 2016). Within the MRIO framework, the changes in EEIT can be decomposed both structurally and spatially, thus highlighting the effects of regional industrial structure on interregional trade patterns. Jiang and Guan (2016), Lan et al. (2016) and Malik and Lan (2016) identified the drivers of the global and regional energy and CO2 footprints within an MRIO framework. They analyzed more than 180 countries, and separated domestic and trade effects. However, they did not explore the relationship between drivers and changes in bilateral energy or CO2 transfer.
Recently, there have been some advances in the decompositions of emissions embodied in intermediate and finished products or services (Meng et al. 2017). Xu and
ACCEPTED MANUSCRIPT
Dietzenbacher (2014) and Wu and Wang (2017) quantified the contribution of socioeconomic factors to changes in EEIT, in which the EEIT for a region means all the emissions embodied in products finalised and exported from this region to final consumers in other regions. This definition is different from that in the MRIO framework, which attributes the emissions associated with consumed goods to the original source that produced the emissions. In parallel, Hoekstra et al. (2016) evaluated the effects of changes in trade patterns by separating the exporters and importers into several groups of countries. This paper highlighted the importance of changes in outsourcing patterns and provided evidence that exploring intermediate trade patterns can provide substantial insights into the effect of different trade parts. Further, Zhang et al. (2017) divided the emissions embodied in bilateral trade by the border-crossing frequency associated with traded products, and decomposed the change in CO2 flows embodied in international trade from 1995 to 2009. The novelty of this latter study is that it evaluates the CO2 emissions flow between the original emitters and the final consumers, which coincides the essence of MRIO framework.
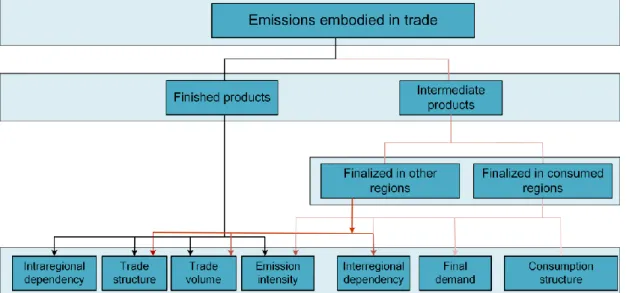
Our approach focuses on the factors shaping to the original source that produces the emissions and the final consumers. Thus, we use SDA to disentangle the changes in emissions embodied in three parts of interprovincial trade patterns from 2007 to 2012 in China (Dietzenbacher and Los 1998). These three parts include emissions from producing finished goods ( ) and emissions from producing intermediates for
further processing ( and ). and represents the emissions associate with the products finalised in region s (domestic) and the third regions (such as k), respectively. is decomposed into four factors, specifically emissions intensity (CO2/output), intraregional dependency (interaction of
sectors within the same region), trade volume (which includes only traded finished goods unless otherwise noted) and trade structure (which includes only traded finished goods unless otherwise noted). is decomposed into four factors, specifically emissions intensity, the interregional dependency (i.e., intermediate exports for further processing), the final demand and the consumption structure. is decomposed into the four factors: emissions intensity, the interregional dependency, trade volume and trade structure.
( ) rs fin f ( - ) rs int D
f frs(int M- ) frs(int D- ) frs(int M- )
( ) rs fin f ( - ) rs int D f ( - ) rs int M f
ACCEPTED MANUSCRIPT
3. Methodological description
3.1 Emissions embodied in trade
Originally developed by Leontief (Leontief 1941), environmental input-output analyses (EIOs) (Leontief 1970) have been widely used to illustrate the economy-wide environmental repercussions triggered by economic activities (Meng et al., 2015). By extending EIOs to MRIO analyses, this method has been widely used to analyse the interconnection of sectors in different regions with respect to various environmental changes (Wiedmann 2009; Minx et al. 2009; Davis and Caldeira 2010b; Meng et al., 2018a, 2018b). This paper uses the MRIO framework, which endogenously determines interregional trade, to analyse the CO2 emissions embodied in interregional trade in China. The MRIO framework with m regions and n sectors in each region begins with the accounting balance of monetary flows between industrial sectors and regions:
1 1 11 12 1 1 2 2 21 22 2 2 1 2
r m r r m r m m m mm m mr r y y y x A A A x x A A A x x A A A x(1)
where xs is a vector (n×1) representing the sectoral total outputs in region s (s=1,2, ⋯, m); is a matrix (n×n) representing the coefficients of industry requirements for inputs from region r to s to produce one unit of output. The element of is calculated by , where (i, j=1, ⋯,n ) represents the inputs from sector i
in region r to sector j in region s; is a n×1 matrix, representing the final supply demand from region r to s (s=1,2, ⋯, m); when r=s, means local consumption.
can also be divided into urban consumption, rural consumption, government consumption, capita formation and inventory growing. Then we use X, A and Y to represent the global economy matrix. Moreover, m is158 in 2007 and 169 in 2010 and 2017, and n is 30 for Chinese regions and 57 for other regions, the equation (1) can be rearranged as,
1
(
)
=
X
I A
Y LY
(
2
)
where L= (I-A)-1 is a g×g (g=m×n) Leontief inverse matrix, which captures both the direct and indirect inputs required to satisfy one unit of final demand in terms of
rs
A
rsA
/
rs rs s ij ij ja
z
x
rs ijz
rs y rs y rs yACCEPTED MANUSCRIPT
monetary value. g is the total number of the sectors in the focused economies (m
regions and n sectors in each region). is a n×n matrix. This study aims to provide a framework to analyse the drivers of the changes in EEIT and focuses on interprovincial trade only. Y is a g×m final demand matrix. Using this framework, CO2
emission transfers from region r to region s can be calculated as follows:
rs
r(
)
1 s=
r rk ksk
f
e I A
y
e L y
(3)
where is a n×1 matrix , calculated as each sector’s CO2 emissions divided by that
sector’s total output (Lin et al. 2014), means direct emission intensity matrix. is adiagonal n×n matrix.
3.2 Structural decomposition analysis
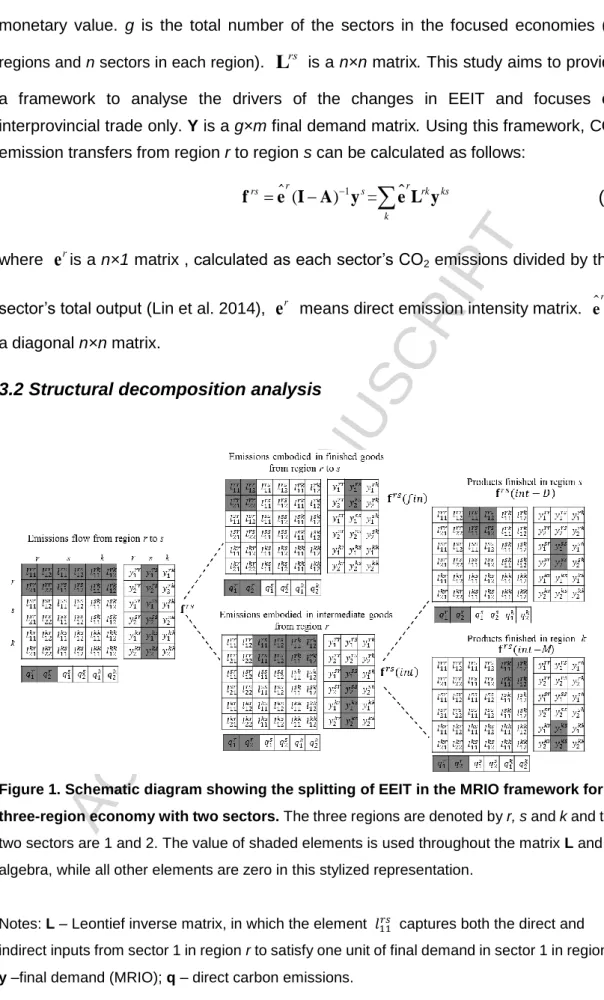
Figure 1. Schematic diagram showing the splitting of EEIT in the MRIO framework for a three-region economy with two sectors. The three regions are denoted by r, s and k and the two sectors are 1 and 2. The value of shaded elements is used throughout the matrix L and y
algebra, while all other elements are zero in this stylized representation.
Notes: L – Leontief inverse matrix, in which the element 𝑙11𝑟𝑠 captures both the direct and
indirect inputs from sector 1 in region r to satisfy one unit of final demand in sector 1 in region s;
y –final demand (MRIO); q – direct carbon emissions.
MRIO attributes the emissions associated with consumed goods to the original
L
rse
rACCEPTED MANUSCRIPT
sources of the emissions (Davis and Caldeira 2010b). Focusing on the role of different trade patterns on the change in EEIT, we first split EEIT between regions (e.g., from r to s)
into three parts (Figure 1). Here, refers to the emissions embodied in the products finalised in region r and imported by region s (i.e., the final demand). Note that region r is the final producer, and these final products are directly used by region
s and do not enter any further production stages. refers to the emissions embodied in the intermediate products exported by region r to other regions for further production and finally consumed in region s. Region r is part of a supply chain, rather than the final producer. According to the destination of the final producer in the supply chain, can be further divided into and .
represents the emissions released in region r induced by products finalised in region s
and consumed in region s. represents the emissions released in region r
induced by products finalised in region k (k=1,2, ⋯, m and k≠r, s) but consumed in region s. Isolating the three parts of the EEIT allows us to assess the roles of intermediate and final products in driving the EEIT.
Figure 2. Schematic of MRIO-based structural decomposition models in this study.
This study divides into three parts (equation (5) and equation (6)) to study the emissions embodied in different production processes.
(
)
(
)=
(
)
(
- )
(
-
)
rs rs rs rs rs rs
fin
int
fin
int D
int M
f
f
f
f
f
f
(4)
( ) rs fin f ( ) rs int f ( ) rs intf frs(int D- ) frs(int M- ) frs(int D- )
( - ) rs int M f rs
f
ACCEPTED MANUSCRIPT
(
)
r rs rr rsfin
f
e L y
(5)
, ( ) = = ( - ) ( - ) r rs rk ks i ij i i k r r re ss r rk ks i ij i ij i i i i k r s rs rs int int D int M
f e L y e L y e L y f f(6)
where Lrk represents both the direct and indirect inputs from region r to satisfy one unit of final demand in region k; Lrrrepresents the local part of the supply chain, reflecting the intraregional dependency. As shown in Figure 1, to split the and Y, we keep the values for the shaded elements in the matrix but make all other elements zero. The split of
, and Y changes the value of matrix rather than size of matrix.
The three parts of EEIT are decomposed separately as below:
(
)
r rs rr rs rs i ij j j i jfin
f
e L T m
(7) ,s(
)
+
=
(
- )
(
-
)
m r r rs rs ss ss rk ks ks i ij j j i ij j j i j i j k r rs rsint
int D
int M
f
e L C y
e L T m
f
f
(8)where is the share of the exports of products in sector j in region s that are imported from region r, representing the trade structure (which includes only traded finished goods unless otherwise noted); represent the import volume (final
demand) for products in sector j in region s from region k; is the share of the final demand in region b for products in sector j in region k, representing the consumption structure (Figure 2). and characterize the final products that
are directly imported from region r by region s (yrs).
T
ksj andm
ksj characterize the final products imported from region k by region s (yks)that also induce emissions in regionr.
Thus, the growth in the emission transfers between two regions in two points in time (indicated by the subscripts 0 and 1) can be expressed as .
L
e
L rs jT
rs jm
ss jC
rs jT
m
rsj 1 0 rs rs rs
f
f
f
ACCEPTED MANUSCRIPT
However, a unique solution for the decomposition is not available (Dietzenbacher and Los 1998; Guan et al. 2014b; Peters et al. 2007; Hoekstra and Van den Bergh 2003). For a case including m factors, the number of possible complete decompositions without any residual terms is m! (Dietzenbacher and Los 1998). We follow the methods used in previous studies and use the average of the so-called polar decompositions to approximate the average of all m! decompositions (Dietzenbacher and Los 1998; Arto and Dietzenbacher 2014). The two polar decompositions (
and ) are as follows:
0 1 1 1 1 1 0 0 1 0 0 0 ( ) ( ) ( ) ( ) ( ) = r r rs rr rs rs rr rs rs i ij j i ij j i j i j r rr rs rs r rr rs rs i ij j i ij j i j i j fin
f e L T m e L T m e L T m e L T m E P T M (9a)0 1 1 1 1 1 0 0 1 0 0 0 ( -D) ( ) ( ) + ( ) ( ) = r r rs rs ss ss rs ss ss i ij j i ij j i j i j r rs ss ss r rs ss ss i ij j i ij j i j i j int
f e L C y e L C y e L C y e L C y E S C Y(9b) 0 1 1 1 1 1 , s , s 0 0 1 0 0 0 ,s ,s ( ) ( ) ( ) + ( ) ( ) = r r rs rk ks ks rk ks ks i ij j i ij j i j k r i j k r r rk ks ks r rk ks ks i ij j i ij j i j k r i j k r int M
f e L T m e L T m e L T m e L T m E S T M (9c) 1 0 0 0 0 0 1 1 0 1 1 1 ( ) ( ) ( ) ( ) ( ) = r r rs rr rs rs rr rs rs i ij j i ij j i j i j r rr rs rs r rr rs rs i ij j i ij j i j i j fin
f e L T m e L T m e L T m e L T m E P T M (10a) 1 0 0 0 0 0 1 1 0 1 1 1 0 ( - ) ( ) ( ) + ( ) ( ) = r r rs rs ss ss rs ss ss i ij j i ij j i j i j r r rs ss ss rs ss ss i ij j i ij j i j i j int D
f e L C y e L C y e L C y e L C y E S C Y (10b) rs f rs fACCEPTED MANUSCRIPT
1 0 0 0 0 0 , , 1 1 0 1 1 1 0 , , ( - ) ( ) ( ) + ( ) ( ) = r r rs rk ks ks rk ks ks i ij j i ij j i j k r s i j k r s r r rk ks ks rk ks ks i ij j i ij j i j k r s i j k r s int M
f e L T m e L T m e L T m e L T m E S T M (10c)The average of the polar decomposition is determined as follows (Dietzenbacher and Los 1998): 1 ( ) [ ( ) ( )] 2 1 1 1 1 ( ) ( ) ( ) ( ) 2 2 2 2 = rs rs rs
fin fin fin
f f f e e S S T T m m E P T M
(11a)
1 1 ( ) [ ( - ) ( )]+ [ ( ) ( )] 2 2 = rs rs rs rs rs
int int D int D int M int M
f f f f f
E S C Y T M
(11b)
where is the growth in emission transfers between two regions from 2007 to 2012. This quantity is decomposed into seven determinants:
(1) , the effect of emission intensity change; technological changes or energy mix improvements leading to changes in emissions per unit of output.
(2) , the effect of intraregional dependency, i.e., the inputs required in sector i in region r to produce per unit of output in sector j in in region r.
(3) , the effect of interregional dependency (i.e., intermediate trade) change; the inputs required in sector i in region r ( ,) to produce per unit of output in sector j in region s. A positive effect of on the exports of region r indicates that more products in region r are needed to produce unit output in other regions.
(4) , the effect of trade structure change (final products); the proportion of (final) products produced in sector j exported from region r to region s in the (final) total trade volume from r to region s. The trade structure in equation (11a) and (11b) characterize different parts of trade.
(5) , the effect of trade volume change (final products); the trade volume of final products from region r to region s.Unless stated otherwise, the trade volume and trade structure reported hereinafter correspond only to finished products for final consumption and do not include trade in intermediate goods that are used in further production stages. The trade volume in equation (11a) and (11b) characterize different parts of trade.
(6) , the effect of consumption structure change; the proportion of the final demand for products in sector j in region s.
rs f E P S r s S T M C
ACCEPTED MANUSCRIPT
(7) , the effect of local consumption change, we further split the consumption to household consumption, government consumption and capital investment.
3.3 Data sources
The underlying data in this case study implementing the framework includes data for 26 provinces and 4 cities (30 regions in total). A multiregional input-output table (MRIOT) for China in 2007 was compiled by Liu et al. (2012) and has been widely used in previous studies (Li et al. 2016; Feng et al. 2013; Feng et al. 2014; Shao et al. 2016; Chen and Chen 2016). The 2012 input-output tables (IOTs) for each of the 30 provinces of China except Tibet were compiled and published by the Chinese National Statistics Bureau. The 42 industrial sectors in the official 2012 IOTs are aggregated into 30 sectors (Table S1 in Supporting Information) to maintain consistency with the 2007 MRIOT. We then link the Chinese MRIOT to global MRIO models which are derived from version 9 of the GTAP database (Aguiar et al. 2016). This linked table has been complied built in our previous paper—this paper does not repeat the details here (Mi et al. 2017b). To improve the clarity of the analysis, the results for the 30 regions are aggregated into 8 regions (Table S2). We adopt the same method used in Liu et al. (2012) to derive the MRIOT for 2012 (Mi et al., 2017); details of this procedure are given in previous studies (Feng et al. 2013; Liu et al. 2012; Mi et al. 2017b). The MRIO table is publicly available online (http://www.ceads.net/data/input-output-tables/). To remove the impact of inflation on the monetary output, we use the producer price index (PPI) from the National Account Main Aggregates Database to convert the 2012 table, adjusting all of the monetary data based on prices in 2005 to provide a consistent analysis.
Since the Chinese government does not publish annual CO2 emissions
inventories, we estimate sectoral CO2 emissions of the 30 provinces based on China’s
provincial energy statistics and the IPCC territorial emissions accounting approach (Shan et al. 2016; Shan et al. 2017; Guan et al. 2018). All of the emissions data we use to construct the dependent variable of EEIT are freely available from the China Emission Accounts and Datasets (CEADs; http://www.ceads.net/). The CO2
emissions for all other regions are from GTAP database (Narayanan et al. 2015).
4. Results
4.1 Changes in emissions embodied in interprovincial trade
We find that while emissions embodied in interprovincial trade witnessed a slight increase from 2007 to 2012, the pattern of EEIT flows within China changed dramatically. In 2007, 35.9% or 2211 Mt (million tons) of CO2 emissions resulting from
ACCEPTED MANUSCRIPT
fossil fuel combustion were generated during the production of goods or services that were ultimately consumed in other provinces in China. Further, 24.2% or 1491 Mt were related to the products finally consumed by foreign countries. The dominant feature from the 2007 analysis is that the final consumption in Beijing-Tianjin, the Central Coast region, and the South Coast region relies on emissions generated in less developed regions in China through the imports of large amounts of products (Figure 3) (Feng et al. 2013; Mi et al. 2017b). In 2012, the emissions embodied in interprovincial trade and international trade grew up to 2879 Mt, but accounted for a smaller share of national emissions (34.0% vs. 35.9% in 2007). In contrast, the emissions embodied in international trade declined to 1384 Mt (16.4% vs. 24.2% in 2007).
The interprovincial emissions flow in China also changed dramatically from 2007 to 2012.The net emissions outflow equals to the emissions embodied in exports (EEE) less the emissions embodied in imports (EEI). The net emissions outflow in Shanghai and Zhejiang increased from -106 and -118 Mt to -9 Mt and -65 Mt, respectively (Figure S1). As shown in Table 1, among the top 10 largest net emissions flow, five of them relate to the emissions imported by Central Coast in 2007, while that is only one in 2012. The dominant feature is that net exported emissions from Central and Northern regions to Shanghai and Zhejiang declined substantially.
The net emission outflow between the Northern and Central regions increased substantially. In contrast, the Southwestern and South Coast regions tended to outsource larger amounts of emissions to Jiangsu and Inner Mongolia (Figure S1). The net emission outflow from Hebei to Henan, from Anhui to Jiangxi, and from Hebei to Shandong increased from 1.5 Mt, 2.4 Mt and 3.8 Mt to 15.9 Mt, 14.9 Mt and 15.1 Mt, respectively. Surprisingly, Henan ceased to be a net exporter and became a net importer; its net exported emissions decreased by 83 Mt. To explain the change of emission flows, we decompose the changes into several factors.
Table 1
Top 10 net emissions flow in 2007 and 2012 (Mt).
2007 2012 From-To Top Net Flow (Mt) From-To Top Net Flow (Mt) Inner Mongolia-Jilin 39.7 Inner Mongolia-Shandong 20.2
Hebei-Zhejiang 27.5 Inner Mongolia-Beijing 19.3
Shanxi-Shandong 23.02.9 Shanxi-Shandong 16.5
Inner Mongolia-Shandong 19.3 Hebei-Henan 15.9
Henan-Zhejiang 18.6 Hebei-Shandong 15.1
ACCEPTED MANUSCRIPT
Jiangsu-Zhejiang 17.4 Hebei-Beijing 13.3
Hebei-Shanghai 15.53 Hebei-Zhejiang 13.0
Hebei-Jiangsu 15.04.9 Inner Mongolia-Henan 12.9
Yunnan-Guangdong 13.1 Guizhou-Chongqing 11.9
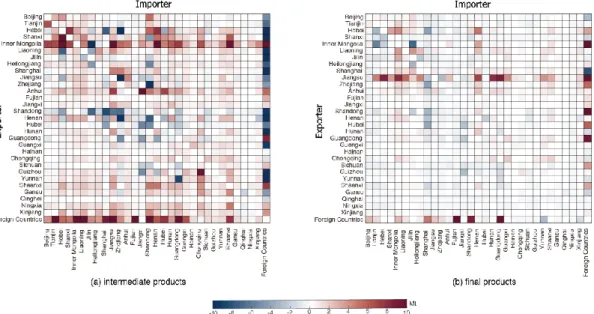
By isolating the trade patterns, the reversing interprovincial flows are mainly attributed to change in traded intermediate products. Totally, 82% (553 Mt) of the changes in emissions embodied in interprovincial trade are because of intermediate products. For the Central Coast region, emissions embodied in intermediate products in 2007 were closely related to final consumption in Shanghai (103 Mt) and Zhejiang (172 Mt), which declined to 679 Mt and 1317 Mt in 2012, respectively. The largest decreases were associated with the intermediate products exported by Shandong, Hebei and Henan (Figure 3a). In contrast, the southwestern and South Coast regions generally outsourced larger amounts of emissions to Jiangsu and Inner Mongolia (Figure 3 and Supporting Data). The emissions related to the production of intermediate exports in Inner Mongolia and Anhui increased from 164 Mt and 53 Mt in 2007 to 349 Mt and 155 Mt in 2012. More than half of the change in emissions embodied in finished products related to Jiangsu’s exports, which increased from 38 Mt in 2007 to 110 Mt in 2012. For the emissions embodied in international trade, the rapid decline in emissions embodied in intermediate trade (-184.8 Mt) outpaced the increase in final trade (74.4 Mt). This indicates the shift of production of intermediate products from north and central regions in China to other countries (Meng et al. 2018). Notably, the emissions embodied in Shanghai’s exports of final products also declined from 2007 to 2012.
ACCEPTED MANUSCRIPT
exporters and importers. (a) Changes in emissions embodied in intermediate products; (b) changes in emissions embodied in final products.
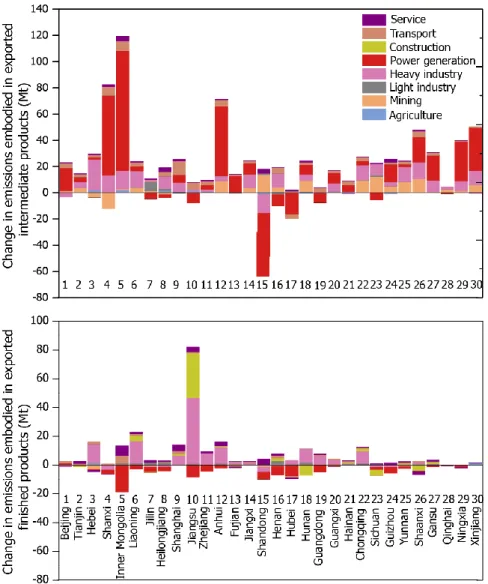
Figure 4 shows the sectoral contributions to reversing flows between provinces within China. Electricity was one of the essential inputs for many industries. Changes in emissions related to intermediate trade were mainly attributed to power generation (Figure 4a). For example, 86.4%, 76.4% and 74.4% of the increase in emissions embodied in intermediate exports from Shanxi, Inner Mongolia and Anhui occurred in power generation sector. By contrast, majority of the change in emissions embodied in finished goods related to heavy industry, such as equipment and machinery. Moreover, 40% of the total increase in emissions embodied in exported finished products were in Jiangsu, because of the substantial increase in exported products in heavy industries and construction (Figure 4).
ACCEPTED MANUSCRIPT
Figure 4. Changes in emissions embodied in exported intermediate products (a) and finished products (b) to other provinces by sector.
4.2 Socioeconomic contributions to Changes in regional exported
emission
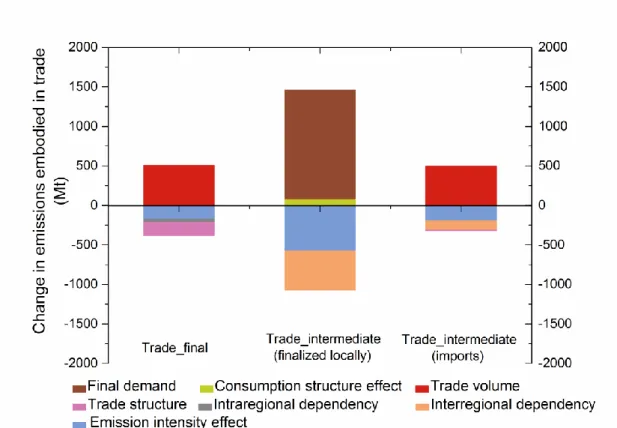
The rising final demands for local finalised products had greater effect than imported products on the increase in emissions embodied in trade (Figure 5), which contributed 1379 Mt and 1000 Mt, respectively, if other factors were constant. The negative effect of interregional dependency change indicated that the fragmented production has upgraded or transferred to the regions with lower emission intensities. Overall, growth in the EEIT was mainly driven by increasing final demand and trade in final products and was partly offset by improvements in emission intensity.
Figure 5. Contributions to changes in emissions embodied in interprovincial trade in China (Mt).
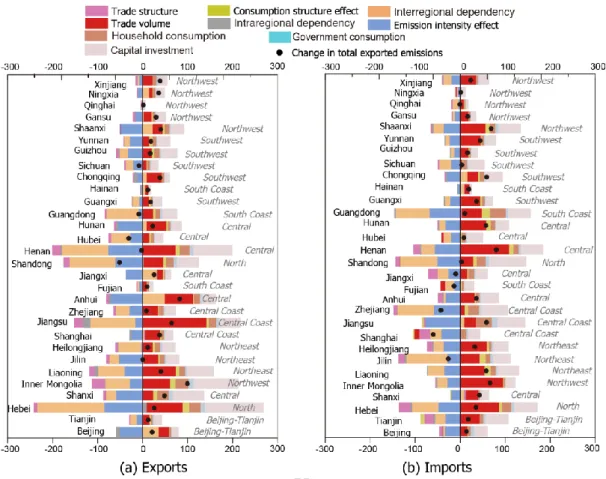
Regionally, the socioeconomic drivers exerted different effects across regions. Figure 6 shows the contribution of each factor to the changes in emissions embodied in exports (a) and imports (b). Inner Mongolia, Anhui, and Jiangsu witnessed the
ACCEPTED MANUSCRIPT
largest increases in emissions embodied in exports, but these increases occurred as a result of different driving forces. Rising local demand in other provinces (especially capital investment) caused an increase in CO2 emissions of 98 Mt (98.5%) in Inner
Mongolia if other factors were constant. This increase occurred primarily in the power generation sector (Figure 4). The growth in exported emissions in Anhui is attributed to changes in interregional dependency (49.6 Mt), trade volumes (63.1 Mt) and final demand (49.1 Mt). In contrast, changes in trade volume (142.2 Mt) were the main driver of the increase in exported emissions from Jiangsu (Figure 6a). Shandong province, which is traditionally an exporter, witnessed the largest decrease in exported emissions, due to the negative effects of improvements in emissions intensity and changes in interregional dependency. The emissions embodied in the imports of Central and Northwest regions have considerable increase, because of the growth in trade volume, final demand and consumption structure. For example, increasing final demand contributed to 869.5, 68 and 24 Mt to increase in imported emissions in Henan, Shaanxi and Inner Mongolia, respectively. The contributions of consumption structure change were also noticeable. Notably, the contribution of capital investment to emissions embodied in trade in in North (Hebei, Shandong) and Central regions (Henan) is larger than developed regions (Beijing, Shanghai), which indicates a faster expansion of capital investment. Moreover, the residents in the Central Coast region (Shanghai and Jiangsu) tend to have low-carbon lifestyles, and the consumption structure effect contributed to the reductions in emissions embodied in imports (Figure 6b).
ACCEPTED MANUSCRIPT
Figure 6. Contribution of each factor to the changes in emissions embodied in interprovincial exports (a) and imports (b).
ACCEPTED MANUSCRIPT
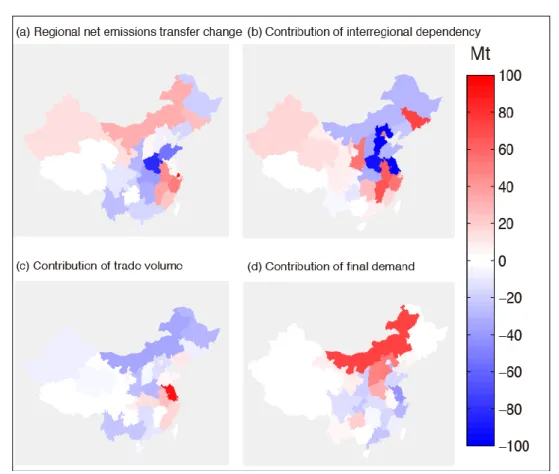
Figure 7. Regional net emissions outflow (a) and the contribution of interregional dependency change (b), trade volume change (c) and final demand change (d) (Unit: Mt).
Figure 7 shows the total net emissions outflow change, and contributions of the interregional dependency effect, trade volume effect and local demand effect. The decrease in net emissions outflow in Central and Southwest were mainly attributed to the change in interregional dependency, which in contrast drove the increase in South coast. For example, the interregional dependency change contributed 66.2 Mt, 49 Mt and 46.9 Mt to the increase in net emissions transfer in Jilin, Jiangxi and Anhui, and reduced 103.1 Mt, 83 Mt and 69 Mt in Jiangsu, Hebei and Henan, respectively. The substantial contribution of final demand change to Shanxi and Inner Mongolia were because of rapid increase in exported electricity, while it was heavy industry (e.g., metal) in Hebei.
ACCEPTED MANUSCRIPT
5. Conclusions and discussion
Knowledge of the endowments embodied in interregional trade is becoming increasingly important in a globalised economy. MRIO that includes the feedback effects in the inter-regional trade (Su and Ang, 2011), has been a widely used method. Furthermore, identifying the driving forces of changes in the endowments embodied in trade can provide significant help in the development of policies to curb regional and global emissions and/or resource consumption. However, there is still a gap in our quantitative understanding of the role of trade and distinguishing the effects of intermediate and final products in relocating emissions and/or resource consumption.
In this paper, we first present a MRIO-based SDA framework for investigating the emissions embodied in the final products traded between pairs of regions and the emissions embodied in intermediate goods that are used in further processing stages. By investigating the socioeconomic contribution to the reversing flows, we divide emissions flow between the original producer and final consumer according to where the products were finalised. The emissions embodied in final products are generated from production of a country’s GDP that are used to satisfied final demand of other countries, while the emissions embodied in intermediate products are related to fragmented interregional production processes. Our analysis shows that 82% (553 Mt)of the changes in emissions embodied in interprovincial trade can be attributed to intermediate products. The decomposition of emissions embodied in intermediate trade can reveal the driving forces of the change in interregional supply chain related emissions. The results in this study shed light on the following aspects.
First, the emissions flow among less developed regions will be new drivers in China. The emissions outsourced from the Central to Central Coast regions tend to decline and the consumption structure also offset part of the outsourced emissions. In contrast, the faster expansion of capital investment, household consumption and import volume in Henan, Shaanxi and Inner Mongolia have resulted in large increases in the emissions embodied in imports for those provinces. Moreover, Henan has ceased to be a net exporter and has become a net importer. This is because of the small catch-up of economic development in less developed regions in China. Poverty eradication is fairly carbon-intensive due to a larger carbon-footprint elasticity of consumption, strongly driving local emissions as well as imported emissions (Wiedenhofer et al. 2017; Hubacek et al. 2017).
Second, a slight shift of production activities from Central and North regions (together with the CO2 emissions) relieved the pressures of emission reduction in
ACCEPTED MANUSCRIPT
outflow via China’s interprovincial trade from southern and western provinces, where the energy resources are richer and production efficiencies are lower. The exported emissions are mainly embodied in exported intermediate products. Moreover, the intraregional dependency has changed slightly in 2012 and contributed to the reduction in EEIT.
Third, Central Coastal regions are still located in the downstream of the supply chain. The growth of emissions embodied in the final products, contributes to the increase in exported emissions from Central Coast regions. The exported emissions are embodied in their finished products and imported emissions are mainly embodied in intermediate products finalised locally. The Central Coastal regions use imported intermediate products to produce and finalized products which are exported to other regions. The emission embodied in China’s total exports to other regions via international trade has peaked after the global financial crisis, but further efforts on emissions embodied in interprovincial trade are needed. Thus, improving emission intensity in central and western regions or gradually upgrading the supply chain is crucial in reducing the CO2 relocation and total emissions in China.
Acknowledgements
This work was supported by the National Key R&D Program of China (2016YFA0602604), the National Natural Science Foundation of China (41629501), the EU H2020 research and innovation programme under the Grant Agreement No 730403 (INNOPATHS), the UK Natural Environment Research Council (NE/N00714X/1 and NE/P019900/1), the Economic and Social Research Council (ES/L016028/1), a British Academy Grant (AF150310) and the Philip Leverhulme Prize.
Disclosure statement
No potential conflict of interest was reported by the authors.
References
Aguiar, A., B. Narayanan, and R. McDougall. 2016. An overview of the GTAP 9 data base.
Journal of Global Economic Analysis 1(1): 181-208.
Ang, B. 2004. Decomposition analysis for policymaking in energy:: which is the preferred method? Energy Policy 32(9): 1131-1139.
Ang, B. W. 2005. The LMDI approach to decomposition analysis: a practical guide. Energy Policy 33(7): 867-871.
ACCEPTED MANUSCRIPT
Arto, I. and E. Dietzenbacher. 2014. Drivers of the growth in global greenhouse gas emissions.
Environmental science & technology 48(10): 5388-5394.
Baiocchi, G. and J. C. Minx. 2010. Understanding changes in the UK’s CO2 emissions: A
global perspective.Environmental science & technology 44(4): 1177-1184.
Baldwin, R. 2006. Globalisation: the great unbundling (s). Economic Council of Finland 20: 5-47.
Cansino, J. M., R. Román, and M. Ordóñez. 2016. Main drivers of changes in CO 2 emissions
in the Spanish economy: a structural decomposition analysis. Energy Policy 89: 150-159.
Chang, N. and M. L. Lahr. 2016. Changes in China’s production-source CO2 emissions: insights from structural decomposition analysis and linkage analysis. Economic Systems Research 28(2): 224-242.
Chen, B., M. Y. Han, K. Peng, S. L. Zhou, L. Shao, X. F. Wu, W. D. Wei, S. Y. Liu, Z. Li, J. S. Li, and G. Q. Chen. 2018. Global land-water nexus: Agricultural land and freshwater use embodied in worldwide supply chains. Science of the Total Environment 613-614: 931-943.
Chen, S. and B. Chen. 2016. Tracking inter-regional carbon flows: a hybrid network model.
Environmental science & technology 50(9): 4731-4741.
Davis, S. J. and K. Caldeira. 2010a. Consumption-based accounting of CO2 emissions.
Proceedings of the National Academy of Sciences 107(12): 5687-5692.
Davis, S. J. and K. Caldeira. 2010b. Consumption-based accounting of CO2 emissions. Proc. Natl Acad. Sci. USA 107: 5687-5692.
De Backer, K. and N. Yamano. 2011. International comparative evidence on global value
chains. Available at
SSRN: https://ssrn.com/abstract=2179937 or http://dx.doi.org/10.2139/ssrn.2179937 Dietzenbacher, E. and B. Los. 1998. Structural decomposition techniques: sense and
sensitivity. Economic Systems Research 10(4): 307-324.
Feng, K., Y. L. Siu, D. Guan, and K. Hubacek. 2012. Analyzing drivers of regional carbon dioxide emissions for China. Journal of Industrial Ecology 16(4): 600-611.
Feng, K., K. Hubacek, L. Sun, and Z. Liu. 2014. Consumption-based CO2 accounting of China's megacities: The case of Beijing, Tianjin, Shanghai and Chongqing. Ecological Indicators 47: 26-31.
Feng, K., S. J. Davis, L. Sun, and K. Hubacek. 2015. Drivers of the US CO2 emissions 1997-2013. Nature communications 6, 7714.
Feng, K., S. J. Davis, L. Sun, X. Li, D. Guan, W. Liu, Z. Liu, and K. Hubacek. 2013. Outsourcing CO2 within China. Proceedings of the National Academy of Sciences
110(28): 11654-11659.
Guan, D., G. P. Peters, C. L. Weber, and K. Hubacek. 2009. Journey to world top emitter: An analysis of the driving forces of China[rsquor]s recent CO2 emissions surge.
Geophysical Research Letters 36: L04709.
Guan, D., K. Hubacek, C. L. Weber, G. P. Peters, and D. M. Reiner. 2008. The drivers of Chinese CO 2 emissions from 1980 to 2030. Global Environmental Change 18(4): 626-634.
ACCEPTED MANUSCRIPT
drivers of China’s primary PM2. 5 emissions. Environmental Research Letters 9(2): 024010.
Guan, D., S. Klasen, K. Hubacek, K. Feng, Z. Liu, K. He, Y. Geng, and Q. Zhang. 2014b. Determinants of stagnating carbon intensity in China. Nature Climate Change. 4:1017. Guan, D., J. Meng, D. M. Reiner, N. Zhang, Y. Shan, Z. Mi, S. Shao, Z. Liu, Q. Zhang, and S. J. Davis. 2018. Structural decline in China’s CO2 emissions through transitions in
industry and energy systems. Nature Geoscience.
https://doi.org/10.1038/s41561-018-0161-1.
Hoekstra, R. and J. C. Van den Bergh. 2003. Comparing structural decomposition analysis and index. Energy Economics 25(1): 39-64.
Hoekstra, R., B. Michel, and S. Suh. 2016. The emission cost of international sourcing: using structural decomposition analysis to calculate the contribution of international sourcing to CO2-emission growth. Economic Systems Research 28(2): 151-167.
Hubacek, K., G. Baiocchi, K. Feng, and A. Patwardhan. 2017. Poverty eradication in a carbon constrained world. Nature communications 8(1): 912.
Jiang, X. and D. Guan. 2016. Determinants of global CO2 emissions growth. Applied Energy
184: 1132-1141.
Lan, J., A. Malik, M. Lenzen, D. McBain, and K. Kanemoto. 2016. A structural decomposition analysis of global energy footprints. Applied Energy 163: 436-451.
Lenzen, M. 2016. Structural analyses of energy use and carbon emissions–an overview.
Economic Systems Research 28(2): 119-132.
Lenzen, M., D. Moran, K. Kanemoto, B. Foran, L. Lobefaro, and A. Geschke. 2012. International trade drives biodiversity threats in developing nations. Nature 486(7401): 109-112.
Lenzen, M., D. Moran, A. Bhaduri, K. Kanemoto, M. Bekchanov, A. Geschke, and B. Foran. 2013. International trade of scarce water. Ecological Economics 94: 78-85.
Leontief, W. 1970. Environmental repercussions and the economic structure: an input-output approach. The review of economics and statistics 52(3): 262-271.
Leontief, W. W. 1941. The structure of American economy, 1919-1929: An empirical application of equilibrium analysis. Cambridge, Mass.: Harvard Univer: sity Press. Li, J. S., H. Zhou, J. Meng, Q. Yang, B. Chen, and Y. Zhang. 2018. Carbon emissions and their
drivers for a typical urban economy from multiple perspectives: A case analysis for Beijing city. Applied Energy 226: 1076-1086.
Li, Y., J. Meng, J. Liu, Y. Xu, D. Guan, W. Tao, Y. Huang, and S. Tao. 2016. Interprovincial Reliance for Improving Air Quality in China: A Case Study on Black Carbon Aerosol.
Environmental science & technology 50(7): 4118-4126.
Liang, S., Z. Liu, D. Crawford-Brown, Y. Wang, and M. Xu. 2013. Decoupling analysis and socioeconomic drivers of environmental pressure in China. Environmental science & technology 48(2): 1103-1113.
Liang, S., H. Wang, S. Qu, T. Feng, D. Guan, H. Fang, and M. Xu. 2016. Socioeconomic drivers of greenhouse gas emissions in the United States. Environmental science & technology 50(14): 7535-7545.
Lin, J., D. Pan, S. J. Davis, Q. Zhang, K. He, C. Wang, D. G. Streets, D. J. Wuebbles, and D. Guan. 2014. China’s international trade and air pollution in the United States.
ACCEPTED MANUSCRIPT
Proceedings of the National Academy of Sciences 111(5): 1736-1741.
Liu, W., J. Chen, Z. Tang, H. Liu, D. Han, and F. Li. 2012. Theories and practice of constructing China’s interregional Input-Output tables between 30 provinces in 2007: China Statistics Press, Beijing.
Liu, Z., S. J. Davis, K. Feng, K. Hubacek, S. Liang, L. D. Anadon, B. Chen, J. Liu, J. Yan, and D. Guan. 2016. Targeted opportunities to address the climate-trade dilemma in China.
Nature Climate Change 6(2): 201-206.
Malik, A. and J. Lan. 2016. The role of outsourcing in driving global carbon emissions.
Economic Systems Research 28(2): 168-182.
Malik, A., J. Lan, and M. Lenzen. 2016. Trends in global greenhouse gas emissions from 1990 to 2010. Environmental science & technology 50(9): 4722-4730.
Meng, B., Y. Fang, J. Guo, and Y. Zhang. 2017. Measuring China’s domestic production networks through Trade in Value-added perspectives. Economic Systems Research
29(1): 48-65.
Meng, J., Liu, J., Xu, Y., Tao, S., 2015. Tracing Primary PM2. 5 emissions via Chinese supply chains. Environ. Res. Lett. 10, 054005.
Meng, J., J. Liu, Y. Xu, D. Guan, Z. Liu, Y. Huang, and S. Tao. 2016. Globalization and pollution: tele-connecting local primary PM2. 5 emissions to global consumption. Proceedings of the Royal Society A: Mathematical, Physical and Engineering Science 472(2195). Meng, J., J. Liu, K. Yi, H. Yang, D. Guan, Z. Liu, J. Zhang, J. Ou, S. Dorling, Z. Mi, H. Shen, Q.
Zhong, and S. Tao. 2018a. Origin and Radiative Forcing of Black Carbon Aerosol: Production and Consumption Perspectives. Environmental science & technology
52(11): 6380-6389.
Meng, J., Z. Mi, D. Guan, J. Li, S. Tao, Y. Li, K. Feng, J. Liu, Z. Liu, X. Wang, Q. Zhang, and S. J. Davis. 2018b. The rise of South–South trade and its effect on global CO2 emissions.
Nature communications 9(1): 1871.
Mi, Z., J. Meng, D. Guan, Y. Shan, Z. Liu, Y. Wang, K. Feng, and Y.-M. Wei. 2017a. Pattern changes in determinants of Chinese emissions. Environmental Research Letters. 12(7): 074003.
Mi, Z., J. Meng, D. Guan, Y. Shan, M. Song, Y.-M. Wei, Z. Liu, and K. Hubacek. 2017b. Chinese reversing emission flows. Nature communications. 8(1): 1712.
Mi, Z., Meng, J., Green, F., Coffman, D. M., & Guan, D. (2018). China's “exported carbon” peak: patterns, drivers, and implications. Geophysical Research Letters, 45(9), 4309-4318. Miller, R. E. and P. D. Blair. 2009. Input-output analysis: foundations and extensions:
Cambridge University Press.
Minx, J., T. Wiedmann, R. Wood, G. P. Peters, M. Lenzen, A. Owen, K. Scott, J. Barrett, K. Hubacek, and G. Baiocchi. 2009. Input–output analysis and carbon footprinting: an overview of applications. Economic Systems Research 21(3): 187-216.
Moran, D. and K. Kanemoto. 2016. Tracing global supply chains to air pollution hotspots.
Environmental Research Letters 11(9): 094017.
Aguiar, Angel, Badri Narayanan, & Robert McDougall. "An Overview of the GTAP 9 Data Base." Journal of Global Economic Analysis 1, no. 1 (June 3,2016): 181-208.
Oita, A., A. Malik, K. Kanemoto, A. Geschke, S. Nishijima, and M. Lenzen. 2016. Substantial nitrogen pollution embedded in international trade. Nature Geoscience 9(2): 111-115.
ACCEPTED MANUSCRIPT
Peters, G. P. 2008. From production-based to consumption-based national emission inventories. Ecological Economics 65(1): 13-23.
Peters, G. P. and E. G. Hertwich. 2008. CO2 embodied in international trade with implications for global climate policy. Environmental science & technology 42(5): 1401-1407. Peters, G. P., C. L. Weber, D. Guan, and K. Hubacek. 2007. China's Growing CO2 Emissions
A Race between Increasing Consumption and Efficiency Gains. Environmental science & technology 41(17): 5939-5944.
Peters, G. P., J. C. Minx, C. L. Weber, and O. Edenhofer. 2011. Growth in emission transfers via international trade from 1990 to 2008. Proceedings of the National academy of Sciences of the United States of America 108(21): 8903-8908.
Roson, R. and M. Sartori. 2015. A decomposition and comparison analysis of international water footprint time series. Sustainability 7(5): 5304-5320.
Shan, Y., J. Liu, Z. Liu, X. Xu, S. Shao, P. Wang, and D. Guan. 2016. New provincial CO 2 emission inventories in China based on apparent energy consumption data and updated emission factors. Applied Energy 184: 742-750.
Shan, Y., D. Guan, J. Liu, Z. Mi, Z. Liu, J. Liu, H. Schroeder, B. Cai, Y. Chen, and S. Shao. 2017. Methodology and applications of city level CO 2 emission accounts in China.
Journal of Cleaner Production. 161: 1215-1225.
Shao, L., D. Guan, N. Zhang, Y. Shan, and G. Chen. 2016. Carbon emissions from fossil fuel consumption of Beijing in 2012. Environmental Research Letters 11(11): 114028. Sturgeon, T. J. and G. Gereffi. 2009. Measuring success in the global economy: International
trade, industrial upgrading and business function outsourcing in global value chains.
Transnational Corporations 18(2): 1.
Su, B. and Ang, B.W., 2011. Multi-region input–output analysis of CO2 emissions embodied in trade: the feedback effects. Ecological Economics, 71, pp.42-53.
Su, B. and B. Ang. 2012. Structural decomposition analysis applied to energy and emissions: some methodological developments. Energy Economics 34(1): 177-188.
Su, B. and B. W. Ang. 2013. Input–output analysis of CO 2 emissions embodied in trade: competitive versus non-competitive imports. Energy Policy 56: 83-87.
Weinzettel, J. and J. Kovanda. 2011. Structural Decomposition Analysis of Raw Material Consumption. Journal of Industrial Ecology 15(6): 893-907.
Wiedenhofer, D., D. Guan, Z. Liu, J. Meng, N. Zhang, and Y.-M. Wei. 2017. Unequal household carbon footprints in China. Nature Clim. Change 7(1): 75-80.
Wiedmann, T. 2009. A review of recent multi-region input–output models used for consumption-based emission and resource accounting. Ecological Economics 69(2): 211-222.
Wier, M. and B. Hasler. 1999. Accounting for nitrogen in Denmark—a structural decomposition analysis. Ecological Economics 30(2): 317-331.
Wu, L. and Z. Wang. 2017. Examining drivers of the emissions embodied in trade. Plos One
12(4): e0176159.
Wu, X. F. and G. Q. Chen. 2017. Global primary energy use associated with production, consumption and international trade. Energy Policy 111: 85-94.
Xu, Y. and E. Dietzenbacher. 2014. A structural decomposition analysis of the emissions embodied in trade. Ecological Economics 101: 10-20.
ACCEPTED MANUSCRIPT
Yamakawa, A. and G. P. Peters. 2011. Structural decomposition analysis of greenhouse gas emissions in Norway 1990–2002. Economic Systems Research 23(3): 303-318. Yu, Y., K. Feng, and K. Hubacek. 2013. Tele-connecting local consumption to global land use.
Glob. Environ. Change 23: 1178-1186.
Zhang, Z., J. e. Guo, and G. J. Hewings. 2014. The effects of direct trade within China on regional and national CO 2 emissions. Energy Economics 46: 161-175.
Zhang, Z., K. Zhu, and G. J. Hewings. 2017. A multi-regional input–output analysis of the pollution haven hypothesis from the perspective of global production fragmentation.