Efficient Inventory Management by Leveraging RFID in Service
Organizations
Ozden Engin Cakici Simon School of Business
University of Rochester [email protected]
Harry Groenevelt Simon School of Business
University of Rochester [email protected]
Abraham Seidmann Simon School of Business
University of Rochester [email protected]
Abstract
RFID provides real-time tracking, resulting in two additional benefits as an information technology. When inventory is inaccurate and real-time tracking is not available organizations have to use a periodic review policy. When inventory is accurate and real-time tracking is available, they may switch to a continuous review policy. Based on a case study in a radiology practice, we compare the operational and economic differences between a system that uses barcode technology and periodic review, and one that uses RFID technology and continuous review. While the first switch from barcode to RFID is a technology improvement providing automatic counting, the second switch from periodic to continuous review is a process innovation. We measure the value of automatic counting, process innovation, and the total of the two, (the value of RFID). We also explain how these benefits change with service level, lead time, demand, etc.
1. Introduction and Motivation
The RFID market is expected to reach $18 billion by 2012. Hospitals have already started to use RFID technology but some remain skeptical about its benefits. Yet, documented implementation of the technology in interventional cardiology has already increased reimbursement for expensive supplies, reduced inventory and improved patient safety [20, 21, 22, 23].
Motivated by the benefits of RFID in hospitals, we conducted a case study [4, 5] at a radiology practice that has two 1.5T MRIs. The quality of an MRI depends on a patient’s body characteristics, and can be improved by injecting contrast media. Prior to the implementation of RFID, the radiology practice was using the barcode technology to tag the contrast media vials and it was reviewing the vial inventory by a periodic review policy. Before each order was
given, the vial inventory was counted manually. The manual counting increase the ordering cost per order placed. After switching to the RFID technology, the practice switched to automatic counting and a continuous review policy. This research aims to identify and quantify the impacts of this switch on operational and economic aspects of a single-item inventory (i.e., contrast media).
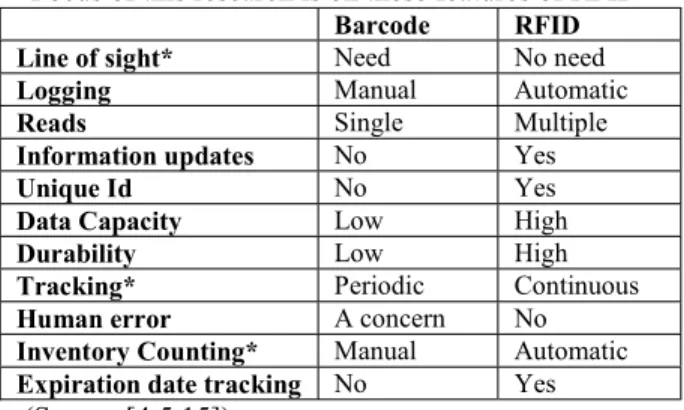
As busy environments, hospitals require a significant amount of human involvement in management of drug stocks. A technologist should check medical records of patients, scan drugs before administering them and count the number of drugs in storage to determine replenishment quantities. During these processes, operational issues may crop up, such as exam mismatches, (i.e., a patient’s procedure is applied on another), adverse reactions, and stock and billing problems. Unlike barcode technology, RFID requires no line of sight (i.e., scanning). It can automatically log patient and drug information and match the two. It can also read multiple drugs at a time, can update information on the tag (i.e., e.g., when a drug is used partially or is transported in its network), has high data storage capacity (i.e., expiration date can be recorded) and is durable while barcodes can wear out. RFID also uniquely identifies each item. RFID technology thus provides security, satisfies e-pedigree requirements, and facilitates product recalls. Besides these features, as an information technology, RFID can do real-time item tracking providing real-time information so that inventory can be reviewed by a continuous review policy. Table 1 summarizes the key differences between barcode and RFID technology.
Prior research about the benefits of RFID in single-item inventory management has mostly focused on the savings resulting from elimination of inventory record inaccuracy caused by different error streams in the system (e.g., [2, 18]). In these studies, the inventory review policy is mostly assumed to be a periodic review policy however additional benefit of
a switch to a continuous review policy is ignored. We believe that our paper completes this gap.
The focus of our research is on quantifying the benefits of RFID from automatic counting and continuous review. RFID makes continuous review possible. While a periodic review policy requires inventory information at regular intervals, a continuous review policy requires information in real-time. With barcodes the inventory system cannot gather real-time data. However, RFID provides information in real-time. Hence, the inventory manager has the option of using either a periodic review policy or a continuous review policy. While the switch from barcode to RFID is a technology improvement providing automatic counting, the switch from periodic to continuous review is a process innovation. We analytically show that the switch to continuous review (CR) decreases inventory on-hand, shortage level, and order frequency and their corresponding costs, making CR the least cost alternative policy.
We estimate the penalty of using the barcode technology to be at least 31%. While 28% is attributable to not switching to automatic counting, the remaining 3% is attributable to not switching to continuous review. We also conduct sensitivity analysis. We show that, while the value of RFID increases with service level, shortage cost per item per unit time, and standard deviation of demand, it decreases with lead time, ordering cost per order placed under RFID, and mean demand.
Table 1. The key differences between barcode and RFID technology *Focus of this research is on these features of RFID
Barcode RFID
Line of sight* Need No need
Logging Manual Automatic
Reads Single Multiple
Information updates No Yes
Unique Id No Yes
Data Capacity Low High
Durability Low High
Tracking* Periodic Continuous
Human error A concern No
Inventory Counting* Manual Automatic
Expiration date tracking No Yes
(Source:[4,5,15])
2. Literature Review
In this paper, we focus on the transition from the commonly accepted and adopted periodic review policy [29] to a superior policy based on continuous review. We are the first to analyze the operational and economic impacts of RFID technology and, in
particular, the impact of real-time tracking, on single-item inventory management in the context of a switch from a periodic to a continuous review policy.
The literature on RFID technology and its benefits for inventory management focuses mostly on the cost reduction resulting from elimination of inaccuracy. It is because, before RFID, researchers typically assumed that inventory records were completely accurate, but prior technologies in fact were prone to error. The researchers modeling inventory record inaccuracy problem showed how RFID could save by eliminating inaccurate data from the inventory information system [2, 8, 11, 16, 18].
There is a research that uses a periodic and a continuous inventory review policy for a three-echelon supply chain and that shows the economic differences between the two by a simulation study [6]. A more specific approach to a hospital inventory problem was researched by Cakici et al. [4, 5]. While most of the literature on RFID implementation addresses record inaccuracy, there has not been any study that identifies and quantifies analytically the impact of switching the inventory management policy as a result of RFID implementation.
Some researchers also do not account for ordering cost which constitutes a very high proportion of the total inventory costs in some organizations (i.e., hospitals). Hence, the literature lacks in evaluating two important aspects of RFID-enabled inventory management together: (1) the savings that results from switching to a continuous review policy, and (2) the impact on ordering costs, which are quite important in environments such as hospitals.
Our research is also related to the literature on the single-item inventory management infinite horizon problem. Our model is similar to well-known models in the area [12, 13, 25, 26, 28, 29].
There is also literature on other benefits of RFID. Some benefits are in RFID adoption [14], visibility in reverse channel [17], strategies for RFID implementation [24], supplier reaction to mandated RFID implementation [3], value of RFID data for tactical and strategic purposes within supply chain [1], factors that affect RFID adoption and its benefits [27], value of more data in business intelligence [9], and technology [10]. We also refer the reader to [19] for a comprehensive review of future applications of RFID.
3. Model
We model a single-item (e.g., 100 cc contrast media vial) inventory of a radiology practice assuming first that the radiology practice uses
periodic review order-up-to policy. Then, we model the same assuming that the practice uses continuous review policy. The demand is a nonnegative continuous stochastic process with stationary and independent increments. The lead time, ܮ, is a positive constant and any unfilled demand is back-ordered. Costs include inventory holding and shortage costs that are incurred continuously in time, and fixed costs for every order placed. The inventory holding cost, shortage cost, and ordering cost are linear in the average inventory on-hand, shortage level and order frequency, respectively. The inventory manager’s aim is to minimize the long-run average cost of inventory. In order to account for each cost component, we define the following notation:
Ȝ:mean demand per unit time
ı:standard deviation of demand per unit time
b:shortage cost per item per unit time
h:inventory holding cost per item per unit time
g: ordering cost per order placed
D(t1,t2]: random demand between time t1 and t2,
where demand at time t1 is not included. à: unit normal loss function
Ɏ:cumulative standard normal distribution function
T(y) = (h+b) à(Ɏ-1
(y)) + h Ɏ-1
(y) where 0<y<1.
z:service level=fraction of time with stock on hand
I(t):inventory on-hand at time t
Q(t):quantity on order at time t
IP(t):inventory position (i.e., I(t) + Q(t)) at time t
PR: periodic review order-up-to policy or periodic review policy
R: the time between two consecutive inventory reviews in PR
S: the order up-to-level in PR IJ:a review epoch in PR
CR:continuous review policy
Q:fixed replenishment quantity in CR
s: the reorder level in CR
PRC(R,S): long-run average cost of inventory under PR with given R and S
CRC(Q,s): long-run average cost of inventory under a continuous review policy with given Q and s.
In the next section, we define the inventory policies.
3.1 Periodic Review Order-up-to Policy, PR
The periodic review order up-to policy is represented by (R, S), where R is the time between two consecutive inventory reviews (or the review period) and S is the order-up-to level. Whenever the inventory position (inventory on-hand plus on-order) is found to be below S during a review epoch, IJ,enough items are ordered to make the inventory position, ܫܲሺ߬ሻ, equal to ܵ again. The lead time demand is defined as ܦൌ ܦሺ߬ǡ ߬ ܮሿ. The inventory holding and shortage costs are incurred during a cycle that is taken as the time between two consecutive order arrivals, ߬ ܮ and ߬ ܮ ܴ. The ordering cost is incurred at the time of an order. In order to use continuous costing, we define the time within this cycle as a random variable, ߠ, which is distributed byܷ݊݅ሾͲǡ ܴሿ, [13, 25]. We define
ܦோ ൌ ܦሺ߬ ܮǡ ߬ ܮ ܴሿ as the total demand between two consecutive review epochs, and
ܦఏൌ ܦሺ߬ ܮǡ ߬ ܮ ݐሿ as the total demand within a cycle arriving randomly as a function of the random time t that is distributed by ߠ. The quantity ordered at some ߬ isܳሺ߬ሻ that arrives after lead timeܮ. Figure 1 shows the inventory level distribution in this policy. Note that ܦandܦఏ are independent from each other.
Figure 1. Inventory level distribution at an arbitrary point in time, I(t), for PR According to Figure 1, we define ܫܲሺ߬ሻ, and ܫሺݐሻ
within a cycle as in the following:
ܫܲሺ߬ሻ ൌ ՝ܫܲሺ߬ െ ݄ሻ ܳሺ߬ሻ ൌ ܵ ܳሺݐሻ ൌ ൜ܵ െ ՜ܫܲሺݐ െ ݄ሻ ݂݅ݐ ൌ ߬ǡ ߬ ܴǡ ǥ Ͳݐ݄݁ݎݓ݅ݏ݁ ܫሺݐሻ ൌ ܫܲሺ߬ሻ െ ܦሺ߬ǡ ߬ ܮሿ െ ܦሺ߬ ܮǡ ݐሿ ൌ ܵ െ ܦെ ܦఏ
For an order to be made after a review there must be a positive demand between the two consecutive reviews; that is Pr(DR>0). Since demand is a
nonnegative continuous stochastic process, this probability is equal to one. Now, let ࡰࡸ ࡰࣂൌ ࡰ෩. In order to simplify the analysis, we assume that ܦ෩ is normally distributed, ܦ෩̱ܰሺߤǡ ߪଶሻ, where:
ߤ ൌ ܧሺܦ ܦఏሻ ൌ ߣ ቀܮ ଵ ଶܴቁ and ߪଶሺܴሻ ൌ ݒܽݎሺܦ ܦఏሻ ൌ ߪଶܮ ఙమோ ଶ ఒమோమ ଵଶ . We define the expected values of inventory on-hand and shortage level, E(S-ܦ෩)+ and E(ܦ෩-S)+, respectively. Then, we can write the following long-run average cost of inventory under PR:
IP(τ) =S τ+L+R θ∼U(0, R) t τ+L I(t) DL Dθ τ Inventory Level T ime
ܴܲܥሺܴǡ ܵሻ ൌ ݄ܧ൫ܵ െ ܦ෩൯ା ܾܧ൫ܦ෩ െ ܵ൯ା݃ ܴǤ
Theorem 1 describes the properties of PRC.
Theorem 1: If(ı2L)/(ȜL)2<0.75 then ܴܲܥሺܴǡ ܵሻ is strictly convex in ܵ and ܴǤ ܶherefore, the minimizers
ܵכ and ܴכ are the solutions to the first-order conditions.
Theorem 1 tells that ȜL must be greater than 0.75 for the PRC to be convex when the demand follows a Poisson process (i.e., ı2
=Ȝ). Theorem 1 ensures that a numerical algorithm such as successive substitutions will converge to R* quickly. Upon optimizing PRC with respect to S, we find that the optimal order-up-to level as a function of R: S*(R)=ߤ+Ɏ-1
(z)ߪଶ(R), where service level, z=b/(b+h). Then, we can write PRC as below.
ܴܲܥ൫ܴǡ ܵכሺܴሻ൯ ൌ ߪሺܴሻܶሺݖሻ ݃
ܴǤ
3.2 Continuous Review Policy,
CR
The continuous review policy is represented by (Q, s), where Q is the fixed replenishment quantity to order and s is the reorder level at which a replenishment order of quantity Q is given. Under CR, we define the lead time demand as ܦൌ ܦሺݐ െ
ܮǡ ݐሿ. The inventory holding and shortage costs are incurred continuously. The ordering cost is incurred at the time of an order. Since each order is constant Q units, the inventory position, IP(t), is distributed uniformly between s and s+Q [29]. To capture this, we define the uniform random variable U between Ͳ
and Q. The inventory level distribution is shown in Figure 2. Note that ܦand U are independent from each other.
Figure 2. Inventory level distribution at an arbitrary point in time, I(t), for CR We define ܫܲሺݐ െ ܮሻ and ܫሺݐሻ as in the following:
ܫܲሺݐ െ ܮሻ ൌ
՝ܫܲሺݐ െ ܮ െ ݄ሻ ܳሺݐሻ ൌ ݏ ܷ
ܳሺݐሻ ൌ ቄ݂ܳ݅ܫܲሺݐሻ ݏ
Ͳݐ݄݁ݎݓ݅ݏ݁
ܫሺݐሻ ൌ ܫܲሺݐ െ ܮሻ െ ܦሺݐ െ ܮǡ ݐሿ ൌ ݏ ܷ െ ܦ
Let ࡰࡸെ ࢁ ൌ ࡰሶ. In order to simplify the analysis assume that ܦሶ is normally distributed, ܦሶ̱ܰሺߤሶǡ ߪሶଶሻ where ߤሶ ൌ ܧሺܦെ ܷሻ ൌ ߣܮ െ ொ ଶ ߪሶଶሺܳሻ ൌ ݒܽݎሺܦെ ܷሻ ൌ ߪଶܮ ொమ ଵଶ.
We define the expected values of inventory on-hand and the shortage levels, E(s-ܦሶ)+ and E(ܦሶ-s)+, respectively. Then, we can write the following long-run average cost of inventory under CR:
ܥܴܥሺݏǡ ܳሻ ൌ ݄ܧ൫ݏ െ ܦሶ൯ା ܾܧ൫ܦሶ െ ݏ൯ା ݃ߣ ܳǤ
Theorem 2 sets the properties of CRC.
Theorem 2: ܥܴܥሺݏǡ ܳሻ is strictly convex in ݏ and ܳ
and therefore the minimizers ݏכ and ܳכ are the solutions to the first-order conditions.
We find that the optimal reorder level as a function of Q: s*(Q)=ߤሶ+Ɏ-1(z)ߪሶଶ(Q), where service level, z=b/(b+h). Then, we can write CRC as below.
ܥܴܥ൫ܳǡ ݏכሺܳሻ൯ ൌ ߪሶሺܳሻܶሺݖሻ ݃ߣ ܳǤ
3.3 Comparison of Operational and Economic
Metrics under PR and CR
In this section, we compare the periodic review order-up-to and continuous review policies. We also provide some analytical results. We define the optimal replenishment quantity as ܳכ under CR and the optimal review period as ܴכ under PR.
Theorem 3:
a)PRC(R,S*(R))PRC(R*,S*(R*))>CRC(Q*,s*(Q*))
b)ߪሺܴכሻ ߪሶሺܳכሻc)ܳכ ߣܴכǤ
Theorem 3 compares cost functions, the variances of inventory level distribution, and the average replenishment order quantities for PR and CR. The first result shows that (1) RFID is best leveraged when it is used with CR (2) when R is chosen exogenously as done in real life applications for convenience reasons, the cost savings by RFID goes up even more. The second result proves that CR has less variability in inventory level than PR when R is R*. Since RFID provides inventory level information in real-time rather than at regular intervals, when RFID is used with CR, the uncertainty in the inventory level information decreases. The third result proves that, Q*, is not less than ȜR*, the optimal average replenishment quantity under PR. The third result leads to Corollary 1 below.
Corollary 1:A different interpretation of Proposition 1 (c) proves that the average order frequency in continuous review policy is less than that in periodic review policy (i.e.,ଵ
ோכ
ఒ
ொכ).Therefore, when RFID is used with CR ordering cost is lower than when it is used with PR.
Now, by using the second result in Theorem 3, we can derive Theorem 4.
Theorem 4: a) A continuous review policy leads to less inventory on-hand on average; and b) the average shortage level is less than it is under a periodic review policy.
Theorem 4 and Corollary 1 corroborate that under CR all the three operational metrics are lower than the ones under PR. Hence, CR leads to less inventory holding, shortage and ordering costs. Though we expect that CR is less costly than PR, it is not obvious that the decrease in the long-run average cost of inventory results from a decrease in all three cost components.
4. Numerical Analysis
In this section, we illustrate the effect of changes in parameters on the value of (1) automatic counting, (2) process innovation, PI, and (3) RFID (i.e., the value of automatic counting plus the value of process innovation). Unless otherwise stated, whenever we say PRC and CRC we mean PRC(R*,S*(R*)) and CRC(Q*,s*(Q*)) respectively.We use the data in the case study by Cakici et al. [5].
The practice serves 44 patients per day, and, on average, 60% of all patients require a contrast media injection. The practice uses larger 100 cc (pharmacy bulk pack) contrast media vials, each of which can be used for seven images. The medical imaging department reorders every Friday, and it takes three days for the supplier to deliver the vials. The cost of a contrast media vial is $240. With a shelf life of up to two years, a vial has an annual inventory holding cost of 52%. This amount arises from the legal requirements that contrast-media must be held in locked storage cabinets and these cabinets have limited space. When the radiology practice runs out of stock, it incurs a shortage cost of $200 per vial demanded per day. This cost represents the managerial effort of expediting a shipment and a potential loss of income from an unused imaging slot. The total cost of reordering, shipping, and replenishment is about $500 per order, which includes ordering, manual counting, shipping and
receiving, paying the invoice, and all the transportation from the receiving dock to the pharmacy onto the hospital floor. Therefore, we have the following parameter values where we assume one week comprises five business days: R=5 days, L=3 days, Ȝ =3.8 per day, h=$0.48 per item per day, b=$200 per item per day, z=b/(b+h)= 0.9976. We define gbarcode and gRFID to account for the difference
in ordering costs per order placed due to manual counting under barcode and automatic counting under RFID. We have gRFID equals to $300 and
gbarcode equals to $500 per order, due to the
elimination of manual counting of vials at each review epoch. We also assume that ı=¥Ȝ, that is, we assume that the demand follows a Poisson process. Unless otherwise stated we use the values shown in Table 2 in §4.1 and §4.2.
Table 2. Parameter values in the practice
Parameter 1 Value 1 Parameter 2 Value 2
L 3 days z 0.9976
Ȝ 3.8 gbarcode $500
h $0.48 gRFID $300
b $200 ı ¥Ȝ(=1.95)
The inventory manager has three strategies to choose from: (1) use barcode (i.e., use manual counting and PR) (2-a) switch to RFID, execute automatic counting, and use PR (2-b) switch to RFID, execute automatic counting, and use CR. These three strategies are summarized in Table 3.
Table 3. Strategies for the inventory manager
1) Barcode Manual counting and PR
2) Switch to RFID a) Automatic counting and PR b) Automatic counting and CR We define “optimal RFID” to mean RFID is used with CR since it maximizes the benefits from RFID. We also define a metric “extra cost above optimal RFID or ECAR” as (PRC-CRC)/CRC% to quantify the % penalty of not switching to optimal RFID. Therefore, strategy 2-b is our base case. The ECAR resulting from a switch from (1) strategy 2-a to strategy 2-b is the value of PI, (2) strategy 1 to 2-a is the value of automatic counting, and (3) strategy 1 to strategy 2-b is the value of RFID. We use these terms interchangeably. We also define the value of automatic counting as the difference between the value of RFID and the value of PI. In our plots, however, we show the value of RFID and the value of PI since it is easier to interpret the value of automatic counting by using the two.
4.1 The effect of
z
on the Long-run Average
Cost of Inventory, ECAR of Long-run
Average Cost of Inventory, Average
Inventory On-hand, Average Shortage Level,
and Average Order Frequency under both
PR and CR
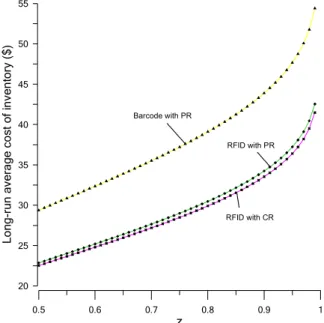
We plot PRC and CRC for RFID (i.e., strategies 2-a and 2-b) in Figure 3 and the value of PI in Figure 4with respect to service level, z=b/b+h. We also plot the average inventory on-hand, shortage level and order frequency with respect to z in Figure 5. We vary z from 0.5 to 0.99 through varying b and keeping h constant since b is more difficult to measure than h. 0.5 0.6 0.7 0.8 0.9 1 z 20 25 30 35 40 45 50 55 Lo ng-run av er a ge c o s t o f in v e n to ry ( $ ) RFID with PR RFID with CR Barcode with PR
Figure 3. Long-run average cost of inventory wrt. z 0.5 0.6 0.7 0.8 0.9 1 z 0 10 20 30 40 A v erage o n -h and i n vent ory /s hor ta g e l e v e l 0.03 0.04 0.05 0.06 0.07 A v er age orde r f requeny
RFID with PR (avg. shortage level) RFID with CR (avg. shortage level)
RFID with CR (avg. order frequency) RFID with PR (avg. order frequency)
RFID with CR (avg. inventory on-hand) RFID with PR (avg. inventory on-hand)
Figure 4. Average inventory on-hand, shortage level, and order frequency under PR and CR policies that minimize the sum of
inventory holding, shortage and ordering costs wrt. z
Figure 3 illustrates our findings in Theorem 3. It shows that CRC is a lower bound for PRC and that PRC and CRC are increasing in service level, z or shortage cost per item per unit time, b. The results are similar for barcode with PR. As service level increases, the long-run average cost of inventory increases under all three strategies since more inventory is required to avoid shortages under a higher service level. This further triggers an increase in order frequency. We can see these individual effects in Figure 4 which corroborate Theorem 4 and Corollary 1. Therefore, we find that (1) service level is a cost driver, (2) a higher service level requires a higher inventory capacity, and (3) the required inventory capacity is lower under optimal RFID.
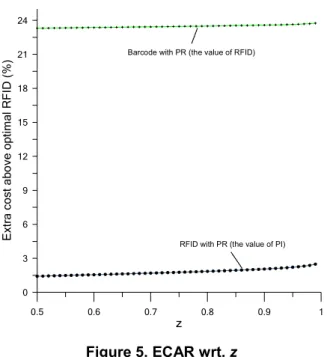
0.5 0.6 0.7 0.8 0.9 1 z 0 3 6 9 12 15 18 21 24 E x tr a c o st a b o v e opt im al RF ID (% )
RFID with PR (the value of PI) Barcode with PR (the value of RFID)
Figure 5. ECAR wrt. z
Figure 5 shows that the value of PI increases as z
or b increases. The increase in service level means that managing the inventory is now stricter so it is now more vulnerable to lack of information. Therefore, the real-time information becomes more valuable, which further implies that the value of PI should increase. Therefore, as service level increases (1) the value of information increases, (2) the benefit of switching from PR to CR, is more pronounced, and (3) the inventory manager has more incentive to switch to RFID. The value of RFID also increases but very slowly, which implies that the value of automatic counting decreases in z or b. Service level and shortage cost have no effect on the automatic counting therefore as these parameters become more dominant the effect of automatic counting decreases.
4.2 The effect of
L
,
g
RFID,
Ȝ
and
ı
on ECAR
for Strategy 1 and 2-a
In Figure 6, we plot the following with respect to L: (1) ECAR for strategy 1 (i.e., the value of RFID), (2) ECAR for strategy 2-a (i.e., the value of PI). In Figure 6, we vary L from 0 to 15.
0 3 6 9 12 15 L 0 5 10 15 20 25 30 35 E x tr a c o s t ab ov e optim a l RF ID ( % )
RFID with PR (the value of PI) Barcode with PR (the value of RFID)
Figure 6. ECAR wrt. L
Figure 6 indicates that the value of RFID and the value of PI are decreasing in lead time. We find that the decrease in the value of RFID is steeper, which implies that the value of automatic counting is decreasing as well. The value of RFID is expected to decrease since RFID does not provide any more information about the delivery process of the vials than barcode does. The value of PI also decreases since, as the lead time increases, its effect in PRC and CRC becomes more pronounced, which decreases the relative effect of real-time information. The lead time does not have an effect on the automatic counting therefore the value of automatic counting decreases as lead time becomes more dominant.
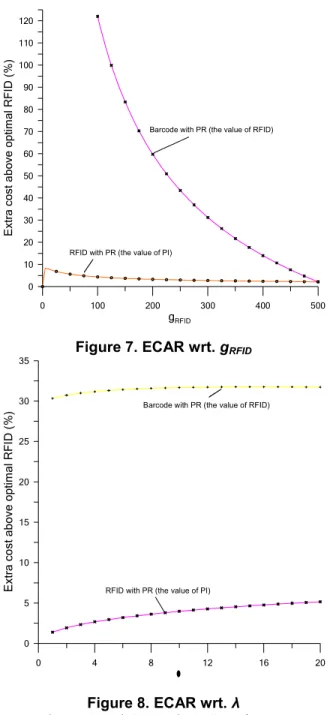
In Figure 7, we vary gRFID from 0 to 500. Since
ECAR for strategy 1 attains very high values for low values of gRFID, we let this particular plot start after
gRFID is equal to 100.
Figure 7 shows that the value of RFID decreases in gRFID. It is because, as gRFID increases, it gets closer
to gbarcode and that’s why the two plots have a
common point when gRFID is equal to gbarcode. Hence,
the cost difference between strategy 1 and strategy 2-b decreases.
Figure 7 also illustrates that, while the value of PI increases for the low values of gRFID, it is decreasing
for high values of gRFID. The value of PI is equal to
zero when gRFIDis equal to zero since at that point PR
becomes equivalent to CR. Therefore, the increase in the value of PI results from the fact that CR becomes more efficient than PR. But as gRFID increases more,
inventory ordering cost becomes dominant in the long-run average cost of inventory under both PR and CR. It means that the cost from uncertainty decrease
relatively, resulting in a decrease in the value of real-time information. Hospitals already have a high ordering cost per order placed. Hence, as ordering cost per order placed under RFID increases, the inventory manager has less incentive to switch (1) from barcode to RFID, and (2) further to CR.
0 100 200 300 400 500 gRFID 0 10 20 30 40 50 60 70 80 90 100 110 120 E x tr a co st a b o ve o p ti m a l RFID ( % )
Barcode with PR (the value of RFID)
RFID with PR (the value of PI)
Figure 7. ECAR wrt. gRFID
0 4 8 12 16 20 z 0 5 10 15 20 25 30 35 E x tr a c o s t ab ov e opti m al RF ID ( % )
RFID with PR (the value of PI)
Barcode with PR (the value of RFID)
Figure 8. ECAR wrt. Ȝ
In Figures 8 and 9, we plot ECAR for strategy 1 and for strategy 2-a with respect to mean demand, Ȝ
and standard deviation of demand, ı. In Figure 8, we set ı=0.5*Ȝ while varying Ȝ from 1 to 20. We fix the coefficient of variation of demand constant at 0.5 in order to eliminate the effect of ı being concave in Ȝ
which happens under Poisson distribution (i.e.,
ı=¥Ȝ).
Figure 8 illustrates that the value of RFID first increases then decreases, and the value of PI increases in Ȝ. The value of PI increases since an increase in the mean demand, increases the uncertainty of inventory level and uncertainty is better managed under CR via real-time information. Figure 8 also shows that the value of automatic counting decreases since mean demand has no effect on the automatic counting. This results in a decrease in the value of RFID after a particular value of Ȝ. Therefore, when demand is high, the inventory manager has (1) low incentives to switch from barcode to RFID and she would have (2) high incentives to switch to CR if she already switched to RFID.
In Figure 9, we vary ı from 0 to 10.
0 1 2 3 4 5 6 7 8 9 10 0 5 10 15 20 25 30 35 40 45 50 55 60 E x tr a c o s t ab ov e opti m al RF ID ( % )
RFID with PR (the value of PI)
Barcode with PR (the value of RFID)
Figure 9. ECAR wrt. ı
Figure 9 illustrates that both the value of RFID and PI increase in ı. It is because CR can handle variability via using real-time information while PR cannot. Also, we find that the value of RFID does not increase as much as the value of PI increases since the value of automatic counting decreases in ı. The decrease in the value automatic counting comes from the fact that the uncertainty has no effect on the automatic counting. Therefore, in highly uncertain environments the inventory manager is better off switching (1) from barcode to RFID, and (2) further to CR to best utilize the benefit from a superior information technology.
In the next section, we account for the financial aspects of the two technologies.
4.3 Financial Comparison of the Barcode and
RFID Technologies
Using the values in Table 2 we find that R*=17.57, PRC=$58.98, PRC(R=5)=$110.68 and CRC=$44.94. In the radiology practice, the inventory manager tends to choose R equal to 5 in order to benefit from following a regular schedule of inventory replenishment, such as ordering every Friday, rather than, i.e., say, every 18 days. This is because the latter can result in forgetting to order. Assuming that the practice operates for 260 days in a year, Table 4 summarizes the annual value of RFID in dollars under exogenously and optimally chosen R.
Table 4. The annual value of RFID ($)
R=5 (for practice) R=R*
$17,092.40 $3,650.40 From Table 5, we can infer that ECAR for automatic counting is 31.24%-%2.76=28.48% while the same ECAR for the practice is 146.28%-57.28%=89.00%.
Table 5. ECAR for strategies
Strategy ECAR
1 (for practice, R=5) 146.28%
1 31.24% 2-a (for practice, R=5) 57.28%
2-a 2.76%
5. Discussion and Conclusion
We show that the inventory manager can benefit from RFID by leveraging both (1) automatic counting and (2) a continuous review. We analytically prove that the latter one, the switch to CR, leverages savings in all three inventory cost items: inventory holding, shortage, and ordering costs. Therefore, long-run average cost of inventory is always lower under CR than under PR. Moreover, since all three cost components decreases, their corresponding operational metrics, the average inventory on-hand, shortage level, and order frequency, respectively, are also lower under CR than PR. The inventory manager should always switch to CR after RFID installation, since it is a process innovation that better leverages benefits from RFID.
The value of automatic counting decreases in service level, shortage cost per item per unit time, lead time and mean and standard deviation of demand since automatic counting is not affected by any of these parameters. The value of automatic counting also decreases with ordering cost per order placed under RFID since while long-run average cost
of inventory under barcode with PR stays constant, it decreases under RFID with CR.
The value of process innovation (PI) increases as service level (or shortage cost per item per unit time) increases, since higher service level means that the information is more important. The value of PI also increases with mean demand and standard deviation since both parameters increases the uncertainty in the system, and the uncertainty is better managed by CR. The value of PI decreases in lead time since CR does not utilize a better information than PR does in the delivery of the items. The value of PI also decreases in ordering cost per order placed under RFID since the key value of real-time information is on the uncertainty of the inventory level, which has effect on holding and shortage costs instead of ordering costs.
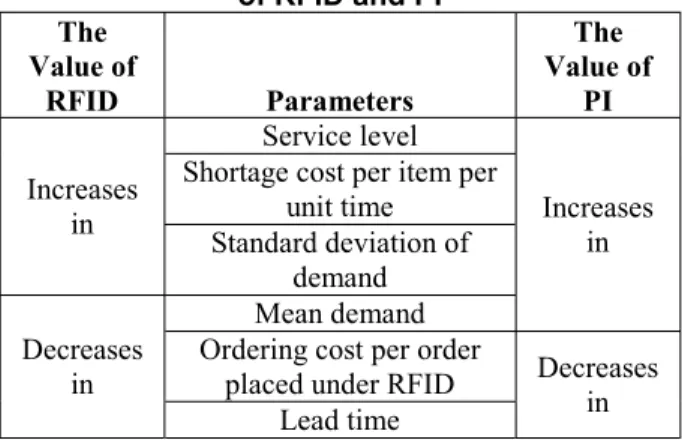
We now discuss the net or the total effect, i.e., the value of RFID. We show that while the value of RFID increases in service level, shortage cost per item per unit time, and standard deviation of demand, it decreases in mean demand, ordering cost per order placed under RFID, and lead time. Therefore, the inventory manager benefits more from RFID in an environment that involves high service level, high shortage cost per item per unit time, high demand, high demand variability, short delivery time, and low ordering cost per order placed under RFID. Table 6 summarizes the sensitivity analysis for the value of RFID and the value of PI.
Table 6. Sensitivity analysis for the value of RFID and PI The Value of RFID Parameters The Value of PI Increases in Service level Increases in Shortage cost per item per
unit time Standard deviation of demand Decreases in Mean demand Ordering cost per order
placed under RFID Decreases in Lead time
Further, in many real life situations, optimal review periods are not used because managers prefer to order regularly on a fixed day of the week. For that reason, we account for the case where review period is chosen exogenously; this case provides a benchmark for an approximate cost savings in a real-life environment (e.g., hospitals). We find that, for the radiology practice that we studied, the value of RFID is even higher; the total value is 146% with 89% coming from automatic counting and the
remaining 57% coming from the switch to continuous review.
The benefits of RFID are more pronounced every day, but the main concern for RFID implementation stays the same: high implementation costs. Nevertheless, as more companies make use of it, the cost of implementation should decline due to scale economies. Moreover, as common standards and regulations take hold for RFID technology, compatibility issues among different systems used by different companies should be resolved, and this will further facilitate the adoption of RFID.
While our research identifies and quantifies two important benefits of using RFID, there are many other areas that also require significant attention. Consider, for example, the shipping and delivery problems distributors face. Distributors experience delivery problems such as few or wrong items are delivered. These problems mostly occur due to lack of a warning system that can detect errors in the delivery system and identify a package sent to the wrong customer, or because employees experience barcode scanning problems and thus record inaccurate data, yielding discrepancies in delivery data. When items are tagged by RFID, they can be tracked easily, and warning systems can be implemented to ensure correct shipments. Another area that RFID can be useful is manufacturing. According to a recent study [7], “The approximate cost of launching a particular drug (in a period of more than 12 years) is approximately $800 million.” RFID can also help reduce clinical trial times by minimizing data errors, increasing timely information, eliminating paper work, and decreasing inventory-related problems. We expect to address some of these areas and relevant issues in our future research.
6. References
[1] Amini, M., Otondo, F.O., Janz, B.D., Pitts, M.G., “Simulation Modeling and Analysis: A Collateral Application and Exposition of RFID Technology,” Production and Operations Management, 2007 16(5), 586-598.
[2] Atali, A., H.L. Lee, Ö. Özer, “If the Inventory Manager Knew: Value of RFID under Imperfect Inventory Information,” Working Paper, 2009 Stanford University. [3] Barratt, M., T. Choi, “Mandated RFID and Institutional Responses: Cases of Decentralized Business Units,” Production and Operations Management, 2007 16(5), 569-585.
[5] Cakici, O.E., Seidmann, A., Using RFID in Medical Imaging, Hospital Management, 02/2008. Available at: http://www.hospitalmanagement.net/features/feature1762/. Accessed on 05/23/2009.
[6] Cheng, F., Lee, Y.M, Leung, Y.T., “Exploring the Impact of RFID on Supply Chain Dynamics” Proceedings of the 2004 Winter Simulation Conference.
[7] Company report, Kalorama Information, RFID in Pharmaceutical Manufacturing, Kalorama Information, March 2008.
[8] DeHoratius, N., Mersereau, A., Schrage, L.,“Retail inventory management when records are inaccurate,” Manufacturing and Service Operations Management, 2006 10(2), 257-277.
[9] Delen, D., Hardgrave, B.C., Sharda, R., “RFID for Better Supply-Chain Management through Enhanced Information Visibility,” Production and Operations Management, 2007 16(5), 613-624.
[10] Dutta, A., Lee, H.L., Whang, S., “RFID and Operations Management: Technology, Value, and Incentives,” Production and Operations Management 2007 16(5), 646-655.
[11] Fleisch, E., C. Tellkamp, “Inventory Inaccuracy and Supply Chain Performance: A Simulation Study of a Retail Supply Chain,” Int. J. of Production Economics, 2005 95(3), 373-385.
[12] Gallego, G., “New Bounds and Heuristics for (Q,r) Policies,” Management Science, 1998 44(2), 219-233. [13] Groenevelt, H., “Simple Inventory Heuristics” Working paper, 2008 University of Rochester.
[14] Heese, H.S., “Inventory Record Inaccuracy, Double Marginalization, and RFID Adoption,” Production and Operations Management, 2007 16(5), 542-553.
[15] Hedgepeth, 2006 W.O. Hedgepeth, RFID Metrics: Decision Making Tools for Today's Supply Chains, CRC Press, Boca Raton, FL (2006).
[16] Kang, Y., S.B. Gershwin, “Information Inaccuracy in Inventory Systems – Stock Loss and Stockout,” Working Paper, 2004 MIT.
[17] Karaer, O., H.L. Lee, “Managing the Reverse Channel with RFID-Enabled Negative Demand Information,” Production and Operations Management, 2007 16(5), 625-645.
[4] Cakici, O.E., Groenevelt, H., Seidmann A., “A Case Inquiry: Can RFID Help Reduce Costs in Medical Imaging?” Radilology Business Journal, 05/2009. Available at: http://www.imagingcenterinstitute. com/rbj/ rfid_help_reduce_costs_medical_imaging.php. Accessed on 05/23/2009.
[18] Kök, A.G., K.H. Shang, “Inspection and Replenishment Policies for Systems with Inventory Record Inaccuracy,” Manufacturing and Service Operations Management, 2007 9(2), 185-205.
[19] Lee, L. H., Ö. Özer., “Unlocking the value of RFID,” Production and Operations Management, 2005 16(1), 40-64.
[20] Mobile Aspects. Case study: improving product recall management. Available at: http://www.mobileaspects.com/ creating_value/pdf/MA%20Case%20Study_UMCH_ MCHC.pdf. Accessed June 15, 2009.
[21] Mobile Aspects. Case study: charge capture management. Available at: http://www.mobileaspects.com/ creating_value/pdf/Mobile%20Aspects%20Case%20Study _UCHHS%20Comer%20Childrens.pdf. Accessed June 15, 2009.
[22] Mobile Aspects. Case study: inventory reduction. Available at: http://www.mobileaspects.com/creating_value /pdf/MA%20Case%20Study_New%20York%20Presbyteri an%20Hospital.pdf. Accessed June 15, 2009.
[23] Mobile Aspects. Case study: expiration management. Available at: http://www.mobileaspects.com/creating_value /pdf/MA%20Case%20Study_KDMC%20Heart%20and%2 0Vascular%20Center.pdf. Accessed June 15, 2009. [24] Mutta, A., S. Whang, “RFID Applications in Private and Public Sector Operations: Introduction to the Special Issue,” Production and Operations Management, 2007 16(5), 523-524.
[25] Rao, U., “Properties of the Periodic Review (R,T) Inventory Control Policy for Stationary, Stochastic Demand,” Manufacturing and Service Operations Management, 2003 5(1), 37-53.
[26] Veinott Jr, F.A., “The Optimal Inventory Policy for Batch Ordering,” Operations Research, 1965 13(3), 424-432.
[27] Whitaker, J., Mithas, S., Krishnan, M.S., “A Field Study of RFID Deployment and Return Expectations,” Production and Operations Management, 2007 16(5), 599-612.
[28] Zheng, Y., “On Properties of Stochastic Inventory Systems,” Management Science, 1992 38(1), 87-103. [29] Zipkin, 2000 H.P. Zipkin, Foundations of Inventory Management, McGraw-Hill Higher Education, New York (2000).