IMPORTANT DISCLOSURES REGARDING COMPANIES THAT ARE THE SUBJECT OF THIS REPORT AND AN EXPLANATION OF RECOMMENDATIONS CAN BE FOUND AT THE END OF THIS
Acquisitions storing up
NSR is a unique REIT offering investors exposure to the self-storage
space. The stock offers strong EPS growth, an attractive distribution
yield, organic growth opportunities from the existing portfolio and
acquisition upside using funds from the recent capital raising.
Capital raising overview
NSR has undertaken a A$57.5m capital raising via an institutional placement (38.8m securities at A$1.48). Funds will be initially used to reduce existing debt allowing further capacity for acquisitions (A$78m capacity post raising). Pro-forma gearing is 23% vs covenant of 50%. As a result of some short-term dilution from the capital raising, FY15 underlying earnings guidance has been revised to 8.2c (previously 8.5c). We assume a 4c final distribution will be paid.
Acquisitions remain on the horizon
Post the capital raising, we expect near-term newsflow on acquisitions. We have made adjustments to our forecasts to include the capital raising and our assumptions around acquisitions. As a result, FY16 EPS and DPS falls by 14% and 11% respectively. We note NSR has settled around A$150m in acquisitions so far in FY15 and we assume a further A$50m in acquisitions in FY16. We expect NSR may also look at further asset sales. At 31 December occupancy on the IPO portfolio was relatively flat at around 70% reflecting the softer trading conditions. However, the effective rate per sqm grew 11% to A$276. Subsequently, we believe that as well as growth via acquisitions there is good organic growth potential within the recently acquired centres given occupancy sits below 70% and rate per sqm is below NSR’s existing portfolio average.
Retain Add rating: NSR offers growth and yield
NSR offers investors the opportunity to invest in a leading brand in self-storage with a diversified portfolio across Australia; a highly scalable operating platform; organic growth opportunities from increasing occupancy/rates; potential for further cap rate compression (WACR 9.5%); conservative gearing; future growth potential via acquisitions given the fragmented storage market; new recurring income streams via third party funds management/development fees; and an attractive distribution yield. Following changes, our DCF valuation has increased to A$1.69 (from A$1.55) which is also our revised price target. Based on TSR of around 14%, we retain our Add rating.
Fiona BUCHANAN T (61) 7 3334 4879 E [email protected] Scott MURDOCH T (61) 7 3334 4516 E [email protected]
Share price info
Share price perf. (%) 1M 3M 12M
Relative 2.4 -3.9 25.8 Absolute 1.3 5.1 36.0
Major shareholders % held
NSR150327
National Storage REIT
NSR AU / NSR.AXCurrent A$1.55
Market Cap Avg Daily Turnover Free Float Target A$1.69
US$359.8m
US$0.65m
95.0%
Prev. Target A$1.55A$458.2m A$0.82m 241.1 m shares Up/Downside 9.3%
Conviction| |
Sources: CIMB. COMPANY REPORTS
SOURCE: MORGANS, COMPANY REPORTS
Key metrics
Jun-14A Jun-15E Jun-16E Jun-17E
Revenue (A$m) 23.8 61.3 77.3 85.6
EBITDA (A$m) 10.2 29.3 42.9 49.8
EBIT (A$m) 10.0 28.9 42.3 49.2
Underlying NPAT (A$m) 8.8 24.4 35.9 41.0 Reported NPAT (A$m) 7.7 24.4 35.9 41.0
EPS Norm. (cps) 6.2 8.2 10.7 12.3 EPS growth n.m. n.m 30.1% 14.2% Normalised P/E (X) n.m. 18.8 14.4 12.7 EV/EBITDA (x) n.m. 21.3 15.6 13.9 DPS (cps) 3.8 8.0 9.7 11.0 Yield n.m. 5.2% 6.2% 7.1% Gearing (ND/A) 19% 19% 25% 27%
FY14 = six month period
93.0 105.9 118.7 131.6 1.00 1.20 1.40 1.60
Price Close Relative to S&P/ASX 200 (RHS)
Source: Bloomberg
2 4 6
8
Mar-14 Jun-14 Sep-14 Dec-14
V o l m 1.55 1.69 1.12 1.62 Target
52-week share price range
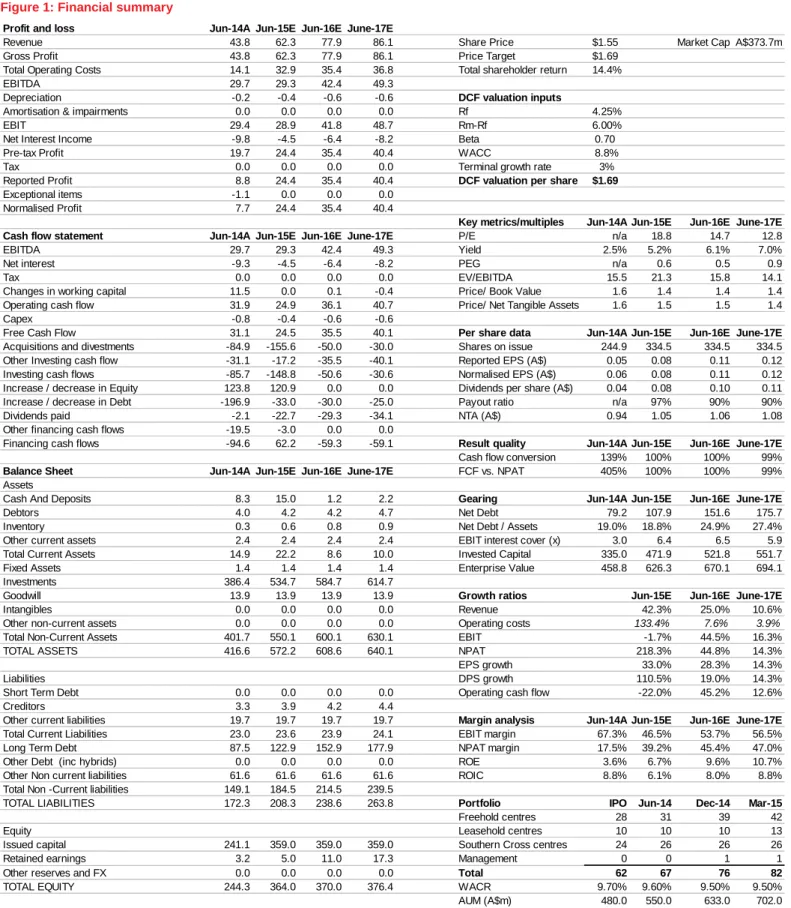
Figure 1: Financial summary
Profit and loss Jun-14A Jun-15E Jun-16E June-17E
Revenue 43.8 62.3 77.9 86.1 Share Price $1.55 Market Cap A$373.7m Gross Profit 43.8 62.3 77.9 86.1 Price Target $1.69
Total Operating Costs 14.1 32.9 35.4 36.8 Total shareholder return 14.4%
EBITDA 29.7 29.3 42.4 49.3
Depreciation -0.2 -0.4 -0.6 -0.6 DCF valuation inputs
Amortisation & impairments 0.0 0.0 0.0 0.0 Rf 4.25%
EBIT 29.4 28.9 41.8 48.7 Rm-Rf 6.00%
Net Interest Income -9.8 -4.5 -6.4 -8.2 Beta 0.70
Pre-tax Profit 19.7 24.4 35.4 40.4 WACC 8.8%
Tax 0.0 0.0 0.0 0.0 Terminal growth rate 3%
Reported Profit 8.8 24.4 35.4 40.4 DCF valuation per share $1.69
Exceptional items -1.1 0.0 0.0 0.0 Normalised Profit 7.7 24.4 35.4 40.4
Key metrics/multiples Jun-14A Jun-15E Jun-16E June-17E
Cash flow statement Jun-14A Jun-15E Jun-16E June-17E P/E n/a 18.8 14.7 12.8
EBITDA 29.7 29.3 42.4 49.3 Yield 2.5% 5.2% 6.1% 7.0%
Net interest -9.3 -4.5 -6.4 -8.2 PEG n/a 0.6 0.5 0.9
Tax 0.0 0.0 0.0 0.0 EV/EBITDA 15.5 21.3 15.8 14.1
Changes in working capital 11.5 0.0 0.1 -0.4 Price/ Book Value 1.6 1.4 1.4 1.4 Operating cash flow 31.9 24.9 36.1 40.7 Price/ Net Tangible Assets 1.6 1.5 1.5 1.4
Capex -0.8 -0.4 -0.6 -0.6
Free Cash Flow 31.1 24.5 35.5 40.1 Per share data Jun-14A Jun-15E Jun-16E June-17E
Acquisitions and divestments -84.9 -155.6 -50.0 -30.0 Shares on issue 244.9 334.5 334.5 334.5 Other Investing cash flow -31.1 -17.2 -35.5 -40.1 Reported EPS (A$) 0.05 0.08 0.11 0.12 Investing cash flows -85.7 -148.8 -50.6 -30.6 Normalised EPS (A$) 0.06 0.08 0.11 0.12 Increase / decrease in Equity 123.8 120.9 0.0 0.0 Dividends per share (A$) 0.04 0.08 0.10 0.11 Increase / decrease in Debt -196.9 -33.0 -30.0 -25.0 Payout ratio n/a 97% 90% 90% Dividends paid -2.1 -22.7 -29.3 -34.1 NTA (A$) 0.94 1.05 1.06 1.08 Other financing cash flows -19.5 -3.0 0.0 0.0
Financing cash flows -94.6 62.2 -59.3 -59.1 Result quality Jun-14A Jun-15E Jun-16E June-17E
Cash flow conversion 139% 100% 100% 99%
Balance Sheet Jun-14A Jun-15E Jun-16E June-17E FCF vs. NPAT 405% 100% 100% 99%
Assets
Cash And Deposits 8.3 15.0 1.2 2.2 Gearing Jun-14A Jun-15E Jun-16E June-17E
Debtors 4.0 4.2 4.2 4.7 Net Debt 79.2 107.9 151.6 175.7
Inventory 0.3 0.6 0.8 0.9 Net Debt / Assets 19.0% 18.8% 24.9% 27.4% Other current assets 2.4 2.4 2.4 2.4 EBIT interest cover (x) 3.0 6.4 6.5 5.9 Total Current Assets 14.9 22.2 8.6 10.0 Invested Capital 335.0 471.9 521.8 551.7 Fixed Assets 1.4 1.4 1.4 1.4 Enterprise Value 458.8 626.3 670.1 694.1 Investments 386.4 534.7 584.7 614.7
Goodwill 13.9 13.9 13.9 13.9 Growth ratios Jun-15E Jun-16E June-17E
Intangibles 0.0 0.0 0.0 0.0 Revenue 42.3% 25.0% 10.6%
Other non-current assets 0.0 0.0 0.0 0.0 Operating costs 133.4% 7.6% 3.9% Total Non-Current Assets 401.7 550.1 600.1 630.1 EBIT -1.7% 44.5% 16.3%
TOTAL ASSETS 416.6 572.2 608.6 640.1 NPAT 218.3% 44.8% 14.3%
EPS growth 33.0% 28.3% 14.3%
Liabilities DPS growth 110.5% 19.0% 14.3%
Short Term Debt 0.0 0.0 0.0 0.0 Operating cash flow -22.0% 45.2% 12.6%
Creditors 3.3 3.9 4.2 4.4
Other current liabilities 19.7 19.7 19.7 19.7 Margin analysis Jun-14A Jun-15E Jun-16E June-17E
Total Current Liabilities 23.0 23.6 23.9 24.1 EBIT margin 67.3% 46.5% 53.7% 56.5% Long Term Debt 87.5 122.9 152.9 177.9 NPAT margin 17.5% 39.2% 45.4% 47.0% Other Debt (inc hybrids) 0.0 0.0 0.0 0.0 ROE 3.6% 6.7% 9.6% 10.7% Other Non current liabilities 61.6 61.6 61.6 61.6 ROIC 8.8% 6.1% 8.0% 8.8% Total Non -Current liabilities 149.1 184.5 214.5 239.5
TOTAL LIABILITIES 172.3 208.3 238.6 263.8 Portfolio IPO Jun-14 Dec-14 Mar-15
Freehold centres 28 31 39 42
Equity Leasehold centres 10 10 10 13
Issued capital 241.1 359.0 359.0 359.0 Southern Cross centres 24 26 26 26
Retained earnings 3.2 5.0 11.0 17.3 Management 0 0 1 1
Other reserves and FX 0.0 0.0 0.0 0.0 Total 62 67 76 82
TOTAL EQUITY 244.3 364.0 370.0 376.4 WACR 9.70% 9.60% 9.50% 9.50% AUM (A$m) 480.0 550.0 633.0 702.0
1. PORTFOLIO OVERVIEW
NSR has 82 centres across Australia including:
43 centres owned by NSR
13 centres under long-term lease arrangements (WALE 11.7 years)
26 centres for Southern Cross (management)
Figure 2: Portfolio overview
SOURCE: COMPANY REPORTS
1.1 Acquisitions
Post the capital raising, we expect acquisitions to remain on the agenda and note NSR settled A$81.6m in acquisitions during 1H15 with a further six centres (A$69m) settled over January and February 2015. We assume no further acquisitions in 2H15, however do forecast a further A$50m in acquisitions in FY16.
Figure 3: Acquisitions to date
Centre Nature Price (A$m) Return Settlement
Wangara Freehold 10.9 9.0% Jul-14
Port Adelaide Freehold 5.2 9.8% Jul-14
O'Connor Freehold 8.0 10.0% Sep-14
Hume Freehold Oct-14
Mitchell Freehold Oct-14
Phillip Freehold Oct-14
Queanbeyan Freehold Oct-14
Forrestdale Freehold 11.0 8.5% Nov-14
Glen Iris Freehold Jan-15
South Melbourne Freehold Jan-15
Hawthorn Leasehold Jan-15
Richmond Leasehold Jan-15
Dandenong South Freehold 15.2 7.5% Jan-15
Dee Why Leasehold 5.0 10.0% Feb-15
46.5 8.2%
48.8 8.4%
1.2 Asset sales
We note NSR sold an asset during 1H15 in Brooklyn VIC for A$7.25m (above BV). NSR has retained operational management of the centre and will also earn project management, design and development fees from the redevelopment of the site to incorporate self-storage, hardstand and mini-warehouse facilities. NSR also retains the right to acquire the development on completion.
NSR is also undertaking due diligence on other sites within its existing portfolio with development potential.
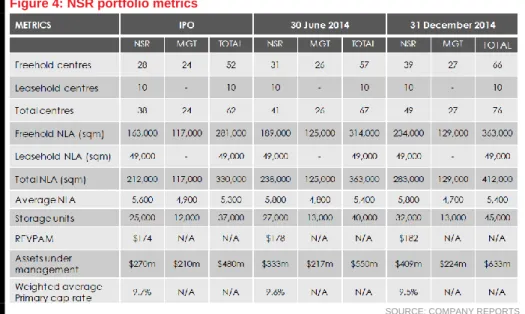
Figure 4: NSR portfolio metrics
SOURCE: COMPANY REPORTS
We note cap rates contracted 10bps to 9.5% during the period.
2. CHANGES TO FORECASTS
NSR derives a majority of its income from renting self-storage space and providing ancillary storage products (eg packaging materials, insurance and locks). The biggest revenue drivers are occupancy and rental rates (average growth of 4% pa over the past 10 years). Other income is derived from non-storage activities (including rental income for telecommunication towers and outdoor advertising etc) as well as fee income (eg management fees for Southern Cross Storage, development fees).
Figure 5: Changes to forecasts
Old New Old New Old New
NPAT 24.8 24.4 35.6 35.4 42.5 40.4 Change -2% -1% -5% EPS 8.7 8.2 12.1 10.6 14.40 12.1 Change -6% -14% -19% DPS 8.4 8.0 10.6 9.5 12.3 10.9 Change -5% -11% -13%
FY15 FY16 FY17
SOURCES: MORGANS, COMPANY REPORTS
We have made adjustments to our forecasts largely due to the capital raising and changes to our assumptions around acquisitions.
Key assumptions:
Occupancy grows at 1% in FY16 and 1.5% in FY17 (71% occupancy at
December 2014).
Rental rates – growth of 4% in the forecast period (off a A$275/sqm
acquisition of the Southern Cross portfolio in the forecast period (agreement due to expire in August 2016 of which NSR has first right).
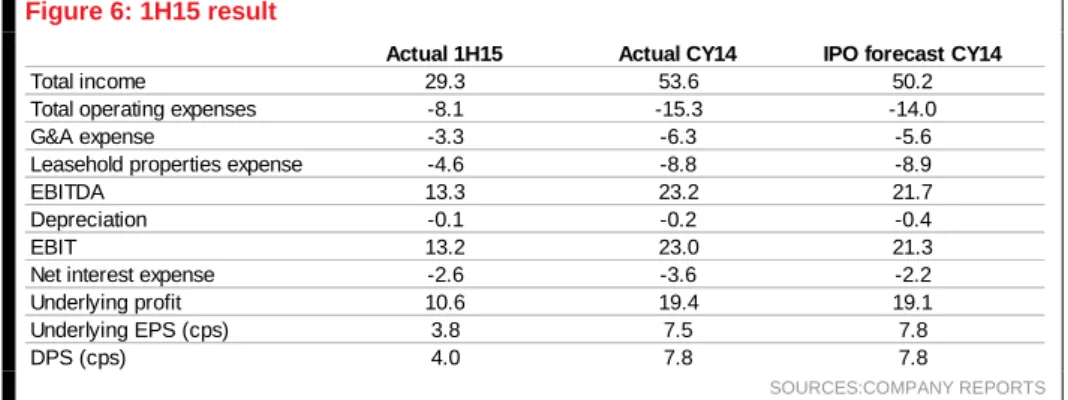
2.1 1H15 result overview
Figure 6: 1H15 resultActual 1H15 Actual CY14 IPO forecast CY14
Total income 29.3 53.6 50.2
Total operating expenses -8.1 -15.3 -14.0
G&A expense -3.3 -6.3 -5.6
Leasehold properties expense -4.6 -8.8 -8.9
EBITDA 13.3 23.2 21.7
Depreciation -0.1 -0.2 -0.4
EBIT 13.2 23.0 21.3
Net interest expense -2.6 -3.6 -2.2
Underlying profit 10.6 19.4 19.1
Underlying EPS (cps) 3.8 7.5 7.8
DPS (cps) 4.0 7.8 7.8
SOURCES:COMPANY REPORTS Income was higher vs IPO forecasts largely due to new acquisitions
(hence higher expenses), however we note new acquisitions will impact from FY16 onwards with several assets not settling until January/February 2015.
Occupancy on the IPO portfolio was relatively flat at around 70% reflecting the softer trading conditions. However, the effective rate per sqm grew 11% to A$276.
Operating expenses fell due to lower debt costs.
Cash at 31 December was A$9.5m.
Operating cash flow was A$18.9m.
DISCLAIMER
The information contained in this report is provided to you by Morgans Financial Limited as general advice only, and is made without consideration of an individual’s relevant personal circumstances. Morgans Financial Limited ABN 49 010 669 726, its related bodies corporate, directors and officers, employees, authorised representatives and agents (“Morgans”) do not accept any liability for any loss or damage arising from or in connection with any action taken or not taken on the basis of information contained in this report, or for any errors or omissions contained within. It is recommended that any persons who wish to act upon this report consult with their Morgans investment adviser before doing so. Those acting upon such information without advice do so entirely at their own risk.
This report was prepared as private communication to clients of Morgans and is not intended for public circulation, publication or for use by any third party. The contents of this report may not be reproduced in whole or in part without the prior written consent of Morgans. While this report is based on information from sources which Morgans believes are reliable, its accuracy and completeness cannot be guaranteed. Any opinions expressed reflect Morgans judgement at this date and are subject to change. Morgans is under no obligation to provide revised assessments in the event of changed circumstances. This report does not constitute an offer or invitation to purchase any securities and should not be relied upon in connection with any contract or commitment whatsoever.
Although CIMB Securities (Australia) Ltd (ABN 84 002 768 701), its related bodies corporate, directors and officers, employees, authorised representatives and agents ("CIMB Securities Australia") may have been involved in the preparation of certain content for this Research Report, this Research Report constitutes general advice provided by Morgans to the recipient of this report under its Australian financial services licence and Morgans is solely responsible for the content of this report. CIMB Securities Australia do not accept any liability for any loss or damage arising from or in connection with any action taken or not taken on the basis of information contained in this report, or for any errors or omissions contained within.
DISCLOSURE OF INTEREST
Morgans and CIMB Securities Australia may from time to time hold an interest in any security referred to in this report and may, as principal or agent, sell such interests. Morgans or CIMB Securities Australia may previously have acted as manager or co-manager of a public offering of any such securities. Morgans' affiliates or CIMB Securities Australia affiliates may provide or have provided banking services or corporate finance to the companies referred to in the report. The knowledge of affiliates concerning such services may not be reflected in this report. Each of Morgans and CIMB Securities Australia advises that it may earn brokerage, commissions, fees or other benefits and advantages, direct or indirect, in connection with the making of a recommendation or a dealing by a client in these securities. Some or all of Morgans' Authorised Representatives may be remunerated wholly or partly by way of commission.
REGULATORY DISCLOSURES
NSR: Analyst own shares.
RECOMMENDATION STRUCTURE
For a full explanation of the recommendation structure, refer to our website at https://www.morgans.com.au/research_disclaimer.
If you no longer wish to receive Morgans’ publications please advise your local Morgans office or write to Morgans, Reply Paid 202, Brisbane QLD 4001 and include your account details.
17.11.14
QUEENSLAND ORANGE (02) 6361 9166
BRISBANE - HEAD OFFICE (07) 3334 4888 PORT MACQUARIE (02) 6583 1735
BRISBANE - EDWARD STREET (07) 3121 5677 SCONE (02) 6544 3144
BRISBANE - TYNAN PARTNERS (07) 3152 0600 SYDNEY – LEVEL 7 CURRENCY HOUSE (02) 8216 5111
BUNDABERG (07) 4153 1050 SYDNEY – LEVEL 9 (02) 8215 5000
CAIRNS (07) 4222 0555 SYDNEY – HUNTER STREET (02) 9125 1788
CALOUNDRA (07) 5491 5422 (02) 9615 4500
EMERALD (07) 4988 2777 SYDNEY – REYNOLDS EQUITIES (02) 9373 4452
GLADSTONE (07) 4972 8000 WOLLONGONG (02) 4227 3022 GOLD COAST (07) 5581 5777 IPSWICH/SPRINGFIELD (07) 3202 3995 ACT KEDRON (07) 3350 9000 CANBERRA (02) 6232 4999 MACKAY (07) 4957 3033 MILTON (07) 3114 8600 VICTORIA MT GRAVATT/CAPALABA (07) 3245 5466 MELBOURNE (03) 9947 4111 NOOSA (07) 5449 9511 BRIGHTON (03) 9519 3555 REDCLIFFE (07) 3897 3999 CAMBERWELL (03) 9813 2945 ROCKHAMPTON (07) 4922 5855 CARLTON (03) 9066 3200
SPRING HILL (07) 3833 9333 FARRER HOUSE (03) 8644 5488
SUNSHINE COAST (07) 5479 2757 GEELONG (03) 5222 5128
TOOWOOMBA (07) 4639 1277 RICHMOND (03) 9916 4000
TOWNSVILLE (07) 4725 5787 SOUTH YARRA (03) 8762 1400
YEPPOON (07) 4939 3021 TRARALGON (03) 5176 6055
WARRNAMBOOL (03) 5559 1500
NEW SOUTH WALES
SYDNEY (02) 8215 5055 WESTERN AUSTRALIA
ARMIDALE (02) 6770 3300 PERTH (08) 6462 1999
BALLINA (02) 6686 4144 WEST PERTH (08) 6160 8700
BALMAIN (02) 8755 3333
BOWRAL (02) 4851 5515 SOUTH AUSTRALIA
CHATSWOOD (02) 8116 1700 ADELAIDE (08) 8464 5000
COFFS HARBOUR (02) 6651 5700 NORWOOD (08) 8461 2800
GOSFORD (02) 4325 0884
HURSTVILLE (02) 9570 5755 NORTHERN TERRITORY
MERIMBULA (02) 6495 2869 DARWIN (08) 8981 9555
NEUTRAL BAY (02) 8969 7500
NEWCASTLE (02) 4926 4044 TASMANIA