A database and analysis platform for electricity tariffs
LBNL-55680
1Katie Coughlin, Richard White, Chris Bolduc, Diane Fisher & Greg Rosenquist Energy Analysis Department
Environmental Energy Technologies Division Lawrence Bekreley National Laboratory
University of California Berkeley, CA 94720
May 2006
1
This work was funded by the Assistant Secretary of Energy Efficiency and Renewable Energy of the U.S. Department of Energy under Contract No. DE-ACO3-76SF00098.
Contents
1 Introduction 5
1.1 Background . . . 5
1.2 Overview of how tariffs work . . . 7
2 The TAP Database 10 2.1 Utility level data . . . 11
2.2 Tariff level data . . . 13
2.2.1 Tariff applicability . . . 13
2.2.2 Utility tariffs and TAP tariffs . . . 14
2.2.3 Tariff seasonal definitions . . . 15
2.2.4 Tariff time-of-use definitions . . . 15
2.3 Group level data . . . 15
2.3.1 Rate types . . . 16
2.3.2 Temporal Conditions . . . 17
2.4 Block level data . . . 18
3 TAP Inputs and Outputs 20 3.1 Tap data collection . . . 20
3.2 TAP as a tariff archive . . . 21
3.3 Bill processing . . . 23
3.4 TAP.pm subroutines . . . 24
3.5 Test Functions . . . 27
4 TAP Web Application 27 4.1 Global configurations . . . 29
4.2 Managing users . . . 29
4.2.1 Creating a user profile . . . 30
4.2.2 Editing a user profile . . . 30
4.2.3 Retrieving passwords . . . 30
4.2.4 Changing passwords . . . 30
4.2.5 Browsing users . . . 30
4.2.6 Editing users . . . 30
4.2.7 Deleting users . . . 30
4.3 Searching the TAP database . . . 31
4.3.1 Searching by utilities . . . 31
4.3.2 Searching by tariffs . . . 32
4.4 Viewing TAP data . . . 32
4.4.2 The tariff profile . . . 32
4.5 Manipulating tariff data . . . 35
4.5.1 Adding and editing tariffs: the tariff form . . . 35
4.5.2 Adding and editing rate structures: the tariff component form . . . 35
4.5.3 Defining temporal conditions . . . 36
4.5.4 Defining a ratchet . . . 36
4.5.5 Archiving tariff files . . . 38
4.6 Managing the tariff data . . . 38
4.6.1 Copy tariff . . . 38 4.6.2 Cancel tariff . . . 38 4.6.3 Delete tariff . . . 38 4.6.4 Publish tariff . . . 39 4.6.5 Re-validate tariff . . . 39 4.6.6 Un-publish tariff . . . 39
4.7 The OnTAP SOAP Server . . . 39
4.7.1 Utility listing methods . . . 39
4.7.2 Tariff listing methods . . . 41
4.7.3 Tariff description methods . . . 41
4.7.4 Bill calculation methods . . . 42
A Detailed tables 43
List of Tables
1 Season definition table. . . 142 TOU hours definition table . . . 15
3 Rate types and associated units . . . 16
4 Three types of energy groups . . . 19
5 Block-level data for the examples listed in table 4 . . . 19
6 Example of how tariff documents are dated in TAP . . . 21
7 Definition of user permissions . . . 29
8 The UTILITY table . . . 45
9 The STATE table . . . 45
10 The TARIFF table . . . 46
11 The GROUP table . . . 47
12 The BLOCK table . . . 47
13 The SEASON table . . . 47
14 The TIME OF DAY table . . . 48
16 The EIA FIPS table . . . 48
17 The PROJECT table . . . 48
18 The USER table . . . 49
19 Block-limit type definitions and corresponding bill calculator functions . . . 49
20 Script Synopsis: Global configurations . . . 50
21 Script synopsis: User-related scripts . . . 50
22 Script synopsis: Utility-related scripts . . . 50
23 Script synopsis: Tariff-related scripts . . . 51
24 Script synopsis: TAP Class listing . . . 52
List of Figures
1 Example tariff maps . . . 92 TAP data hierarchy . . . 11
3 Example Text of Applicability . . . 12
4 Example tariff showing several customer sub-classes . . . 13
5 Hierarchy of groups and blocks in a tariff . . . 16
6 Sample tariff with three groups . . . 17
7 Tariff update timeline, see also table 6 . . . 22
8 Bill calculator flow diagram . . . 23
9 Overview of the TAP website . . . 28
10 Utility and Tariff Search Forms . . . 31
11 Utility profile as displayed at the website . . . 33
12 Tariff profile as displayed at the website . . . 34
13 Tariff component form detail . . . 36
14 Season definition form . . . 36
15 Time-of-use periods definition form . . . 37
16 SOAP server process overview . . . 40
17 Detailed ER diagram for the TAP database . . . 44
1
Introduction
Much of the work done in energy research involves an analysis of the costs and benefits of energy-saving technologies and other measures from the perspective of the consumer. The economic value in particular depends on the price of energy (electricity, gas or other fuel), which varies significantly both for different types of consumers, and for different regions of the country. Ideally, to provide accurate information about the economic value of energy savings, prices should be computed directly from real tariffs as defined by utility companies. A large number of utility tariffs are now available freely over the web, but the complexity and diversity of tariff structures presents a considerable
barrier to using them in practice. The goal of the Tariff Analysis Project (TAP) is to collect and archive a statistically complete sample of real utility tariffs, and build a set of database and web tools that make this information relatively easy to use in cost-benefit analysis. This report presents a detailed picture of the current TAP database structure and web interface. While TAP has been designed to handle tariffs for any kind of utility service, the focus here is on electric utilities within the United States. Electricity tariffs can be very complicated, so the database structures that have been built to accommodate them are quite flexible and can be easily generalized to other commodities.
This report is organized as follows: In the rest of this section we discuss the project background, and provide an overview of how electricity tariffs function and what kinds of prices they define. In Section 2 we describe the TAP database in detail, including definitions of all the TAP tables and the fields they contain. Section 3 discusses how to input data to TAP, and presents a set of Perl scripts that can be used to do bill calculations from TAP data. In Section 4 we describe the web interface that has been built to view, enter and edit TAP data, and theOnTAP SOAP server. These applications are written in PHP [3]. In the Appendix we provide a set of tables detailing the database structure and summarizing the functionality and dependencies of the web scripts. For reference, figure 17 shows the entity-relationship diagram of the TAP database.
1.1 Background
TAP was originally developed as an analytic tool to be used in the economic benefits analysis for the U.S. Department of Energy (DOE) efficiency standards rulemakings, specifically for commercial air-conditioning [4] and distribution transformers [5]. Both these equipment types have peaky loads that are strongly correlated to the overall electric system peak. While it is obvious that the cost of serving peaky loads is higher than the average production cost per kilowatt-hour, just how much higher cannot be determined without considerable attention to detail. Moreover, the question of whether retail prices adequately capture these additional costs can be difficult to answer, especially for complicated tariff structures.
The most conceptually straightforward way to approach this question is to just calculate the actual bill a customer would see given a certain level of energy demand and consumption. If the changes to demand and consumption due to a standard can be estimated, then the bill can be recalculated, and the economic savings due to the standard follow directly. TAP was developed to implement this conceptually simple and accurate approach, by converting the information buried in detailed tariff documents to a rational database format. The complexity of the database reflects the fact that a tariff is not a list of pricesper se, but rather an algorithm for computing customer bills. By surveying a large sample of utilities, the TAP analysis arrived at a standardized description of this algorithm that captures the most important determinants of the prices seen by utility customers. The features modeled in TAP include demand charges, seasonal rates, variable block rates, delivery voltage and time-of-use rates. TAP cannot and does not attempt to capture all the legal rules, requirements, exceptions and nuances that may be specified in a tariff.
The first version of the TAP database and the bill calculator were implemented as an Excel spreadsheet. Because tariffs change over time, more sophisticated database tools than those avail-able through Excel were needed to update and maintain the tariff data. To address these issues, LBNL developed a mySQL database and a web interface tariffs.lbl.gov to view, enter and edit the data. TAP data can be viewed by the general public, and user accounts can be set up to allow access to the database for data entry and publication. The TAP website includes a simple bill calculator, which allows the user to input energy consumption and demand data, and view a calculated bill, including a breakdown by different types of charges. LBNL also maintains an archive of the utility documents which are the source of the tariff data.
For the DOE analyses LBNL developed a sample of about 300 tariffs from 90 electric utili-ties covering the continental United States [1]. This utility sample was designed to reflect the distribution of population across the country, and to capture the diversity of all of the industry characteristics that correlate with electricity rates, such as location, ownership type, and company size. Regional variation implicitly includes differences in climate, demographics, historical devel-opment, and market structures. Utilities included in the sample serve roughly half the commercial and residential customers in the U.S., which is sufficient to provide accurate estimates of electricity prices at the national and regional level (census divisions or larger areas). More detail on the application of TAP tariffs to the efficiency standards rulemakings is available through the DOE website [4, 5]. A thorough analysis of commercial average and marginal electricity prices based on TAP tariffs and related tools is also available as LBNL report number 55551 [1]. The database was updated in 2004-2005, and currently contains the default residential and non-residential secondary voltage tariffs, and primary voltage tariffs where they exist, for the original sample of 90 utilities. TAP has also been linked to the LBNL Home Energy Saver 1
website [2]. For this project, all residential tariffs for most of the electric utilities in California were collected.
1.2 Overview of how tariffs work
Electricity tariffs are typically classed as residential or non-residential. Non-residential may be further subdivided into general service, and special-use tariffs such as street-lighting, agricultural,
etc. Occasionally utilities will define industry-specific tariffs, for example for food processing. Its important to note that although it is standard practice to report electricity data for the residential, commercial and industrial sectors, most utilities do not actually distinguish between commercial and industrial customers in their tariffs. Instead, they use more technical criteria, such as delivery voltage, transformer size or load factor, to define the tariff rules. Custom tariffs may be created for very large customers. Thus, in general, commercial and industrial customers with similar energy use profiles will be on the same tariff.
It is common practice to subdivide the general-service tariffs by customer sizes. Size is almost
1The HES website allows users to estimate the economic benefits of more efficient appliances and other
improve-ments to household energy efficiency. Through the link to TAP, users can specify the utility and the tariff to use to calculate their electricity bills.
always defined by the value of the annual peak demand, although occasionally annual energy consumption may be used. Physically, the demand is defined as the rate of energy use per unit time, which can obviously not exceed the service capacity to the customer. In practice, demand is not measured instantaneously, but rather is averaged over a period of time defined by the tariff (and meter), usually fifteen or thirty minutes. The annual peak is the maximum demand over one calendar year. Each size class always includes a default tariff, and may have in addition several optional or experimental tariffs. Time-of-use (TOU) tariffs are available to both residential and non-residential customers, and are included in TAP if they are the default tariff. In the original TAP sample the default tariffs for residential and non-residential customers over all size classes were collected.
As noted above, a tariff essentially defines an algorithm for computing a customer2
The primary inputs to the bill algorithm are the billing period, the energy consumption in kilowatt-hours (kwh) over the billing period, and the peak energy demand in kilowatts (kw) over the billing period. To simplify the discussion, we will assume that the billing period is always one calendar month. The annual peak demand, annual energy consumption and delivery voltage may be needed to define which tariff a customer will be on, but are not needed to compute the monthly bill. Conceptually, we can think of each tariff as a function which takes the input customer data and returns the bill:
B =F(m, Em, Dm), (1)
wheremdenotes the month, Dm is the current month demand,Em is the current month
consump-tion, andF is the function defined by the tariff. Because rates may vary by season, and the season definition varies by tariff, the bill depends explicitly on the calendar monthm. Strictly speaking, for TOU tariffs the bill will be a function of energy use and demand in each of the TOU time periods, but we’ll ignore this level of detail for the moment.
Given the bill and the customer inputs, a number of prices can be defined. For example, the average price in a given month is the bill divided by the energy consumption:
Pavg =B/Em. (2)
One of the key points to understand here is that the price is not determined solely by the tariff - it depends in a fundamental way on the input customer data as well. In other words, the price determined by a given tariff is a function of the customer variablesEmandDm. This way of looking
at prices turns out to be quite useful, as it allows us to forget the details of how a tariff is specified and just focus on how the price functionbehaves for different values of the independent variables. In cost-benefit analysis, the quantity of interest is usually the marginal price, defined as the price that would be applied to the next increment of consumption or demand, relative to some baseline. Using TAP, it is easy to calculate marginal prices by comparing the baseline electricity
2The bill is really defined for energy use and demand measured at a meter. To keep the discussion clear, we’ll
bill to the bill when energy and demand are perturbed. Defining the energy decrement ∆E and demand decrement ∆D, the change to the bill can be written
∆B =F(m, Em, Dm)−F(m, Em−∆E, Dm−∆D). (3)
We define the effective marginal pricePemp [1] to be the ratio
Pemp= ∆B/∆E. (4)
This definition combines the effects of both energy and demand charges, TOU rate structures, and whatever else may be included in the tariff, and should not be confused with the marginal energy price which only looks at the changes in the bill that occur when the energy consumption is perturbed. The effective marginal price is by definition the economic value associated with the energy savings (∆E,∆D). For small decrements, equations 3 and 4 can be combined to give
Pemp= ∆B ∆E ¯ ¯∆D=0 + ∆B ∆D ¯ ¯∆E=0 ∆D ∆E. (5)
Note that it is the ratio of ∆D and ∆E that enters this equation. This quantity is a variable that depends on the scenario under consideration, and is closely related to the load factor.
The load factor is defined as the ratio of the average energy consumption to the peak energy demand over some time period. For example, if the demand is defined as the average demand over one hour then the monthly load factor is
LFm =
Em
NmDm
(6)
where Nm is the number of hours in month m. Because the load factor is a combination of the
independent variables Dm and Em, the average and marginal prices determined by a tariff could
also be considered functions of eitherDm andLFm, orEm andLFm. In a detailed empirical study
of prices for non-residential consumers [1], we have found that, for a given level of demand, the electricity price correlates more closely with load factor than with energy consumption. This is not surprising, as higher load factors (corresponding to flatter loads) are presumably more cost-effective to service.
In analogy with the load factor we define amarginal load factorM LF, again assuming demand is defined as average hourly demand:
M LF = ∆E
Nm∆D
(7)
Equation 5 can then be written
Pemp= ∆B ∆E ¯ ¯∆D=0 + ∆B ∆D ¯ ¯∆E=0 Nm M LF. (8)
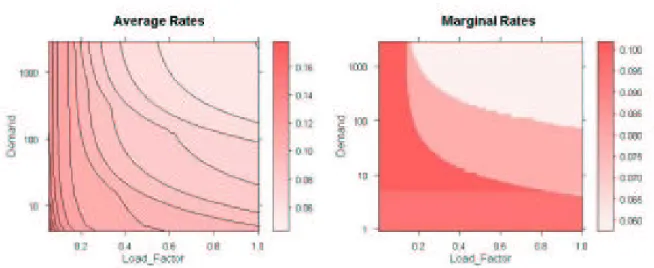
Figure 1: Example tariff maps. The average price (left) and effective marginal price (right) are shown as a function of demand and load factor. The demand axis is logarithmic.
The marginal load factor is a variable in the price equation, and is independent of the tariff. In applications, the actual value of theM LF will be set by the efficiency measure under consideration. One of the advantages of using TAP is that it allows each tariff, no matter how complicated, to be converted to the relatively simple formula in equation 8. Of the various determinants of price, those that depend on the tariff itself are clearly separated from those that depend on the customer characteristics.
As a final illustration of the price function concept, we show in figure 1 representations ofPavg
and Pemp for a sample tariff. They are plotted as functions of the demand and load factor. For
the marginal price Pemp, equation 8 is used assuming that the marginal load factor M LF = 0.5.
The figures are similar to an elevation plot: the price (average or marginal) is analogous to the elevation and is indicated by the color, while demand is on the vertical axis (like latitude), and the load factor is displayed along the horizontal axis (similar to longitude). Because demand can vary so widely across a single tariff, the vertical axis is logarithmic. Note that if the value of theM LF
used to compute the effective marginal price were changed, it would change the overall scale of the price, but would not affect the pattern observed in the figure.
This provides a brief example of how TAP allows a user to work directly with analytically well-defined quantities, without getting bogged down in the details of how individual tariffs are defined. A detailed application of these concepts to the calculation of commercial electricity prices is presented in the report LBNL-55551 [1], which includes a discussion of how to fit TOU tariffs into this type of framework.
2
The TAP Database
In this section we go over the TAP database design in detail. Tariffs are essentially a list of specific rates along with a set of rules and conditions which define when these rates should be applied. In designing the TAP database, the rules and conditions have been parsed into a set of standardized criteria. The rates and parameters defining these applicability criteria can then be stored in a set of linked tables. Not every feature that may appear in a tariff has been dealt with in the current database. The most common criteria which are included are: seasonal rates, block rates with fixed or variable block limits, time-of-use rates, and capacity charges. Each of these will be described in detail below.
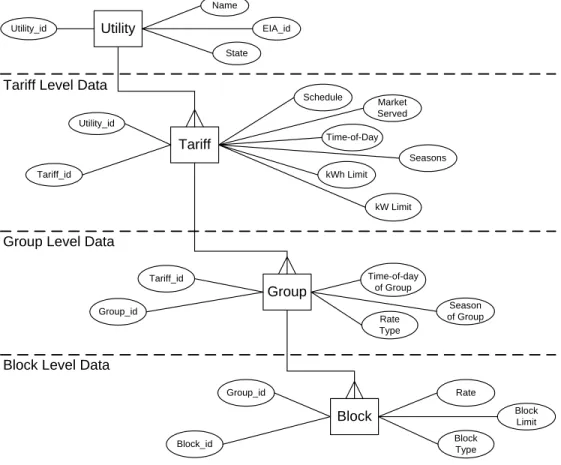
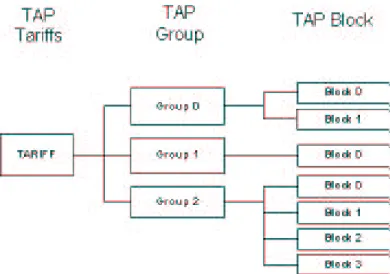
The data are organized on four hierarchical levels, which are illustrated in the condensed entity-relationship (ER) diagram of figure 2. The first is the utility level, which includes the data needed to describe the company that issues the tariffs. This is collected primarily from the Energy Information Agency (EIA) Form 861 filings [6], which provide quite detailed information on all companies which sell electricity to final consumers. Utility-level data are stored in the UTILITY and STATE tables. The second level is the tariff level. While a utility may have many tariffs, each customer is assigned to only one, so all the information needed to make this assignment must be included in the tariff-level data. In TAP these characteristics are the market (residential, general service, agricultural etc. ), the kw and kwh limits, the service voltage, and the customer state of residence (for utilities which operate in multiple states). The definition of seasons and time-of-use periods occurs at the tariff level. The tariff table also includes a set of dates defining the legal period of validity for the tariff, and the dates when the data were collected. In certain cases, to enforce consistency with the TAP database structure, it may be necessary to subdivide a single utility tariff into several separate database tariffs. To distinguish the latter from the original utility definition, we refer to them asTAP tariffs. This is a data-management device and has no impact on the accuracy of prices calculated using TAP. The tables containing tariff-level data are TARIFF, MARKET and STATE.
The next two levels are where all the data defining specific rates, and the parameters used to specify the conditions when the rates apply, are collected. This information is subdivided into the third GROUP level, and the fourth BLOCK level. In general, a utility may apply multiple charges to the same kw of demand or kwh of consumption. For example, a utility may specify an energy charge for generation, and another energy charge for transmission, and apply both charges over the same consumption range. TAP uses thegroupsandblocksconstructs to organize the data and allow multiple conditions to be applied to the same inputs. The group structure separates charges according to rate type, season, time-of-use period, and if appropriate the aspect of service the customer is being charged for. A block defines a limited range of input data values over which a given rate applies. A group always consists of a contiguous set of blocks that span the full range from zero to infinity.
The next four sections discuss each level more fully. A detailed ER diagram, and a complete listing of all the database tables, are collected in the Appendix.
Block Block_id Block Limit Block Type Rate Group_id Group Group_id Season of Group Rate Type Time-of-day of Group Tariff_id Tariff Tariff_id Schedule kW Limit kWh Limit Seasons Time-of-Day Market Served Utility_id Utility Name Utility_id State EIA_id
Utility Level Data
Group Level Data
Block Level Data Tariff Level Data
2.1 Utility level data
Information about individual utilities is stored at the highest level of the database. Here a utility is defined as a business entity that sells electricity to final consumers. Companies of this type are now known as load-serving entities or LSE’s. Strictly speaking, utility data are not required to calculate bills, but in general the utility data are the only link to geographic information about customers and rates. In reality the regional variation of electricity prices is quite pronounced [1, 4], so it is important to have this information readily available. Geographic information is stored in TAP in the ZIP CODE and EIA FIPS tables.
The TAP utility data come primarily from the EIA Form 861 filings [6]. These are updated annually and easily available over the web. Attributes from the EIA data that are currently stored in TAP are the utility name, state, ownership type, and the five-digit utility code used by EIA as a unique identifier. The state in this table refers to the state in which the company is incorporated. A utility may serve customers in several states, and each state will have its own tariff, so another state variable is included in the TARIFF table. The TAP website attempts to maintain current links to the websites of all the utilities in the sample.
One of the difficulties in maintaining a database of this type is that the structure of the electricity industry is always changing, and company mergers (and splits) are fairly common. EIA deals with this situation by maintaining within its data the identity of a given LSE, even if its parent company or legal name changes. This appears to be consistent with the tariff filing requirements of state public utility commissions. TAP also follows this practice, so that utilities included in the sample are defined as per the EIA list of companies. This means that some of the company names in TAP may no longer be in general public use; however, the LSE remains defined at the state level for the purpose of filing tariff documents.
2.2 Tariff level data
Tariff level data include fields needed to uniquely identify a tariff, the criteria used to assign customers to it, season definitions and TOU period definitions. These are explained in more detail in the sections below.
2.2.1 Tariff applicability
Utilities issue a variety of tariffs with each tariff geared to a specific class, or sector, of customers. These are often given informative names, such as residential, street-lighting, agricultural etc. , but the names have no specific technical meaning. These customer categories are defined in TAP using the market variable. The dominant distinction is between residential and non-residential, or general-service. The latter category applies to both commercial and industrial customers. The precise definition of customer class is referred to as the applicability of the tariff.
For residential tariffs there may be sub-classes based on location or the type of appliances used in the home (for example gas vs. electric heating). Some utilities offer optional time-of-use or
Figure 3: ExampleText of Applicability
other experimental tariffs to residential customers. TOU tariffs are also commonly offered to non-residential customers, and in some cases are mandatory. In the non-non-residential sector, sub-classes are typically based on the physical limitations of the service that is delivered under the tariff, the most common of these being peak demand (kw), energy usage (kwh), and service voltage (kV). An example of text used to define the conditions of applicability is shown in figure 3.3
The TARIFF table includes fields for the demand limits and energy consumption limits defining tariff applicability. In the example of figure 3, the lower and upper limits for demand are 0 and 30 respectively, and the lower and upper limits for energy use are 0 and 3000. TAP also stores a logic (and/or) variable indicating whether either or both limits are to apply. In this example, the tariff specifies that both conditions must be met, so the logic field would be set equal to and.
The tariff applicability may also depend on the customer service voltage. For example, a high-rise office building will probably get service at a higher voltage than a small store. Service voltage is typically distributed in discreet steps and referred to by common names such as residential, secondary, primary, and transmission voltage. While the names are standard, the actual numerical limits associated with them are not. TAP stores both the service type name and the voltage limits associated with that service, if these are available.
2.2.2 Utility tariffs and TAP tariffs
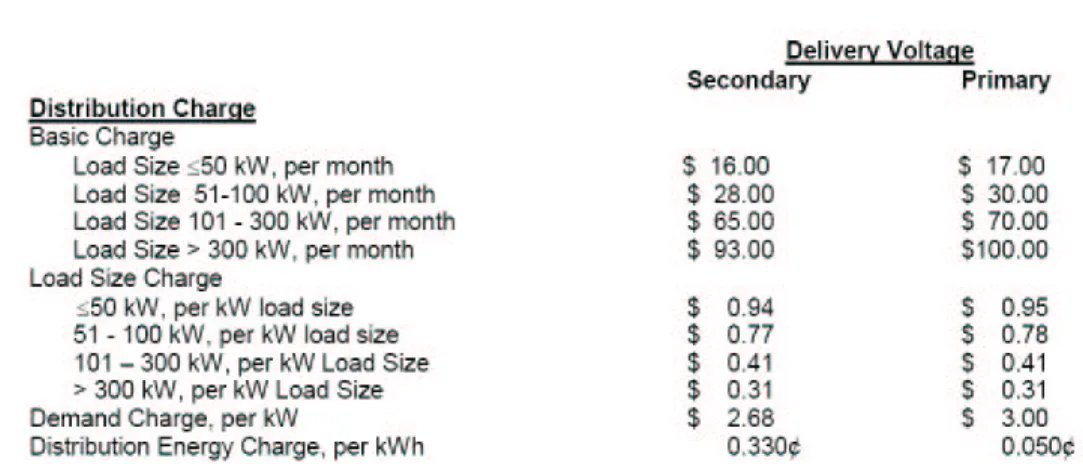
Utilities define and publish their tariffs in individual documents referred to as schedules. These schedules do not always strictly follow the rules of applicability implemented in TAP. For example, a single utility tariff schedule may describe rates for customers at several service voltages. Figure 4 is an example of a tariff that covers several applicability categories.4
In the example of figure 4 a single document defines rates for different ranges of load size (demand) and delivery voltage (service voltage), for a total of eight customer classes according to the TAP applicability rules. This is handled in TAP by creating eight versions of the tariff, each with a unique schedule name and id. We refer to these as TAP tariffs. These sub-classes and associated TAP tariffs must be defined by the user at the time of data entry.
3This example comes from Georgia Power. 4This tariff comes from Pacific Power and Light.
Figure 4: Example tariff showing several customer sub-classes
Utility Jan Feb Mar Apr May Jun Jul Aug Sep Oct Nov Dec
Beauregard Electric W W W S S S S S S S S W
Idaho Power W W W W W S S S W W W W
Table 1: Season definition table, S=summer, W=winter
Utilities typically label tariff schedules with both a a name and a code; for example, ”Large General Service 1” as the name and ”LGS-1” as the code. TAP saves both of these fields for informational purposes. As there is not a one-to-one relationship between TAP tariffs and utility tariffs, TAP tariffs cannot be identified from these designations. Instead, the internally defined
tariff idis used to uniquely identify each tariff.
Utilities also frequently publish riders, which are additional documents with adjustments or amendments to the rates and rules specified in a tariff. A common example is a fuel cost surcharge. In TAP, riders are not treated separately. Instead, during the data entry process all applicable charges, from all source documents, are combined as appropriate into the rates stored in the GROUP and BLOCK tables. A publish note field in the TARIFF table allows the user to add comments about the data as needed.
2.2.3 Tariff seasonal definitions
Many tariffs have seasonal rates, where the amount charged per kw or per kwh changes according to the season. The only seasons utilities appear to use aresummerandwinter. The specific periods covered by each season are defined in the tariff document. In TAP, we assume that seasons are always defined as a set of calendar months, and assign a season flag to each month. The data are stored in the SEASON table. Two examples are illustrated in table 1. Here, summer is defined
Utility Season Hour Ending
1 2 3 4 5 6 7 8 9 10 11 12
PG & E Summer F F F F F F F F F S S S
PG & E Winter F F F F F F F F F S S S
Conn Pwr & Lt Winter F F F F F F F F F F F N
Utility Season Hour Ending
13 14 15 16 17 18 19 20 21 22 23 24
PG & E Summer N N N N N N S S S S F F
PG & E Winter S S S S S S S S S S F F
Conn Pwr & Lt Winter N N N N N F F F F F F F
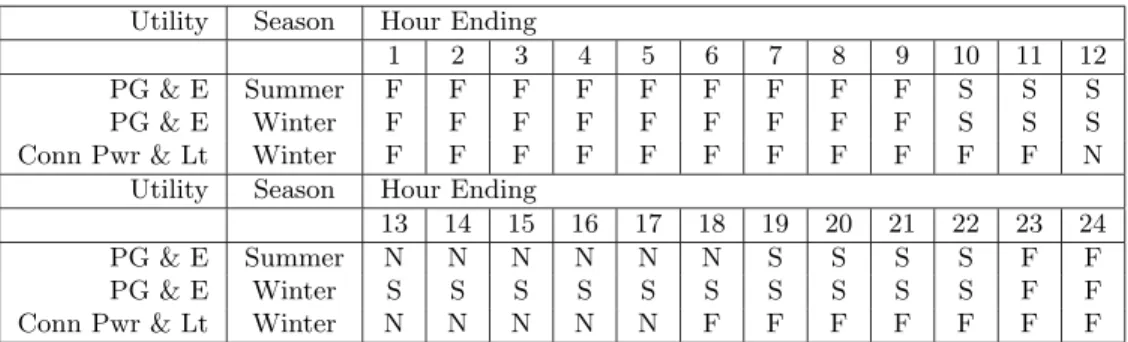
Table 2: TOU hours definition table, N=on-peak, F=off-peak, S=shoulder
as April through November for Beauregard Electric, while for Idaho Power summer consists of the months of June, July and August. Season definitions are also displayed at the TAP website.
2.2.4 Tariff time-of-use definitions
Time-of-use tariffs have rates that are conditionally applied based on the time of day that electricity use takes place. Utilities distinguish either two or three periods: on-peak, off-peak and if there is a third type, shoulder.5
Customers on TOU tariffs have special meters that record their electricity consumption and peak demand separately for each period. The specific hours of the day and days of the week that correspond to each period type are defined in the utility tariff document. The TOU period definitions may vary seasonally–for example, peak hours may occur in the morning in winter, and in the afternoon in the summer. In TAP the TIME OF DAY table contains the assignment of the hours-of-day and period type by season. A table illustrating time-of-use periods is displayed along with the tariff at the TAP website. A schematic of the TOU periods definition is shown in table 2. Here F refers to off-peak, S to shoulder and N to on-peak, while hour-ending 1 means the hour that ends at 1am, etc. Each hour of the day is assigned to one of the categories. If the assignment is season-dependent, the SEASON table must be used to associate a calendar month with the season.
2.3 Group level data
In order to understand how the group and block tables are structured, it is necessary to go into a little more detail about how tariffs are specified. Tariffs generally apply multiple conditions and rates to be the same inputs. The group and block structures are used to organize this information and create groups of charges that are applied under standardized conditions. The group structure separates charges according to rate type, season, time-of-use period, and the aspect of service the customer is being charged for. The latter are chosen at the time of data entry from a finite set
Figure 5: Hierarchy of groups and blocks in a tariff
rate type id rate type units
1 Energy c/kwh
2 Demand $/kw
3 Fixed $/day
Table 3: Rate types and associated units
which includes generation, transmission, fuel cost adders, etc. A group is a self-contained sub-unit of the tariff, which specifies rates over the entire range, from zero to infinity, of possible demand and consumption levels.
This organizational structure is illustrated graphically in figure 5, and using the simple example tariff of figure 6. In the example of figure 6, there are two rate types (fixed and energy) and three groups (fixed, energy-summer and energy-winter). The fixed rate group has only one block, and each energy rate group has four blocks. The group id attribute of the GROUP table is used to uniquely identify each of the groups, and is carried into the BLOCK table to associate a set of blocks to a particular group. This attribute is assigned automatically by the web interface that is used to enter the data (see Section 4.7).
2.3.1 Rate types
The three basic inputs needed to calculate a bill are the billing period, the energy consumption and the peak demand. There are three corresponding types of charges orrate types: fixed, energy
and demand. Energy and demand charges are based on the kwh of consumption and kw of demand during the current billing period. Fixed charges are levied for access to electric service and are independent of the level of electricity use. Each tariff will contain some or all of these rate types. In the GROUP table the rate type is used to assign each component to one of these rate types. The rate type and units for each rate type are listed in table 3.
2.3.2 Temporal Conditions
Rates are applied conditionally depending on the season and TOU period. Each group is associated with a particular season and period, using the attributes season and time-of-day. The season attribute takes on the values summer, winter, or all-year. Summer and winter are related to the calendar month through the SEASON table (see also table 1). The all-year classification is used to identify rates that apply all year round. The time-of-day attribute takes the valuespeak,off-peak,
shoulderorall-day. The TOU periods are assigned to hours of the day and days of the week using data from the TIME OF DAY table (see also table 2). The all-day value applies to any rate that is not attached to a particular period. Any combination of season and period can be attached to a row of the GROUP table. The bill calculation algorithm includes code to check the month and TOU period of the input data, so that the appropriate rates can be applied.
In order to calculate TOU bills correctly, the energy use data must be properly allocated to the seasons and TOU periods defined for the given tariff. This is straightforward in principle if hourly energy consumption data are available. Scripts that parse hourly data onto TOU periods have been developed for other applications, including the Home Energy Saver web-site [2], but are not yet included in the TAP.pm module.
2.4 Block level data
Each group has its own block structure, which reflects the way rates vary as a function of the level of energy use. A block defines a limited range of input data values over which a given rate applies. The block table includes a sequence variable that effectively numbers the blocks so that the upper limit of the 1st block is equal to the lower limit of the 2nd block and so on. TAP stores only the information needed to define the upper block limit. Blocks exist for both energy and demand charges. The lower and upper limits of the block can be constants or functions of the input data6
. TAP has catalogued several of the most common functions and developed a system for parameterizing them within the database using theblock type id attribute.
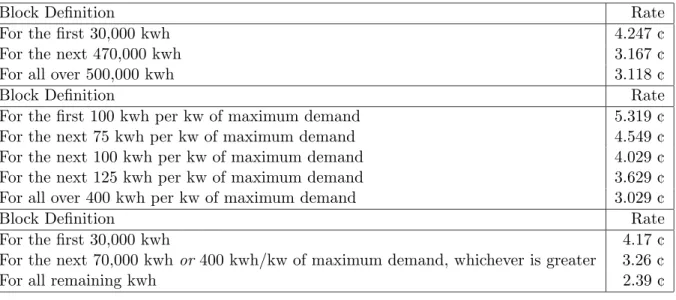
Three examples of different types of block limit are illustrated in table 4. In the upper section of the table, the first example has three energy blocks with constant limits. The first block has a rate of 4.247c/kwh and is applicable to consumption in the range from 0 to 30,000 kwh; the next block has a rate 3.167 /kwh and is for consumption in the range 30,000 to 500,000 kwh; the last block has a rate of 3.118 c/kwh for all consumption above 500,000 kwh.
Figure 6: Sample tariff with three groups
The other two sections of tables 4 illustrate simple block functions. The second section shows a case where the block limits are defined as a multiple of the current month demand. We refer to these as block-by-demand energy charges (in the industry they are also known as hours charges). The components stored in the database are the multipliers needed to calculate the block limits. In this case, these are 100 for the first block, 175 for the second, 100 for the third, 125 for the fourth and 400 for the last, with units of kwh/kw. In the last section of table 4 we show an example of a conditional block limit. In this case the upper limit of the second block is either the sum 30,000 + 70,000 or the sum 30,000 + 400×Dm, whichever is greater (here Dm is the demand in
the current month). TAP treats this conditional expression as a distinct block limit function. Table 5 illustrates how the block groups defined in table 4 would be stored in the database. The first column is thesequenceattribute that is used to order the sequence of blocks. The second shows the value of the rate. The next three columns,block type id,param kwandparam kwh, store the information needed to define the block limits. The block type id is a flag that indicates which type of limit function should be used to define the block limit, while param kw and param kwh are the inputs to this function. These parameters may correspond to the upper limit of the current block, or define the length of the current block, depending on how the block types are defined. The bill calculation scripts use the block type id to define the appropriate interpretation of param kw and param kwh. The different block types and associated interpretations are presented in table 19 of the Appendix. If a given block type does not need a parameter, its value is set as NULL. The last block in a group is assigned the block type id=9999999 to indicate infinity, and the end-of-group
function to indicate that no other blocks should follow it.
Block Definition Rate
For the first 30,000 kwh 4.247 c
For the next 470,000 kwh 3.167 c
For all over 500,000 kwh 3.118 c
Block Definition Rate
For the first 100 kwh per kw of maximum demand 5.319 c
For the next 75 kwh per kw of maximum demand 4.549 c
For the next 100 kwh per kw of maximum demand 4.029 c
For the next 125 kwh per kw of maximum demand 3.629 c
For all over 400 kwh per kw of maximum demand 3.029 c
Block Definition Rate
For the first 30,000 kwh 4.17 c
For the next 70,000 kwhor 400 kwh/kw of maximum demand, whichever is greater 3.26 c
For all remaining kwh 2.39 c
Table 4: Three types of energy groups. The first has three blocks with constant block limits, the second five blocks with block-by-demand limits, the third 3 blocks with conditional limit functions.
sequence rate block type id param kwh param kw
0 4.247 1 30,000 NULL
1 3.167 1 500,000 NULL
2 3.118 99 9999999 9999999
sequence rate block type id param kwh param kw
0 5.319 2 NULL 100
1 4.549 2 NULL 175
2 4.029 2 NULL 275
3 3.629 2 NULL 400
4 3.029 99 9999999 9999999
sequence rate block type id param kwh param kw
0 4.17 1 30,000 NULL
1 3.26 3 100,000 400
2 2.39 99 9999999 9999999
has constant limit functions with block type id=1 for all three blocks. Here param kwh represents the upper limit of the block, which is 30,000 for the first block, 30,000 + 470,000 = 500,000 for the second block, and infinity for the third and last block. No demand data are needed so the param kw values are NULL. The second section of table 5 shows how a block-by-demand energy group is stored. This type of limit function has block type id=2. Here param kwh is NULL, and param kw is used to store the multiplier that determines the upper limit of the block. It is 100 for the first block, 100 + 75 = 175 for the second block, 175 + 100 = 275 for the third block, etc. In the last section of table 5, the first block uses a constant limit function and so the first row of the table is structured as in the first example. The second row stores the data defining a conditional block with block type id=3. The param kwh field is used to store the constant upper bound of 30,000+70,000 = 100,000, and param kw is used to store the multiplier that determines the length of the block-by-demand block. A summary of how param kw and param kwh are interpreted for different block types is given in the BLOCK TYPE table, included in the Appendix.
3
TAP Inputs and Outputs
In this section we describe some procedures for getting data into and out of TAP. To begin with, we provide an overview of the tariff survey and data entry process. We then explain in more detail how tariffs are updated and expired tariffs are archived. This section concludes with a presentation of the existing TAP bill processing scripts.
3.1 Tap data collection
The TAP data collection process are summarized in the series of steps below. All data are entered through the web interface, which automatically populates the appropriate tables.
• Determine the sample of utilities to be sampled. For each utility, TAP requires the data listed in the UTILITY table (table 8).
• Select the particular tariffs from each utility that will be collected. Since each utility has its own criteria for defining service classes, this step may require some judgment calls. For TAP purposes, enough information must be included to identify clearly the group of customers which are covered by the tariff.
• For each of the selected tariffs make whatever sub-divisions may be necessary to be consistent with the database table structures used in TAP (see section 2.2.2). This step separates out tariffs that may be described in a single document by the utility, but which are logically distinct according to the way TAP defines a customer. The data needed to specify a tariff within TAP are detailed in the TARIFF table (table 10).
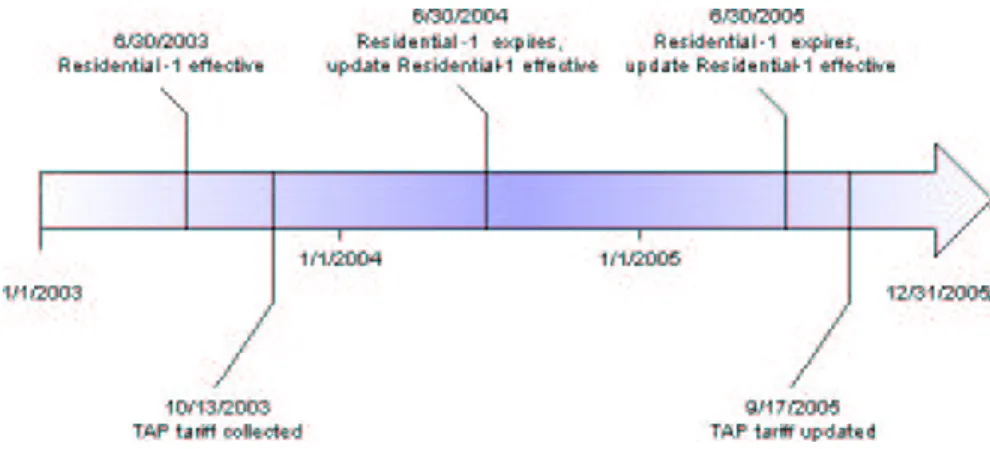
tariff id Schedule status doc date doc date date date effective expired effective expired 17 Residential-1 Published 6/30/2003 6/30/2004 10/13/2004 NULL 17 Residential-1 Expired 6/30/2003 6/30/2004 9/17/2005 9/17/2005 805 Residential-1 Published 6/30/2005 6/30/2006 9/17/2005 NULL
Table 6: Example of how tariff documents are dated in TAP
• Data are entered using the website interface. The user creates customized forms for the tariff, and uses these to enter the rate and block limit information. The form structure automatically determines the group, block and rate type attributes within the database. It is up to the user to review all relevant documents and make sure that all the charges are included. During the data entry process, the tariff is classified as editing. Data for tariffs with this status can be changed as often as desired.
• Once the tariff has been reviewed for accuracy and validated, its status is changed topublished. Only published tariffs are displayed to the general public on the website.
• To update an existing tariff, a copy of the tariff can be made from the web interface. This copy will automatically be given the editing status. The status of the existing tariff can then be changed toexpired, and the new version updated and published. This procedure is explained more fully in the next section.
3.2 TAP as a tariff archive
Tariffs are legal documents with a limited lifetime. When a tariff is issued it is given a legal effective date, and may include a future expiration date indicating when the tariff will become invalid. In general, the tariff database will be updated on a schedule that is independent of these official utility dates, so there will be some lag between when a tariff legally expires and when the corresponding TAP tariff is updated. For this reason, the TARIFF table stores two pairs of dates for each tariff. The first pair stores the legal dates as defined by the utility, which are labelled doc date effective
and doc date expired. The second pair of dates refer to the TAP data entry process. The date when the tariff is published is defined as the date effective, while the date that the tariff expires
in TAP is the date expired. If there is a delay in updating data, the date expired may be later than the doc date expired. This means that while the tariff may no longer be legally valid, it is still considered valid within TAP, as it is the most recent data available. It may also happen that a utility will revise its tariff before the legal doc date expired, and the TAP tariff will be revised before this date. In our review of TAP tariffs we have not found that the rates change drastically over time, so that two years is probably a reasonable time scale for updating the database.
Figure 7: Tariff update timeline, see also table 6
blue arrow of figure 7 refer to the legal dates for the utility documents. The events below the blue arrow show dates when the tariff data are entered, expired and updated in TAP. The entries in table 6 show how this data would appear in the TARIFF table columns.
Expired tariffs are kept in the database, to eventually provide a historical record of rates. The
status field in the TARIFF table is used to indicate whether a tariff is published,expired, or is in
editing. The editing stage corresponds to data entry and verification, when small changes may be made to the tariff data. Once a tariff has been validated it is published. Only published tariffs are displayed on the website. If a tariff is revised during a database update, the status of the existing version of the tariff is changed from published to expired. The new version of the tariff (which may be identical if the rates don’t actually change) becomes the published version.
3.3 Bill processing
The TAP project includes development of a set of subroutines or scripts that can be used to perform various functions, such as access the TAP database, assign customers to tariffs, and calculate customer bills. The bill calculation subroutines have been compiled into a Perl module called TAP.pm, which is described in this section. Five of the subroutines will typically be called by a user, while the others act as helper functions. The five user subroutines are:
• openDB()opens a connection to the TAP mySQL database
• closeDB()closes the connection to TAP
• get TAP()retrieves a set of TAP database tables in CSV file format
Figure 8: Bill calculator flow diagram
• get bill hash()calculates a bill using TAP CSV files
The bill calculation process is carried out identically by get bill and get bill hash, and is illus-trated in the flow diagram of figure 8. Each tariff is first sorted by group and by block and the component data are stored in local Perl variables. The code then steps through each of the sorted components and determines if the rate applies to the current input data, and if so what is the re-sulting charge. Conditions are applied in the following order: First the season and time-of-day are cross checked with the input billing month and time period. Next the block limit functions are run. The code then checks whether the current usage and demand fall within this block, and determines the charges if true. This step loops through each block and then each group, at each loop adding the charges to an accumulated total. The next section provides a more detailed discussion of each subroutine and how it fits into this process.
3.4 TAP.pm subroutines
The TAP code is written in Perl and uses standard Perl conventions [7] for variable scoping and subroutine calls. It also uses the Perl module DBI.pm, which allows direct access to a mySQL database from a Perl script. In the descriptions below,Inputsare parameters passed as arguments to the subroutine, Outputs are values returned by the subroutine, and Global variables are values that are accessible to all the subroutines in the module.
Name: openDB()
link to the database. It is required by the TAP.pm functions get bill and get TAP.
Requirements: An active network connection is needed to access the database.
Inputs: None.
Outputs: None.
Global variable impacts: A database handle, $dbh, is created as a global variable.
Name: closeDB()
Description: Closes the $dbh database handle to the TAP database.
Requirements: An active network connection.
Inputs: None
Outputs: None
Global variable impacts: $dbh is closed as a global variable.
Name: get TAP()
Description: Writes either the active TAP database or the tap test cases database to csv files. Only the elements required to calculate bills are written. Once the csv files are generated a remote user can run stand-alone calculations without an active network connection.
Requirements: A valid database handle to TAP, created by openDB.
Tables Accessed: GROUP, BLOCK, TIME OF DAY, SEASON, TARIFF, UTILITY.
Inputs: project id, testdb. Project id identifies the project, which in turn identifies the specific subset of the full tariff set to be used in the current calculations. If project id=1 all tariffs in the TAP database are retrieved. If testdb=1 the test database is retrieved instead.
Outputs: The csv files component.csv, tariff.csv (minus the description, publish note and date fields), hours def.csv, season def.csv and tariff view.csv are written to the default directory.
Name: load txt()
Description: Loads the data in the csv files created by get TAP into TAP.pm hashes.
Requirements: The csv files created by get TAP must be in the default directory.
Inputs: None
Outputs: None
Global variables impacted: Creates the following hashes withtariff idas the key: @comp{$tariff id}, @season def{$tariff id}, @tariff{$tariff id}, @hours def{$tariff id}.
Name: get bill(), get bill hash().
Description: Bill calculator functions. If the TAP data are read from csv files get bill hash should be used; get bill is used with an open connection to the database. Otherwise, both subroutines are the same. Calculates the utility bill charges for one month given the tariff ID, the month of service, and the consumption and billing demand for that month. One row of the BLOCK table, with re-lated seasonal and time-of-day information from the corresponding GROUP entry, is retrieved and loaded into the@component array. This corresponds to one block of one group for the tariff. The
subroutine loops through all the groups and blocks, calling add charges to calculate the charges, which are then added to the @out bill array.
Requirements: load txt must be run before running get bill hash. An open database connection is needed to use get bill.
Tables Accessed: GROUP, BLOCK, SEASON.
Inputs: tariff id, month, off-peak demand, off-peak consumption, on-peak demand, on-peak con-sumption, shoulder demand, shoulder concon-sumption, (testdb for get bill only). The month is indexed by an integer between 0 (January) and 11 (December). If the tariff is not TOU, the consumption and demand data are entered in the off-peak slots, with the other values equal to zero.
Outputs: The array@out bill contains the bill charges in the following order: $out bill[0] = Total Bill
$out bill[1] = Total Energy Charge $out bill [2] = Total Demand Charge $out bill [3] = Total Fixed Charge $out bill [4] = Off Peak Energy Charge $out bill [5] = Off Peak Demand Charge $out bill [6] = On Peak Energy Charge $out bill [7] = On Peak Demand Charge $out bill [8] = Shoulder Energy Charge $out bill [9] = Shoulder Demand Charge $out bill [10] = All-day Energy Charge $out bill [11]= All-day Demand Charge
Global variable impacts: Uses the tables @comp{$tariff id} and @season def{$tariff id} to load @component with the data needed to define the block limits, rate type, and rate. Initializes @charges, $lastmax and $more charges. Updates the values in @charges.
Name: add charges ()
Description: This subroutine calls assess fixed, assess energy and assess demand to calculate the charges for the block. It then adds them to the @charges array. The elements of @charges are the energy and demand charges for the peak, off-peak, shoulder and all-day periods. The all-day values are computed locally, with all-day consumption equal to the sum of the consumption values in each period, and all-day demand equal to the maximum over the demand values in each period.
Requirements: Assumes the @component global variable has been loaded appropriately.
Inputs: Off-peak demand, off-peak consumption, on-peak demand, on-peak consumption, shoulder demand, shoulder consumption for the current month.
Outputs: None.
Global variables impacted: Writes to the array @charges.
Name: assess charges()
of $lastmax and $more charges.
Requirements: Assumes the @component global variable has been loaded appropriately. Uses $last-max to determine the starting point of the current block.
Inputs: The upper limit of the current block, and the consumption or demand value for the current month and period.
Outputs: The dollar value of the charge for this block.
Global variables impacted: Resets $lastmax, changes the flag $more charges if the current block is the last block in the current group.
Name: assess demand ()
Description: This subroutine calculates the demand block limits to be used for the current demand block. It then calls assess charges, which returns the value of the demand charge for this block.
Requirements: Assumes the @component global variable has been loaded appropriately.
Inputs: demand value for the current month and period.
Outputs: Returns the demand charge for the current block.
Global variables impacted: None.
Name: assess energy ()
Description: This subroutine calculates the energy block upper limit to be used for the current energy block, using the function definitions listed in table 19. It then calls assess charges, which returns the value of the energy charge for this block.
Requirements: Assumes the @component global variable has been loaded appropriately. Uses $last-max to determine the starting point of the current block.
Inputs: Demand and energy values for the current month and period.
Outputs: Returns the energy charge for the current block.
Global variables impacted: None.
Name: assess fixed ()
Description: This subroutine returns the fixed charge for the current month and period.
Requirements: Assumes the @component global variable has been loaded appropriately.
Inputs: None.
Outputs: The fixed charge for the current month and period.
3.5 Test Functions
To validate the TAP.pm code, a set of test tariffs has been defined. These essentially isolate each tariff construct so it can be checked explicitly. Because the bill is just the sum of charges for each component, this method is sufficient to validate the code for any tariff that fits into the existing table structure. They are stored in a separate tariff-level database called tap test cases. Tests can
be run using the get bill code by setting a flag that tells it to connect to this database instead of the usual TAP database.
4
TAP Web Application
The TAP website is an interactive web application for browsing, managing and expanding the TAP database. These actions are performed by PHP [3] scripts that access and display the TAP data. The website also contains links to a number of documents explaining more about the TAP project. Figure 9 provides an overview of both the information available at the site, and the user applications. Each box represents one web page, which also corresponds to one web script. In this section, each of the web pages is described in detail. For technical reference, a set of tables summarizing the PHP scripts is provided in the Appendix.
Four categories of user are defined, with each user category having different levels of access to the database. Loosely, the user categories are:
• Readers: users with no special permissions. This category includes the general public. They may view the database but may not manipulate the data in any way.
• Authors: users who have been granted permission to add new data to the database, and edit data which has not yet been published.
• Publishers: users who check tariffs for accuracy and have been granted permissions to publish or remove them from the public realm.
• Administrators: super-users who are responsible for granting or revoking the permissions of all other users.
Currently, readers can browse the TAP database without creating an account. To become an author or publisher, a user must register with the TAP administrators, and undergo some training to ensure that they understand how to convert tariff document data to the TAP format. In principle, a widely dispersed set of users can contribute to maintaining and expanding the TAP data, which will hopefully make the application useful to a wider community. The next few sections describe the functionality currently implemented at the website.
4.1 Global configurations
The global configuration is a file used to store and call the basic functions needed to initialize each page of the TAP website. Theses functions perform the following tasks: manage connections to the TAP database, control the look and feel of the website, and manage the login status of users. Though it is not technically necessary to have this functionality in a single file, it is done for administrative convenience.
Permission Name Description Author Publisher Admin
Add tariffs Add new tariffs; these will haveeditingstatus X X X
Edit Tariffs Edit any tariff that has the statusediting X X X
Edit Published Tariff Edit anypublished tariff X X
Delete Tariff Remove tariffs from the database or change status toexpired
X X
Publish Tariff Change tariff status fromeditingtopublished X X
Download Tariff View and download tariff document files stored on the web server archive
X X
Browse Users View the permissions and user information of all registered users
X
Edit User Grant or revoke permissions for registered users X
Delete User Remove registered users from TAP X
Table 7: Definition of user permissions
4.2 Managing users
The TAP administrator is responsible for defining which set of actions a user can access through the website. To ensure data integrity, the ability to manipulate data is granted only to registered users on a case by case basis. While permissions fall generally into the four user groups defined above, in reality any user can have any permission. User data and permissions are stored in the USER table of the TAP database. Table 7 provides a list of permissions, the associated action, and flags indicating whether or not different user groups typically have the permission (readers do not have any special permissions).
4.2.1 Creating a user profile
On any page a new user may register with TAP by clicking on the Create a Profile link, which appears in the upper right corner of the page. Users are asked to provide their first and last names, telephone number, and email address. Once this information has been submitted TAP will generate a password and email it to them. New users are created with reader level permissions.
4.2.2 Editing a user profile
Users can change their personal information by clicking on the Edit your Profile link. This is only available to registered users, and the link becomes available only after a user has logged into the TAP website.
4.2.3 Retrieving passwords
Users can request that their password be emailed to them at any time by clicking the Forgot Password link.
4.2.4 Changing passwords
A registered user can change their password at any time by clicking the Change your Password link that becomes available after logging in. The new password will be emailed to the user.
4.2.5 Browsing users
The Browse Users page is used by administrators to view the set of registered TAP users and their permission settings. From this page an administrator can select a user profile to edit or delete.
4.2.6 Editing users
The Edit Users page is used to grant or revoke permissions from individual users. In order for administrators to perform these operations they must have the Edit User permission.
4.2.7 Deleting users
Deleting users is an administrative function that permanently removes a user from TAP. It can be done by clicking the Delete link next to the target user’s name on the Browse Users page. To delete a user, the administrator must have the Delete User permission.
4.3 Searching the TAP database
The TAP website was designed to make the display of utility and tariff information more intuitive and accessible. Like the TAP database, it uses a standardized form for the tariff data. The top page of the website displays two interfaces that allow a user to quickly search for tariffs in the database: the tariff and utility search forms. These are shown in figure 10. The utility search returns the results of a query on the UTILITY table, while a tariff search allows the user to do a query on the TARIFF table.
4.3.1 Searching by utilities
The utility search interface can take any combination of the following inputs:
• Utility NameThis input can be used to query the utility table on either a portion of a utility’s name, or the EIA code. If a text string is entered, utility records are matched by the utility’s name, or fragment there of; if an integer is entered, records are matched on the EIA code [6].
Figure 10: Utility and Tariff Search Forms
• Stateis a select menu of US states.
• Ownership typeis a select menu of possible utility ownership types.
• Customer typeis a select menu of possible utility customer classes.
The utility search results are returned as a list alphabetically sorted by utility name. Each list item is a hyperlink to the utility’s profile page.
4.3.2 Searching by tariffs
The Tariff search interface can take any combination of the following inputs:
• Demand between X and Y kw will match all tariff records with X values greater than the min kw, and Y values less than the max kw fields of the Tariff table. If only X or Y is entered, it will act as either the upper or lower bound on the returned results.
• Serving Marketsis a select menu of possible tariff electricity market segments (e.g. residential, non-residential, and agricultural).
• Service Voltage is a select menu of possible tariff electricity service classifications (e.g. sec-ondary, primary).
• U.S. Stateis a select menu of US states.
The tariff search results are returned as a series of grouped lists three levels deep. The highest level of grouping is by the state in which the tariff is issued; followed by the utility that issues the tariff, followed by the tariff itself at the final level.
4.4 Viewing TAP data
4.4.1 The utility profile
The utility page is a report template for the data from the UTILITY table of the TAP database, and is illustrated in figure 11. It is divided into two sections: general utility information at the top, and a list of the TAP tariffs for this utility at the bottom. General utility information is drawn from all the TAP database tables that are related by the util id key value.
The list of tariffs is drawn from the TARIFF table. The tariffs are grouped by market segments, and then sorted by service voltage and peak demand range. Each listed tariff is a link to the tariff profile page.
4.4.2 The tariff profile
The tariff page is a report template for the data from the TARIFF, GROUP and BLOCK tables of the TAP database, and is illustrated in figure 12. The template is divided into five sections:
1. Basic utility information is a display of the issuing utility’s name, state, etc. It is intended for reference and as a navigational aid.
2. General tariff data is a display of information that describes the type of customer that would be assigned to this tariff.
3. Tim-of-use hours is a graphic representation of how the TOU periods are defined for the tariff. This section is only displayed for time-of-use tariffs, and is not shown in figure 12.
4. Description of rates is a list of rates. Rates are grouped into fixed, energy and demand. The data displayed here are selected from the GROUP, BLOCK, RATE TYPE, and RANGE TYPE tables.
5. The Bill Calculator is an interactive monthly bill calculator which interfaces with the TAP.pm module. Users can input values for the energy, demand, and calendar month, and the function will return a bill for the displayed tariff. The list of inputs changes as appropriate for time-of-use tariffs.
4.5 Manipulating tariff data
Entering and editing data in the TAP database is done through a series of web forms. The rela-tionship between the forms is described below.
4.5.1 Adding and editing tariffs: the tariff form
The primary data entry form is thetariff form. It is used to manipulate the data of the TARIFF table. Sub-forms for adding time-of-use hours and seasons, rate structures, ratchet descriptions, and archive files are all accessed from the tariff form.
4.5.2 Adding and editing rate structures: the tariff component form
The primary purpose of the TAP web application is to provide an interface that allows tariff data to be entered following the standardized format developed for TAP. The operational core of the interface is the tariff component form, which is used to enter a set of blocks forming a group (see also section 2.3). This form is complex, as it must be able to differentiate one rate type from another, allow different rates to be grouped, and allow for different time-of-use periods to be associated with these rate groups. Experience has shown that, to reduce errors in data entry, the tariff component form should be customized to the rate type, and should reflect the language that appears in actual tariff documents to the extent possible. This approach greatly facilitates the data entry process and also helps the user maintain consistency in tariff interpretation. Figure 13 shows how a section of the form (in this case for entering energy rates for a time-of-use tariff) would look to the user. A set of rate control buttons at the right edge of the window allow the user to easily add, delete, copy and reposition items in the form.
The tariff component form is used to input the three basic rate types as follows:
• Fixed Charges are the charges that appear on the bill independent of energy use levels. They are normalized in TAP to a per-day charge. The monthly charge is calculated by multiplying by the number of days in the month.
• Energy Charges are by far the most complicated part of any tariff. The TAP application currently handles 10 different block structures for energy charges, as listed in table 19.
• Demand Charges are the dollar per kW charges, based on the peak demand for a given billing period. These can be structured in blocks, but to date only blocks with constant limits have been seen in the tariff data.
4.5.3 Defining temporal conditions
The seasons form and the hours form are used to define the seasons of the year and time-of-day periods. As not all tariffs need this information, these forms are optional. They are very intuitive to use, as illustrated in figures 14 and 15.
Figure 13: Tariff component form detail
4.5.4 Defining a ratchet
Aratchet, also known asdetermination of billing demand, is a billing structure that utilities use to encourage customers to minimize their annual peak demand. A ratchet defines the billing demand for the current month as the maximum monthly demand over some previous period, typically one year. Currently, ratchets are not implemented in the bill calculation subroutines. Ratchet information is stored in TAP as text for informational purposes only.
4.5.5 Archiving tariff files
The original tariff documents in electronic format are uploaded to the web server to be kept as a reference. These files are only available to users with Download Tariff user privileges. TAP is not a public distributor of utility documents; for this reason special permission is needed to download these files. The document archive is managed as follows:
• files are stored on the web server.
• files are uploaded to the /tmp dir, they are then moved to the corresponding utility directory.
• files for an individual tariff are indexed starting at one; if there is more than one file for an individual tariff the index increases.
• the utility directory path is /state abbrieviation/country code+eia code/
• tariff files are saved as country code+eia code+ +tariff id+ +index+.+extension
• files are owned by the apache web server and can only be accessed through the web
4.6 Managing the tariff data
Management of the tariffs in the database is done using the functions described below.
4.6.1 Copy tariff
Copy tariff copies a tariff and all associated files into a duplicate record in the TAP database. The new copy has the status editing. This feature is most useful when updating published tariff data, or when several tariffs have the same or similar structures. The user can start with the copy and edit and then publish the tariff, rather than entering the tariff from scratch.
4.6.2 Cancel tariff
The Cancel tariff feature is used to remove correct but out of date tariffs from the public domain. After a tariff has been cancelled it remains in the database for archival purposes, with statusexpired.