IMPROVING OUTAGE PROCESS MATURITY LEVEL USING A PROCESS MATURITY MODEL
by
Mervyn Petersen
Thesis submitted in fulfillment of the requirements for the degree
Master of Technology: Quality
in the Faculty of Engineering
at the Cape Peninsula University of Technology
Supervisor: Mr. A. Bester
Co-supervisor: Prof M. Moll
Bellville
DECLARATION
I, Mervyn Petersen, declare that the contents of this dissertation represent my own unaided work, and that the dissertation has not previously been submitted for academic examination towards any qualification. Furthermore, it represents my own opinions and not necessarily those of the Cape Peninsula University of Technology or Eskom.
_________________________ ____________
ABSTRACT
Author: Mervyn Petersen
Degree: Magister Technologiae in Quality
Title: Improving Outage Processes using a Process
Maturity Model
University or Institution: Cape Peninsula University of Technology
Faculty: Engineering
Date: September 2016
Key words: Outage, process maturity, improvement,
electrical industry
The research study establishes the maturity level of the outage process of the Outage Management Department at Eskom. The outage process started in 2012 to contribute to the effective planning and execution of outages. The successful completion of outages depends on effective planning and execution of an outage. At the time of the research study, poor outage performance at Eskom’s power stations contributed to load shedding of electricity in South Africa.
The research problem statement reads as follows: The absence of an outage process maturity indicator diminishes the ability of the Outage Management Department (OMD) to comprehend the current process maturity level. The research question: Will the Outage Management Department be able to identify improvement opportunities if the maturity level of the outage process is established?
The key research objectives are:
To consider how process maturity enables improvement.
To identify critical elements in an outage process.
To determine what is included in outage planning, control and improvement.
To identify a suitable process maturity model.
To identify a measurement instrument to determine the maturity level of Eskom’s outage process
The research study uses a descriptive research design and applies the survey research method. Greener and Martelli’s (2015: Online) Business Research Process (Sources: Greener & Martelli, 2015: Online) is used together with Farooq’s Research Steps for Survey Research (2015,
Online). The survey questionnaire adopted from Smith’s Maintenance
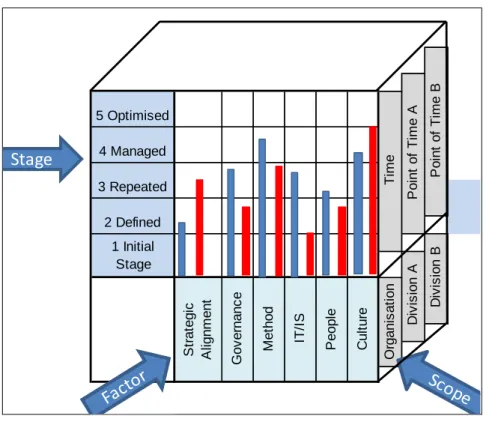
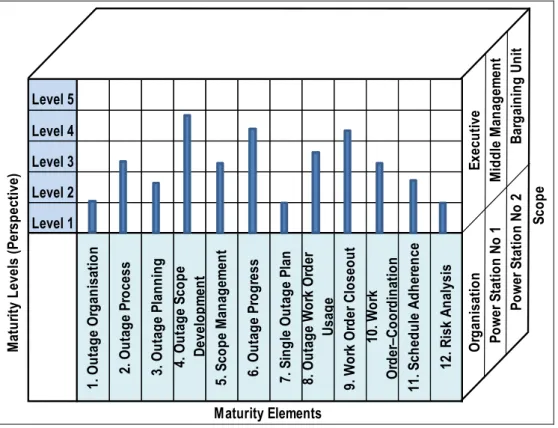
Planning and Scheduling Maturity Matrix (2013: Online) was used to develop the survey questionnaire. The author developed the Outage Management Maturity Framework by combining Business Process Management Maturity model and a Maintenance Planning and Scheduling Maturity Matrix.
The research finding is that a process maturity model can determine the maturity level of the outage process and is useful as a process improvement tool. The research findings rank the maturity level of the outage process at Level 2, Experimenting.
ACKNOWLEDGEMENTS
Firstly, I thank my heavenly Father God, Jesus Christ my savior and our sweet Holy Spirit for opening this door of opportunity and giving me the strength and insight to see it to its completion.
I thank the following people for the support and encouragement during this journey. Emerson said that Life is a journey, not a destination. What a journey it’s been.
Thank you Lynn for releasing me to pursue this goal and your support during this journey. To my son Jesse, for asking what my teacher said when I return from class with review comments all marked up in red pen and for commenting on my feedback, you are awesome. And to new born son Nicholas, who joined our family towards the end of this journey, arriving ahead of time and encouraged me to work towards completing this journey to spend time with you guys. Thanks to my father, Ronald and mother Mary for believing in me and for the encouragement.
I want to express my gratitude to Mr. Andre Bester (AKA Mr. B) for the support, encouragement and for always being there to guide me. Mr. B you never gave up on me and always saw me walking over that stage as a sign of the end! Thanks to Prof Moll for the break through that plotted the course for the research. Thanks to Noel and Rowena for paving the way and for making the road ahead a lot easier.
Thanks to Hennie and Dhiraj for supporting the research. Thanks to Simangele Mehlomakulu for being a sounding board during this process. Thanks to all my friends and family for their support and to the Outage Management Department for supporting the research.
TABLE OF CONTENT
DECLARATION II ABSTRACT III ACKNOWLEDGEMENTS V TABLE OF CONTENT VI LIST OF TABLES XLIST OF FIGURES XIII
GLOSSARY TERMS XV
CHAPTER 1: SCOPE OF THE DISSERTATION 1
1.1. INTRODUCTION 1
1.2. MOTIVATION 1
1.3 BACKGROUNDTOTHERESEARCHPROBLEM 2
1.4 STATEMENTOFTHERESEARCHPROBLEM 2
1.5 RESEARCHQUESTION 2
1.6 RESEARCHINVESTIGATIVEQUESTIONS 2
1.7 PRIMARYRESEARCHOBJECTIVE 3
1.8 THERESEARCHPROCESS 3
1.9 RESEARCHDESIGNANDMETHODOLOGY 4
1.10 DATACOLLECTIONDESIGNANDMETHODOLOGY 4
1.11 ETHICSSTATEMENT 4
1.14 CHAPTERANDCONTENTOUTLINE 7
1.15 CONCLUSION 8
CHAPTER 2: BACKGROUND TO THE RESEARCH ENVIRONMENT: A GENERAL PERSPECTIVE OF ESKOM’S OUTAGE MANAGEMENT
DEPARTMENT 9
2.1 INTRODUCTION 9
2.2 THECHALLENGESFACINGESKOM’SOUTAGEMANAGEMENT
DEPARTMENT 9
2.3 ANOVERVIEWOFESKOM’SOUTAGEMANAGEMENT
DEPARTMENT 13
2.4 OUTAGESDEFINEDINPOWERSTATIONSCONTEXT 14
2.5 RESEARCHPROBLEMIDENTIFICATION 22
2.6 CONCLUSION 23
CHAPTER 3: LITERATURE REVIEW – THE PROCESS MATURITY
MODEL AS A QUALITY IMPROVEMENT APPROACH 24
3.1 INTRODUCTION 24 3.2 PROCESSMATURITY 25 3.3 OUTAGEPROCESS 38 3.4 OUTAGEPLANNING 42 3.5 OUTAGECONTROL 56 3.6 OUTAGEIMPROVEMENT 59
3.7 MEASUREMENTINSTRUMENTTODETERMINEOUTAGE
MATURITYLEVEL 62
CHAPTER 4: RESEARCH DESIGN AND METHODOLOGY 74
4.1 INTRODUCTION 74
4.2 THETWOMAJORRESEARCHAPPROACHES 74
4.3 RESEARCHDESIGNANDRESEARCHMETHODOLOGY 78
4.4 RESEARCHASSUMPTIONS 84
4.5 RESEARCHCONSTRAINTS 85
4.6 THERESEARCHQUESTIONNAIRE 86
4.7 CONCLUSION 94
CHAPTER 5: DATA COLLECTION, ANALYSIS AND INTERPRETATION
OF RESULTS 95
5.1 INTRODUCTION 95
5.2 DATACOLLECTION 95
5.3 DATAANALYSIS 101
5.4 DATAVALIDITYANDRELIABILITY 103
5.5 THERESEARCHSTUDYDATAANALYSIS 108
5.6 INTERPRETATIONOFTHERESEARCHDATA 138
5.7 CONCLUSION 140
CHAPTER 6: CONCLUSION AND RECOMMENDATION 142
6.1 INTRODUCTION 142
6.2 THERESEARCHTHUSFAR 142
6.4 THERESEARCHQUESTIONSREVISITED 147
6.5 THEKEYRESEARCHOBJECTIVESREVISITED 148
6.6 THERESEARCHDESIGNANDMETHODOLOGYREVISITED 149
6.7 CONCLUSIONANDRECOMMENDATIONS 149
BIBLIOGRAPHY 152
APPENDIX A: OUTAGE MANAGEMENT MATURITY FRAMEWORK EXCLUDING THE SMITH’S PLANNING AND SCHEDULING MATURITY
MATRIX ELEMENTS 163
APPENDIX B: SURVEY RESULTS 167
APPENDIX C: SMITH’S MAINTENANCE PLANNING AND SCHEDULING
MATURITY MATRIX 177
LIST OF TABLES
TABLE 2.1:5WHY ANALYSIS FOR POSSIBLE CONTRIBUTING FACTORS TO LOAD
SHEDDING 10
TABLE 2.2:CAUSES FOR OUTAGE EXTENSION /SLIPS AS FOUND BY IAEA 16
TABLE 3.1:QUALITY MANAGEMENT MATURITY GRID 30
TABLE 3.2:QUALITY MANAGEMENT MATURITY GRID POINTS GUIDE 31 TABLE 3.3:ADVANTAGE OF USING EACH MODEL REPRESENTATION 37
TABLE 3.4:MANAGING FOR QUALITY 45
TABLE 3.5:DMAICPROJECT STRUCTURE 47
TABLE 3.6:COMPARING QUALITY IMPROVEMENT PHASES 49
TABLE 3.7:PLAN-DO-CHECK-IMPROVE MODEL 49
TABLE 3.8:MAINTENANCE PLANNING AND SCHEDULING MATURITY MATRIX 64
TABLE 3.9:OUTAGE ORGANISATION 66
TABLE 3.10:OUTAGE PROCESS 67
TABLE 3.11:OUTAGE PLANNING 67
TABLE 3.12:OUTAGE SCOPE DEVELOPMENT 68
TABLE 3.13:SCOPE MANAGEMENT AND OUTAGE PROGRESS 68
TABLE 3.14:SINGLE OUTAGE PLAN 69
TABLE 3.15:WORK ORDER USAGE DURING OUTAGE 69
TABLE 3.18:%PLANNED VS %UNPLANNED WORK 71
TABLE 3.19:SCHEDULE ADHERENCE 71
TABLE 3.20:RISK ANALYSIS 72
TABLE 4.1:CHARACTERISTICS OF THE QUANTITATIVE AND QUALITATIVE
APPROACHES 77
TABLE 4.2:RESEARCH METHODS 81
TABLE 5.1:DATA COLLECTION METHODS 96
TABLE 5.2:UNIT OF ANALYSIS QUESTIONS AND ANSWERS 98
TABLE 5.3:VARIABLES USED FOR THE RELIABILITY CHECK FOR INTERNAL
CONSISTENCY OF THE SCALE 107
TABLE 5.4:CRONBACH’S ALPHA RELIABILITY STATISTIC 107 TABLE 5.5:RESPONDENTS NUMBER OF YEARS IN ESKOM SERVICE 110
TABLE 5.6:RESPONDENT’S TASK GRADE 110
TABLE 5.7:RESPONDENTS PER POWER STATION 111
TABLE 5.8:CROSS-TABULATION COMPARING THE YEARS IN ESKOM SERVICE PER
POWER STATION 112
TABLE 5.9:SUMMARY OF THE RESPONDENTS TO THE OUTAGE ORGANISATION
SECTION OF THE SURVEY 116
TABLE 5.10:SUMMARY OF THE RESPONDENTS TO THE OUTAGE PROCESS
SECTION OF THE SURVEY 118
TABLE 5.11:SUMMARY OF THE RESPONDENTS TO THE OUTAGE PLANNING
TABLE 5.12:SUMMARY OF THE RESPONDENTS TO THE OUTAGE PLANNING START
(OUTAGE STARTS)SECTION OF THE SURVEY 120
TABLE 5.13:SUMMARY OF THE RESPONDENTS TO THE OUTAGE SCOPE
DEVELOPMENT SECTION OF THE SURVEY 121
TABLE 5.14:SUMMARY OF THE RESPONDENTS TO THE SINGLE OUTAGE PLAN
SECTION OF THE SURVEY 122
TABLE 5.15:SUMMARY OF THE RESPONDENTS TO THE SCOPE DEVELOPMENT
SECTION OF THE SURVEY 124
TABLE 5.16:SUMMARY OF THE RESPONDENTS TO THE OUTAGE PROGRESS
SECTION OF THE SURVEY 125
TABLE 5.17:SUMMARY OF THE RESPONDENTS TO THE OUTAGE WORK ORDER
USAGE SECTION OF THE SURVEY 127
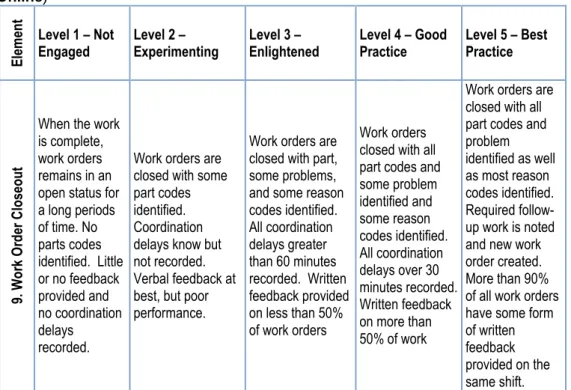
TABLE 5.18:SUMMARY OF THE RESPONDENTS TO THE WORK ORDER CLOSEOUT
SECTION OF THE SURVEY 128
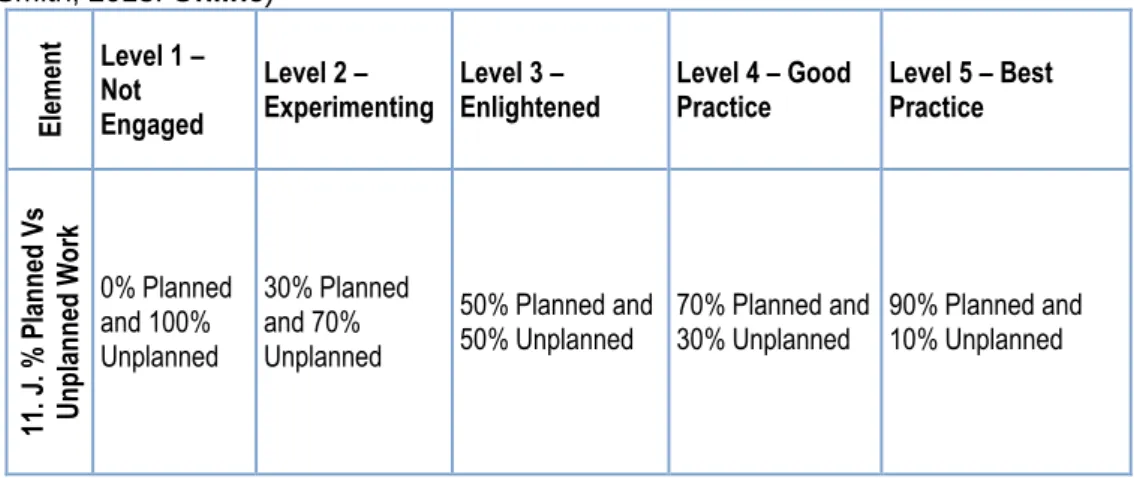
TABLE 5.19:SUMMARY OF THE RESPONDENTS TO THE PERCENTAGE PLANNED
VERSUS UNPLANNED WORK SECTION OF THE SURVEY 130
TABLE 5.20:SUMMARY OF THE RESPONDENTS TO THE OUTAGE SCHEDULE
ADHERENCE SECTION OF THE SURVEY 130
TABLE 5.21:SUMMARY OF THE RESPONDENTS TO THE WORK ORDER
COORDINATION DELAYS SECTION OF THE SURVEY 132
TABLE 5.22:SUMMARY OF THE RESPONDENTS TO THE LESSONS LEARNT
SECTION OF THE SURVEY 133
TABLE 5.23:SUMMARY OF THE RESPONDENTS TO THE RISK ASSESSMENT
SECTION OF THE SURVEY 135
LIST OF FIGURES
FIGURE 2.1:IMPACT OF KEEPING THE LIGHT ON APPROACH ADOPTED BY ESKOM
12
FIGURE 2.2:OUTAGE MANAGEMENT DEPARTMENT 13
FIGURE 2.3:HISTOGRAM OF CAUSES CATEGORISED INTO OPERATIONAL AND
ORGANISATION EFFECTIVENESS 17
FIGURE 2.4:PARETO ANALYSIS OF THE CONTRIBUTING CAUSES FOR OUTAGE
SLIPS 17
FIGURE 2.5:BREAKDOWN OF THE FAILED CONTROLS 18
FIGURE 2.6:ICEBERG EFFECT ON OUTAGE MANAGEMENT 19
FIGURE 2.7:OUTAGE READINESS INDEX SCORES 21
FIGURE 3.1:LITERATURE REVIEW MODEL 24
FIGURE 3.2:NOLAN’S STAGES OF GROWTH MODEL 26
FIGURE 3.3:HISTORY OF MATURITY MODELS 27
FIGURE 3.4:BASIC PROCESS MATURITY MODEL 33
FIGURE 3.5:MATURITY MODELS –CONTINUOUS REPRESENTATION VS STAGED
REPRESENTATION 35
FIGURE 3.6:MATURITY MODELS –STAGED REPRESENTATION 36
FIGURE 3.7:BASIC OUTAGE PROCESS 39
FIGURE 3.8:ESKOM OUTAGE PROCESS 40
FIGURE 3.9:OUTAGE MANAGEMENT MATURITY FRAMEWORK 65
FIGURE 4.1:QUANTITATIVE RESEARCH APPROACH AND DATA COLLECTION 75
FIGURE 4.2:QUALITATIVE RESEARCH APPROACH AND DATA COLLECTION 76
FIGURE 4.3:THE BUSINESS RESEARCH PROCESS 80
FIGURE 4.4:THE BUSINESS RESEARCH PROCESS 80
FIGURE 5.1:WORK EXPERIENCE PRIOR TO JOINING THE OUTAGE DEPARTMENT
113 FIGURE 5.2:SUMMARY INDICATING THE DEPARTMENT THE RESPONDENTS
WORKED IN PRIOR TO JOINING THE OUTAGE MANAGEMENT DEPARTMENT 114
FIGURE 5.3:OUTAGE ORGANISATION 117
FIGURE 5.4:OUTAGE PROCESS 118
FIGURE 5.5:OUTAGE PLANNING 119
FIGURE 5.6:OUTAGE SCOPE DEVELOPMENT 121
FIGURE 5.7:SINGLE OUTAGE PLAN 122
FIGURE 5.8:SCOPE MANAGEMENT 124
FIGURE 5.9:OUTAGE PROGRESS 126
FIGURE 5.10:OUTAGE ORDER USAGE 127
FIGURE 5.11:OUTAGE ORDER USAGE 129
FIGURE 5.12:OUTAGE SCHEDULE ADHERENCE 131
FIGURE 5.13:WORK ORDER COORDINATION DELAYS 132
FIGURE 5.14:LESSONS LEARNT 134
FIGURE 5.15:RISK MITIGATION 136
GLOSSARY TERMS
Outage: A predetermined repair, overhaul or
maintenance endeavor undertaken during a power station life cycle to ensure optimal production (Eskom Internal Document 32-1312, 2015: 5)
Outage Management: A complicated task involving the
co-ordination of available resource,
regulatory, technical and safety requirements, together with all activities and work prior and during the outage (IAEA, 2002: Online).
Outage Slip: Outage taking longer than scheduled
(Eskom Internal Document 32-1312, 015).
Outage Readiness Index: Outage Readiness Index (ORI) is a
standard approach to evaluate the readiness of an outage at predetermined stages prior before it start (Eskom Internal Standard 240-47532542: 2013:4).
CHAPTER 1: SCOPE OF THE DISSERTATION
1.1. INTRODUCTION
In 2012 Eskom’s Outage Management Department implemented a quality management system certified to ISO 9001: 2008. According to SANS 9004 standard continued success is achieved by implementing a quality management system (SANS 9004: Online). Quality improvement is a planned approach explained by the Plan-Do-Check-Act (PDCA)model (SANS 9004: Online).
The aim of the research study is to establish the maturity level of the outage process at Eskom’s Outage Management process. This would enable the Outage Management Department to establish a baseline maturity level for the outage process. The baseline maturity level should include all power stations and enable benchmarking across the fleet.
1.2. MOTIVATION
In 2012, Eskom adopted a process approach to outage planning and execution. Boutros and Purdie (2014: Online), point out that it is vital to monitor and measure organisational process maturity. Organisations are able to find improvement opportunities and identify crucial tasks that may put the organisation at risk if the processes are not at the suitable maturity level (Boutros & Purdie, 2014: Online).
Improving the planning and execution of outages contributes to improved electricity supply to South Africa. The use of a process management maturity instrument enables the Outage Management Department to identify opportunities for process improvement and possible risk during planning and execution of outages.
1.3 BACKGROUND TO THE RESEARCH PROBLEM
The research environment is Eskom’s Outage Management Department. At the time of this research study Eskom was working to reduce load shedding of electricity in South Africa. Eskom established an Outage Management Department in 2012 to focus on the planning and execution of outages of its generation fleet. During the year of April 2014 to May 2015 Eskom’s outage readiness showed an average readiness of 33 percent (see figure 2.7).
1.4 STATEMENT OF THE RESEARCH PROBLEM
The research problem statement in the ambit of the research study reads as follow: The absence of an outage process maturity indicator diminishes the ability of the Outage Management Department (OMD) to comprehend the current process maturity level.
1.5 RESEARCH QUESTION
The primary research question for this research study reads as follows: Will the Outage Management Department be able to identify improvement opportunities if the maturity level of the outage process is established?
1.6 RESEARCH INVESTIGATIVE QUESTIONS
The research investigative questions are listed below:
How would process maturity enable improvement?
What are the critical elements in an outage process?
What is included in outage planning, control and improvement?
What measurement instrument is able to determine the outage process maturity level?
By answering the research questions and investigative questions the researcher seeked to determine if a process maturity model can be used as an instrument to enable quality improvement.
1.7 PRIMARY RESEARCH OBJECTIVE
The primary research objective in the ambit of the research study reads as follows:
Primary Research Objective: The primary research objective is to establish the maturity level of Eskom’s outage process using a process maturity model.
Secondary Research Objectives: The secondary research
objectives read as follows:
To consider how process maturity enables improvement.
To identify critical elements in an outage process.
To determine what is included in outage planning, control and improvement.
To identify a measurement instrument to determine the maturity level of Eskom’s outage process
To establish the current maturity level of the outage process at Eskom.
1.8 THE RESEARCH PROCESS
The research study adopted the approach by Greener and Martelli (2015: Online). The research commenced with a review of the Outage Management Department’s performance. The Outage Management Department’s performance was analysed and the research problem statement identified.
The research design followed the descriptive research design. Research questions and objectives were developed. The survey questionnaire was developed and sent out to the staff in the Outage Management Department. The duration of the data collection started in
The research study used descriptive statistics to analyse the research data. Descriptive statistics was used to describe the current maturity level of the outage process. The data interpretation determined the maturity level of the outage process. The research study makes recommendations to assist with the improvement of the outage process.
1.9 RESEARCH DESIGN AND METHODOLOGY
Mouton (2001: 55) points out that the research design as a blueprint or plan explains the process to follow when conducting research. The research study adopted a quantitative research approach. The research design chosen for the research study is a descriptive research design. The research study employed the survey research method and used Greener and Martelli’s (2015: Online) Business Research Process.
1.10 DATA COLLECTION DESIGN AND METHODOLOGY
The data collection method used was a survey. Survey questions developed for the research study is based on the Maintenance Planning and Scheduling Maturity Matrix (Smith, 2013: Online). Kwiksurveys online survey was used to create the survey questionnaire.
An electronic survey was disseminated via email using the Kwiksurveys online tool to all the employees in the Outage Management Department. Employees had the option to respond or refrain from responding to the survey. Employees had one month to respond to the survey. Kwiksurveys online tool provided basic descriptive statistics.
1.11 ETHICS STATEMENT
According to Greener and Martelli (2015: Online), ethics is concerned with moral choices influencing decisions, behavior and standards. Mouton (2001: 238) found that ethics in science is concerned with the wrong and right when conducting research. Mouton (2001: 238) further mentions that scientists hold the right to search the truth, while not to
the detriment of others. Research involves the study of some being (Mouton, 2001: 243). Mouton (2001: 243) asserts that research subjects have basic rights and these include:
The right to confidentiality and the right to decline to take part in research.
The right to anonymity and confidentiality.
The right to full disclosure about the research (informed consent).
The right not to be harmed in any manner (physical, psychological or emotional).
Trochim (2006: Online), points out that the rule of voluntary involvement in research is essential when people take part in the research. Greener and Martelli (2015: Online), refer to some ethical criteria used in higher education:
Avoid deception and be honest.
Follow an ethical code of a professional body as appropriate.
Fully disclose information about the study and the author’s role and status.
Do not cause harm by an act or omission of the research study.
Obtain informed permission to take part in the research.
Respecting the right to refuse to take part.
Respect the need for anonymity and confidentiality.
Clarify to the participants and gatekeepers potential limitations in confidentiality and anonymity.
The criteria mentioned by Greener and Martelli (2015: Online) along with the basic rights as mentioned by Mouton (2001: 243) are recommendations to be considered for inclusion in the ethics statement for the research.
When the data is presented the names of power station will be renamed as Power Station -1 and the support departments will be renamed as Support Departments.
1.12 RESEARCH CONSTRAINTS
The following research limitations and delimitations are relevant to this study. Research constraints listed below:
Limitations related to the research are:
The Outage Management Department makes up the population selected for the research study.
Not all power stations will respond to the survey.
The level of skill and experience of participants in planning and execution of outages may vary, affecting the outcome of the maturity level.
De-limitations related to the research are:
The research outcome may have a generalised application in the planning and execution of outages and online maintenance processes.
1.13 SIGNIFICANCE OF THE RESEARCH
The research study assumptions and limitations identified provide a method to determine the maturity level of the outage process. The research establishes a baseline maturity level of the outage process. Great understanding of the process maturity level could enable the Outage Management Department to identify improvement opportunities and enable benchmarking across the fleet.
Possible future research opportunities include the development of a maturity model for the online maintenance or work management process within the Eskom power station fleet and facilitate a structured improvement approach for the outage processes.
1.14 CHAPTER AND CONTENT OUTLINE
The literature review investigates the research question in the next chapter:
Chapter 1: This chapter introduces the research subject and provides the motivation for the research.
Chapter 2: A background of the research environment is
presented in this chapter. The background leads the reader to understanding the research environment and identifies the research problem statement.
Chapter 3: The chapter’s primary focus is to understand process
maturity models and the outage process. The author explores the applicable literature concentrated on the primary theme of the research study. The literature identifies an instrument to measure the outage process maturity level. The literature provides the context to answer the research questions.
Chapter 4: The research process presents a structured research approach. The chapter looks at the research approach, the research design, methodology, assumptions and constraints.
Chapter 5: Data collection, analysis and interpretation of results forming the central part of this chapter and will facilitate the arrival to a conclusion.
Chapter 6: The author revisits the research questions and key objectives, ensuring the research has effectively addressed its objectives. Conclusions are drawn from the result and recommendations to mitigate the research problem that could proof beneficial to the organisation.
1.15 CONCLUSION
The research study creates an opportunity for the Outage Management Department to establish a baseline maturity level, identify best practice within the fleet to recognise improvement opportunities. The chapter:
Reviews the motivation and background to the research environment.
Determines the research problem statement and research questions.
Establishes the research objectives.
Reviews the research process, design and methodology.
Reviews the data collection design and methodology.
Discusses the research ethics statement.
Reviews the research constraints.
Discusses the significance of the research.
Provides a chapter and content outline.
CHAPTER 2: BACKGROUND
TO
THE
RESEARCH
ENVIRONMENT:
A
GENERAL
PERSPECTIVE
OF
ESKOM’S OUTAGE MANAGEMENT DEPARTMENT
2.1 INTRODUCTION
The research environment is Eskom Holdings State Owned Company (SOC) Ltd, South Africa’s primary supplier of electricity owned by the South African Government (Eskom Internal Document 240-56927206, 2015: 2). Eskom distributes, transmits and generates electricity to the mines, residential, industrial, commercial and agricultural customers (Eskom Internal Document 240-56927206, 2015: 2). Eskom owns and operates 27 power stations in South Africa (Eskom Internal Document 240-56927206, 2015: 2). Eskom contributes to around 95% of the electricity consumed in South Africa (Eskom Intranet, s.a., Online). The research focuses on Eskom’s Outage Management Department and the outage process. The author is part of the Outage Management Department that focus on planning and scheduling of outages for Peaking power stations. This chapter presents:
The challenges Eskom faced during April 2014 to May 2015.
An overview of Eskom’s Outage Management Department.
An outage in context of power stations.
The Eskom outage process.
The research problem statement.
The background to the research study starts by presenting the challenges Eskom faced during April 2014 and May 2015.
2.2 THE CHALLENGES FACING ESKOM’S OUTAGE
MANAGEMENT DEPARTMENT
This section presents the challenges Eskom faced from April 2014 to May 2015. In the internal report (Eskom Internal Document
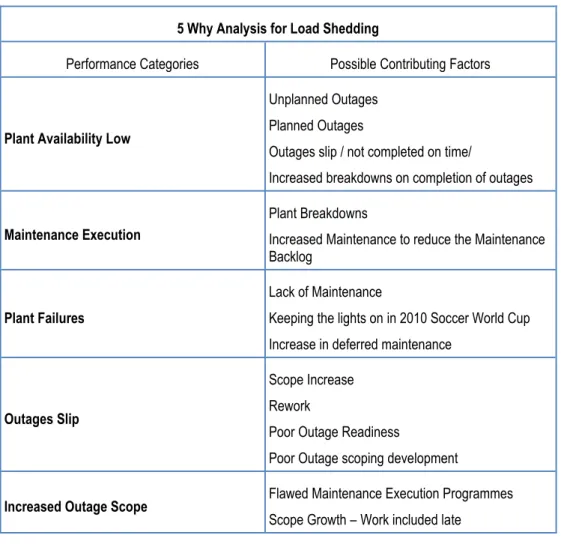
240-challenges, most notably load shedding. In an attempt to comprehend possible reasons for load shedding, a Five Why analysis was completed to assist in determining the possible contributing factors to load shedding. Table 2.1 captures the results of the Five Why analysis. Table 2.1: 5 Why Analysis for possible contributing factors to Load Shedding (Source: Own Source adapted from Eskom Integrated Report, 2015: Online)
5 Why Analysis for Load Shedding
Performance Categories Possible Contributing Factors
Plant Availability Low
Unplanned Outages Planned Outages
Outages slip / not completed on time/
Increased breakdowns on completion of outages
Maintenance Execution
Plant Breakdowns
Increased Maintenance to reduce the Maintenance Backlog
Plant Failures
Lack of Maintenance
Keeping the lights on in 2010 Soccer World Cup Increase in deferred maintenance
Outages Slip
Scope Increase Rework
Poor Outage Readiness
Poor Outage scoping development
Increased Outage Scope Flawed Maintenance Execution Programmes
Scope Growth – Work included late
The Five Why analysis found possible contributing factors and observed the following important contributing factors:
A lack of maintenance: Increase in equipment breakdowns
contributing to poor performance and a decrease in the plant availability to produce electricity.
Poor outage readiness and poor outage scope development:
Outage is executed even when the plants prepared. The scope is not accurate resulting in scope increase based on the as found inspections at the start of the outage.
Flawed maintenance execution programs: The maintenance programmes are incomplete or out dated therefore accurate outage execution scopes cannot be developed.
A decline in the plant performance of its power stations
resulting in an increase in unplanned breakdowns: The power
stations are operated beyond its recommended maintenance times to keep the lights on placing more strain of already stressed power stations. This increased the unplanned breakdowns as equipment failure surge under these conditions.
Limited opportunities to execute planned maintenance,
leading to increased unplanned maintenance: With limited maintenance opportunities contributes to increased equipment failure.
The deferment of maintenance and urgent repairs results in an increase in cost and the risk for load shedding: Delaying maintenance increase the equipment failure and unplanned maintenance cost.
The main causes of these challenges are the result of a practice adopted by Eskom in 2010, committed to keeping the lights on in support of the Soccer World Cup (eNCA, 2015: Online). The Eskom Integrated Report (2015: Online) mentions deferment of maintenance, resulting in delays of critical maintenance and refurbishment of generating equipment and contributing to an escalation in breakdowns of generation plants (Eskom Integrated Report, 2015: Online). The risk captured in the Eskom Integrated Report (2015: Online) refer to the decrease in generating capacity caused by maintenance backlog and a decline in the generating plant’s technical performance.
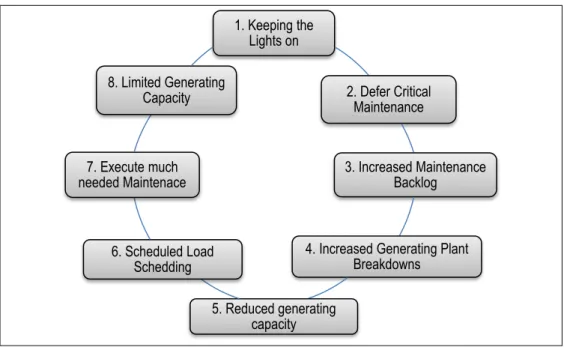
Figure 2.1 provides an overview of the impact of the approach adopted by Eskom that spirals into a cycle starting with keeping the lights on
followed by deferring critical maintenance, resulting in an increase in maintenance backlog. The lack of maintenance increases the plant
supplier that results in load shedding to prevent a grid collapse. Eskom implemented controlled load shedding and scheduled power cuts by rotating load shedding between all consumers when demand is high to avoid total blackouts in the supply area (Eskom Internal Document 240-56927206, 2015:258).
In an attempt to address the cycle in Figure 2.1, Eskom has placed great focus on improving plant performance and executing critical outages to improve electricity supply and reduce load shedding (Eskom Integrated Report, 2015: Online).
Figure 2.1: Impact of keeping the light on approach adopted by Eskom (Source: Own Source adopted from the Eskom Integrated report, 2015: Online)
Eskom maintained focus on its Corporate Plan to achieve its mission: to provide sustainable electricity solutions to grow the economy and improve the quality of life of the people in South Africa and the region
(Eskom Internal Document 240-56927206, 2015: 22). In addition to its Corporate Plan, Eskom implemented a structured approach to enable further improvement by adopting a quality management system certified to ISO 9001: 2008 on 31 March 2013 (Eskom Integrated Report, 2015:
Online). In 2012, Eskom established an Outage Management
Department. 1. Keeping the Lights on 2. Defer Critical Maintenance 3. Increased Maintenance Backlog
4. Increased Generating Plant Breakdowns 5. Reduced generating capacity 6. Scheduled Load Schedding 7. Execute much needed Maintenace 8. Limited Generating Capacity
The implementation of an ISO 9001: 2008 management system, along with the establishment of a department focused on outage planning and execution is a clear indication of Eskom’s commitment to improve and realise its business objectives. An overview of the Outage Management Department is discussed in the following section.
2.3 AN OVERVIEW OF ESKOM’S OUTAGE MANAGEMENT DEPARTMENT
This section provides an overview of the Outage Management Department. The Outage Management Department is accountable for the outage planning and execution.
This section provides a briefly overview of the Outage Management Department, and describes its primary mandate.
The Outage Management Department forms part of the Technology Division and consists of four primary operating units (OU) seen in Figure 2.2 (Eskom Intranet, s.a.: Online).
Figure 2.2: Outage Management Department (Source: Own Source adopted from Eskom Intranet s.a.: Online)
Each OU is responsible for the planning and execution of outages for a number of power stations in the OU. Coal 2 has seven power stations, which includes some of the mid aged power station. Coal 3 has six power stations and includes the oldest in the fleet as well as return to service power stations. Peaking OU have nine power stations consisting gas and hydro power stations.
Outage Management Department
Outage Centre of
Excellence and Support - Coal 2 Outage Execution and Support - Coal 3 Outage Execution
Outage Execution and Support -
The Nuclear OU is not included in the Outage Management Department but has its own Outage Management Department managed with in the Nuclear OU.
The mandate for the Outage Management Department including the Nuclear OU is to provide an end-to-end outage management service standardising outages across the fleet of power stations with the focus on high quality and timely completion of outages (Eskom Intranet, s.a.,
Online). The mandate includes the outage planning, execution and close phases discussed in the following section.
The following section turns to an outage in a power station context to establish the basic outage process.
2.4 OUTAGES DEFINED IN POWER STATIONS CONTEXT
The technology categories under consideration include fossil fuel, hydro, gas, nuclear and renewable energy and focus on the following:
Define an outage within power station context.
Identify the challenges experienced by the Outage Management Department.
The following section defines an outage to create a uniform understanding of an outage.
2.4.1 Definition of term outage
This section presents definitions for an outage by considering recognised international bodies involved in power generation. It includes Eskom’s definition on an outage.
The United States Nuclear Regulatory Commission (USNRC) (2015:
Online) defines outages as a time when a generating unit, transmission line, or other facility is out of service. The Eskom definition of outages is a predetermined repair/overhaul/maintenance endeavour undertaken during a power station life cycle to ensure optimal production (Eskom Internal Document 32-1312, 2015: 5).
The following section presents the basic outage process and identifies the phases that make up the outage process.
2.4.2 Challenges in the Outage Management Department
The challenges facing the Outage Management Department have an adverse consequence on the consistent electricity supply to the South African economy. This section presents:
The contributing causes to Outage slips.
The Outage Readiness Performance.
The following section reveals the contributing cause to outage slips, quantify, and categorise the identified causes.
2.4.2.1 Contributing causes to outage slips
This section present the contributing causes to outage slips in an attempt to contextualise the challenges facing the Outage Management Department.
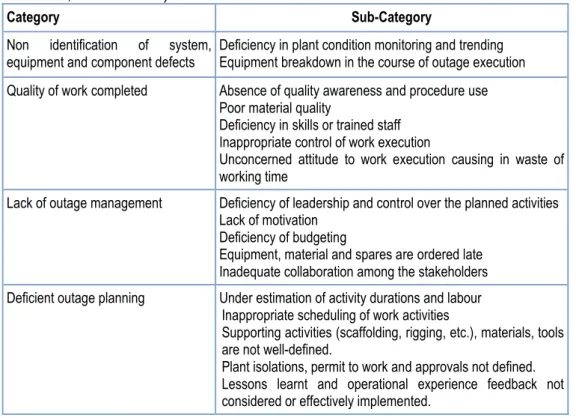
The International Atomic Energy Agency (IAEA) (2002: Online), mention some causes for outage extensions or slips included in Table 2.2.
Table 2.2: Causes for Outage Extension / Slips as found by IAEA (Source: Adopted from IAEA, 2002: Online)
Category Sub-Category
Non identification of system,
equipment and component defects Deficiency in plant condition monitoring and trending Equipment breakdown in the course of outage execution Quality of work completed Absence of quality awareness and procedure use
Poor material quality
Deficiency in skills or trained staff Inappropriate control of work execution
Unconcerned attitude to work execution causing in waste of working time
Lack of outage management Deficiency of leadership and control over the planned activities Lack of motivation
Deficiency of budgeting
Equipment, material and spares are ordered late Inadequate collaboration among the stakeholders Deficient outage planning Under estimation of activity durations and labour
Inappropriate scheduling of work activities
Supporting activities (scaffolding, rigging, etc.), materials, tools are not well-defined.
Plant isolations, permit to work and approvals not defined. Lessons learnt and operational experience feedback not considered or effectively implemented.
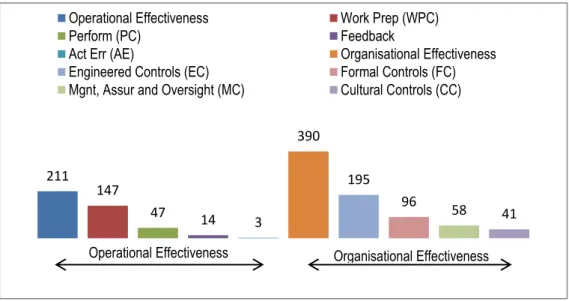
The primary and secondary causes to outage slips are presented using Histograms and Pareto diagrams. Eskom’s Outage Management Department investigated the reasons for the outage slips using pre-determine barriers. The pre-pre-determined barriers are Organisational Effectiveness and Operational Effectiveness barriers (Eskom Internal Report, 2015: 20150815). The Eskom Organisational Effectiveness is primary barriers are:
Engineering Control.
Formal Controls.
Management, Assurance and Oversight Controls.
Cultural Controls.
Figure 2.3 identified the major contributor to the outage slips as 390 failures in the Organisational Effectiveness controls (Eskom Internal Report, 2015: 20150815).
The Operational Effectiveness contributes to 211 failures. The Pareto analysis determined the causes within the seven sub-categories identified in Figure 2.3.
Figure 2.3: Histogram of Causes categorised into Operational and Organisation Effectiveness (Source: Own source adopted from Eskom Internal Report
20150805)
The Pareto analysis in Figure 2.3 combines the organisational and operational causes to find the primary contributing causes and identifies the major contributing cause was the 390 failures in the organisation effectiveness barrier (Eskom Internal Report, 2015: 20150815).
Figure 2.4 identifies Engineering controls as the main contributing cause followed by Work Preparation and Formal Controls.
Figure 2.4: Pareto Analysis of the Contributing Causes for Outage Slips (Source:
211 147 47 14 3 390 195 96 58 41
Operational Effectiveness Work Prep (WPC)
Perform (PC) Feedback
Act Err (AE) Organisational Effectiveness Engineered Controls (EC) Formal Controls (FC) Mgnt, Assur and Oversight (MC) Cultural Controls (CC)
Operational Effectiveness Organisational Effectiveness
195 147 96 58 47 41 14 3 0% 10% 20% 30% 40% 50% 60% 70% 80% 90% 100% 0 20 40 60 80 100 120 140 160 180 200 Engineered Controls (EC) Work Prep (WPC) ControlsFormal (FC) Mgnt, Assur and Oversight (MC) Perform (PC) ControlsCultural (CC)
Feedback Act Err (AE) Pareto Analysis of the Contributing Causes for Outage Slips
The Pareto analysis shows the 20 percent of the contributing causes that contribute to 80 percent of the outage slips are Engineered Controls, Work Preparation, Formal Control and Management Assurance and Oversight. Figure 2.4 indicates that the primary cause of outage slips are the failure of Organisational controls.
The analysis in Figure 2.5 further identifies the sub-categories enabling a better understanding of the failures within the Engineered Controls, Work Preparation Controls, Formal Control and Management Assurance and Oversight Controls (Eskom Internal Report, 2015: 20150815).
Figure 2.5 identifies failures in 11 sub-categories (Eskom Internal Report, 2015: 20150815). Work Planning and Scheduling and Work Co-Ordination account for 143 failures. Equipment Failures, Equipment Conditions and Maintenance Programs account for 150 failures.
Figure 2.5: Breakdown of the Failed Controls (Source: Own source adopted from Eskom Internal Report 20150805)
98 87 58 45 45 28 27 26 21 19 18 14 14 14 12 0 20 40 60 80 100 120
Work Planning + Scheduling (WP1) Maintenance Program (E5) HR Management Related (F5) Equipment Performance (E1) Work Co-ordination (WP2)
Op Tech Specs, W-Packs + Instrs (F3) Supervisory Oversight (P3)
Individual Accountability (C6) Management Planning (M1) Assurance Management (M6) Equipment Condition (E2) Inspection and Testing (E4) Job Observations (P1) Performance Feedback (PF3) Equip Specs, Mnftg + Const (E3) Breakdown of the Four Failed Controls
Human Resources Management Related, Operational Technical Specifications and work packages and instructions account for 86 failures. The areas of Supervisory oversight, Management Planning and Assurance account for 67 failures.
Gryna (2001: 27) uses an Iceberg model to show the effects of the cost of poor quality. In Figure 2.6, the author uses the Iceberg model to show a number of factors that have an effect on the effectiveness of the outage process, including outage readiness.
Figure 2.6: Iceberg Effect on Outage Management (Source: Own Source adopted from Gryna, 2001: 27)
The Outage Management Department uses the Outage Readiness Indicator (ORI) as a measure to determine outage readiness. It is a control and documented process and is discussed in the following
High Outage slip frequency
Poor outage readiness
Lack of maintenance
Declined plant performance
Increased unplannedbreakdowns Increased unplanned maintenance
Poor work planning &scheduling
Flawed maintenance programs Low equipment reliability
Low Outage readiness
Failed Engineering Controls Lack of Management, Assurance &
Oversight Failure in Formal Controls
Not implementing lessons learnt
Poorly resourced outage organisations Poor understanding & Adherence to Outage planning process
Poor Schedule adherence during execution Load Shedding
Inadequate risk analysis
Poor detail in work packages and work instructions Poor scope development Unseen Causes
2.4.2.2 Review Eskom’s outage readiness
The section reviews the Outage Readiness Index results from April 2014 to April 2015 to determine the status of outage planning. Outage Readiness Index (ORI) is a standard approach used by Eskom to evaluate the readiness of an outage at predetermined stages prior to its start (Eskom Internal Standard 240-47532542: 2013:4):
The detail captured in the ORI: The outage planning process starts 24 months prior to the start of an outage and readiness outage readiness reviews are complete at pre-determine intervals (Eskom Internal Standard 240-47532542: 2013:4). The ORI standard further establishes a 90 percent ORI readiness score prior outage execution (Eskom Internal Standard 240-47532542: 2013:4).
Evaluation of the ORI readiness: A review of the ORI scores from April 2014 to April 2015 in Figure 2.7, show an average ORI readiness 33 percent compared to an internal target of 80 percent. The target used by the Outage Management Department is ten percent less than the required 90 percent specified in the ORI standard (Eskom Internal Standard 240-47532542: 2013:5). The Outage Management Department does not include a minimum ORI score in any procedure, which can be used as a guide to delay the start of an outage. The 33 percent Outage readiness is an indication of outage poor planning and readiness and is therefore best captured by Baumler (2010: Online), considers Winston Churchill’s comment; the one that fails to plan, plans to fail. The use of a lower readiness target could assist in determining the minimum readiness for an outage to continue. With a known upper and lower-limit, creates an opportunity to apply statistical process control (SPC).
Consider the use of Statistical Process Control: The use of SPC could prove valuable in the monitoring of outage readiness. Early identification of process variance can lead to an investigation and resolution of causes early in the process.
Gryna (2001:495) describes SPC as the application of statistical methods to the measure and analysis process variation. The control chart in Figure 2.7 includes an upper control limit of 80 percent and no lower control limit. The ORI score process control chart show an average readiness of 33 percent at the time of the research.
Figure 2.7: Outage Readiness Index Scores (Source: Own Source adopted from Eskom Internal Report, 20150805: GEXCO)
The low ORI scores point to problems in the outage planning resulting in process variation. With the gap between the actual score and target score the variations and problems will persist. The ORI scores in Figure 2.7 are an indication that the ORI planning process is out of control. The failure to understand the underlying causes have a negative impact on the ORI score and results in continued poor outage readiness. The use of SPC may well prove to be a valuable tool to identify process variance and assist with maintaining internal process controls. 0% 10% 20% 30% 40% 50% 60% 70% 80% 90% 100% 01 Ap ril 2 01 4 01 M ay 2 01 4 01 J un e 20 14 01 J ul y 2 01 4 01 Au gu st 2 01 4 01 Se pt em ber 2 01 4 01 O cto ber 2 01 4 01 N ovem ber 2 014 01 D ecem be r 2 01 4 01 J an ua ry 2 01 5 01 F eb rua ry 2 01 5 01 M ar ch 201 5 01 Ap ril 2 01 5 01 M ay 2 01 5
ORI Standard Target Internal Outage Target Actual Score Ave ORI Score Outage Readniess Indicator April 2014 to April 2015
OR
I S
cor
Mauch (2010, Online) found that the last phase in process quality planning is to establish the internal controls that would stabilise the process. Defeo and Juran (2014: Online) explain that a strategic plan is the logical method to define a long-term goal and planning ways to achieve them. Boutros and Purdie (2014: Online) found that simultaneous change are required in the process system, technical systems, management and behavioral system when pursuing process improvement.
Boutros and Purdie (2014: online) explain that the pursuit of process improvement is a continuous and long-term goal. Knowles (2012:
Online) states that if quality management focuses on anything, it is focused on change, and change for the better, while emphasising that learning is essential if a company wants to achieve a degree of excellence.
The research problem statement follows in the next section.
2.5 RESEARCH PROBLEM IDENTIFICATION
The aim of this section is to identify the research problem. The outage process uses Organisational Effectiveness and Operational Effectiveness codes to categorise failures when investigating outage slips. The Eskom Internal Report (Eskom Internal Report, 2015: 20150805) indicates a failure in the sub-categories, but omits to report which major category (Organisational Effectiveness or Operational Effectiveness) is the main contributor. The major contributor to outage slips is failures in the Organisational Effectiveness as shown in Figure 2.3.
A secondary consideration in the Eskom Report (Eskom Internal Report, 2015: 20150805) is the outage readiness indicator. The low ORI scores shown in Figure 2.7 provide evidence of outage processes are not in a state of control.
The lack of organisational effectiveness is the primary contributor to outage slips, followed by failures in certain operational controls.
The research problem statement reads as follow; the absence of an The absence of an outage process maturity indicator diminishes the ability of the Outage Management Department (OMD) to comprehend the current process maturity level.
2.6 CONCLUSION
The Outage Management Department captures and communicates data and figures in reports on the ORI scores and outage slips, but do not provide the methods to improve the current process performance. According to Deming (2000:15), figures indicate how processes are performing, but it does not demonstration how to improve processes. The Outage Management Department has many figures indicating how the process outage process performs, but these figures do not show how to improve the outage process.
This chapter provided the background to the research environment and included:
The challenges Eskom faced.
An Over view of Eskom’s Outage Management Department.
Outage Defined in the power station context.
Identification of the research problem.
In Chapter 3 the literature review focuses on the use of the Process Maturity Model as a Quality Improvement approach.
CHAPTER 3: LITERATURE REVIEW
– THE PROCESS
MATURITY MODEL AS A QUALITY IMPROVEMENT
APPROACH
3.1 INTRODUCTION
The aim of the literature review was to find an academic point of view to answer the research questions. According to Leedy and Ormrod (2014:51), the literature reviews the theoretical perspective and considers former research relating to the research problems. The literature review attempts to provide a comprehensive explanation of a process maturity model, the outage process that includes its planning, execution and improvement.
The approach to the literature review is a structured approach and follows the literature review model seen in Figure 3.1 developed by author and the research supervisor. The Literature Review Model has three phases. The review focuses on the theory of process maturity.
Figure 3.1: Literature Review Model (Source: Own Source)
The detailed literature review will focus on:
Review Process Maturity.
Review the Outage Process.
Review Outage Planning Process.
Review Outage Control Process.
Review Outage Improvement Process.
Review the measurement instrument to determine outage maturity level. Identify the System & Measurement Instrument System Review the theory on the system and instrument Theory Apply the System, Instrument and Theory to a Scenario Application
3.2 PROCESS MATURITY
This section reviews the process maturity and focuses on:
The history of maturity models.
Crosby’s Quality Management Maturity Grid.
Process Maturity.
Continuous and Staged representation of process maturity.
3.2.1 History of maturity models
The aim is to look at the history of maturity models and to gain an understanding of how maturity models evolved focusing on:
Nolan’s Stages of Growth Model.
The evolution to the process maturity framework.
History summary of maturity models.
3.2.1.1 Nolan’s Stages of Growth Model
According to Prananto, McKay and Marshall (2003: Online), the Nolan’s stage hypothesis first appeared in the 1970’s. Hollyhead and Robson (2012: Online) found that Richard L. Nolan designed the Stages of Growth Model for IT systems in the 1970. Gibson and Nolan (1979: Online) explain the purpose of the Stages of Growth Model is to describes each stage, listing key characteristics for each stage and explains the underlying organisational forces at work in each.
Gibson and Nolan (1974: Online) introduce a Four Stage Growth Model and point out that three types of growth would be required as maturity increases:
A growth in computer application.
A growth in specialisation of staff.
A growth in formal management techniques and organisation. Thakur (s.a.: Online) return that Nolan’s model helps organisations understand the role of information systems and the models evolutionary
Figure 3.2: Nolan’s Stages of Growth Model: (Source: Thakur, s.a.: Online)
Hollyhead and Robson (2012: Online) explain that other models have been created founded on Nolan’s Stages of Growth model. Hollyhead and Robson (2012: Online) found that Nolan’s Stages of Growth model
is a useful tool to assist with identifying long-term strategic plans and find improvement opportunities.
A brief discussion of the evolution to the Process Maturity Framework follows in the next section.
3.2.1.2 Evolution to the process maturity model
The evolution from Nolan’s Growth Model includes a number of contributions from various individuals and organisations. Two contributors include Crosby (1979: 25) and Humphrey (1987: Online). In 1979, Crosby (1979: 25) proposed the Quality Management Maturity Grid (QMMG) with five maturity stages and six management groups. Humphrey’s (1987: Online) contribution was during his time at Software Engineering Institute (SEI) and this contribution resulted in the development of the Process Maturity Framework, which provided a way of characterising the capabilities of software developers.
Humphrey (1987: Online), supported by Van Dyk & Schutte (2012:
Online), explain that the process maturity framework can be used to assess the process capability of a given organisation and identify
Initiation Contagion Control Integration Data Administration Maturity
important areas for improvement. Alden and Curtis (2006: Online) describe the history of maturity models in Figure 3.3. They acknowledge the contribution made by Shewart’s Statistical Process Control approach, Deming PDCA model and Crosby’s Quality Management Grid as contributors to the development of Humphrey’s Process Maturity Framework.
Figure 3.3 shows that Humphrey’s Process Maturity Framework contributed to the Capability Maturity Model with its variations leading to the development of the Business Process Maturity Model.
Figure 3.3: History of Maturity Models (Source: Alden & Curtis, 2006: Online)
The history of the maturity models seen in Figure 3.3 was not the end of the evolution of the maturity models. The next section provides an overview of various maturity models.
3.2.2 Crosby’s Quality Management Maturity Grid
According to Crosby (1979:23), the Quality Management Maturity Grid (QMMG) enables any manager to determine the maturity level of any operation in terms of quality concepts. The review focuses on:
The background to the QMMG.
Using the QMMG as an Improvement Tool.
Description of the QMMG. Crosby's quality
Maturity Gird
Humphrey's Process
Maturity Framework Shewart's SPC and Deming's PDCA
System Eng - CMM System Eng - CMM System Eng - CMM
3.2.2.1 Background to the Quality Management Maturoty Grid
According to Maier, Moultrie and Clarkson (2012: Online), Crosby’s
Quality Management Maturity Grid is a pioneering example, promoting progress across five stages: uncertainty, awakening, enlightenment, wisdom and certainty. Wilson (2013: Online) developed a Quality Maturity Model closely founded on the Capability Maturity Model (CMM) used in software development. The five stages in the maturity model by Wilson (2013: Online) are similar to the Capability Maturity Model: Initial, repeatable, defined, managed and optimising.
3.2.2.2 Quality Management Maturoty Grid as an improvement
tool
According to Maier, Moultrie and Clarkson (2012: Online), a maturity grid can be used as an assessment or improvement tool. Crosby (1979:25) point out that the Quality Management Maturity Grid is used to pinpoint the “as is” state of a process and enable improvement by referring to the next stages to identify actions to be taken for improvement. The grid can help identify the last success point and reading backwards to determine where established programs deteriorated.
De Bruin, Freeze, Kaulkarni and Rosemann (2005: Online) mention that maturity models are used to assess the maturity level of selected processes based on a comprehensive set of criteria.
De Paula, Fogliatto and Cristofari (2012: Online) maintain that the maturity grid method provides a qualitative description of each process area. Pöppelbuß and Roglinger (2011: Online) found that maturity models are expected to make known the current and desired maturity levels and to include relevant improvement measures.
3.2.2.3 Explanation of the Quality Management Maturoty Grid
De Paula, Fogliatto and Cristofari (2012: Online) explain that the grid cell has text descriptions of typical performance expected at various maturity levels. The detail of the Quality Management Maturity Grid developed by Crosby (1979: 32-33) is provided in Table 3.1.
Maier, Moultrie and Clarkson (2012: Online) explain the process for determining maturity uses a matrix or grid design seen in the QMMG shown in Table 3.1. The maturity level is assigned against key performance characteristics thereby creating a series of cells.
Crosby’s QMMG shown in Table 3.1 clearly define six measurement categories and five stages ranging from uncertainty to certainty. Table 3.1 of Crosby’s QMMG has a clearly defined requirement for each measurement category and the corresponding stage.
Table 3.1: Quality Management Maturity Grid (QMMG) (Source: Crosby, 1979: 32-33)
Quality Management Maturity Grid Measurement
Categories Uncertainty Stage 1: Awakening Stage 2: Enlightenment Stage 3: Stage 4: Wisdom Certainty Stage 5:
Management understanding and attitude Do not comprehend quality as a management tool. Tend to blame quality department for quality problems Recognise the value of quality management, but will not provide time of money to make it happen While going through quality improvement, learn more about quality management and become supportive and helpful Participate. Understand the absolutes of quality management and recognise their role continuing emphasis Consider quality management as a vital part of the company system Quality Organisation Status Quality is hidden in manufacturing and engineering department. Inspection probably not part of organisation. Emphasis on assessment and sorting. A strong quality leader is appointed but the main emphasis is still on assessment and moving production. Still part of manufacturing and others. Quality Department reports to top management, all assessment is incorporated and manager has role in management of company. Quality manager is an officer of company; effective status reporting and preventive action. Involved with consumer affairs and special assignments. Quality manager on board of directors. Prevention is main concern. Quality is a thought leader. Problem Handling Problems are fought as they occur; no resolution, inadequate definition, lots of yelling and accusation
Teams are set up to attack major problems. Long range solutions are not solicited Corrective action communication established. Problems are faced openly and resolved in an orderly way Problems are identified early in their development. All functions are open to suggestions and improvement. Except in the most unusual cases, problems are prevented. Cost of Quality as % of sales Reported: Unknown. Actual: 20% Reported: 3% Actual: 18% Reported: 8%. Actual: 12% Reported: 6.5% Actual: 8% Reported: 2.5% Actual: 2.5% Quality Improvement Actions No Organised activities. No understanding of such activities. Truing obvious “motivational” short-range efforts. Implementation of the 14 step program with thorough understanding and establishment of each step Continuing the 14 step program and starting Make Certain Quality Improvement is normal and continued activity. Summation of company quality posture
“We don’t know why we have problems with quality.” “Is it absolutely necessary to always have problems with quality?” “Through management commitment and quality improvement we are identifying and resolving our problems.” “Defects prevention is a routine part of our operations.” “We know why we do not have problems with quality.”
3.2.2.4 The working of the Quality Management Maturity Grid
The use of the QMMG to determine the quality maturity level is explained by Crosby (1979: 31) finding that the correct use of the Grid’s assessment result could encourage quality improvement.
According to Crosby (1979: 31), the first step is to ask the managers to check the stage they think their operation is in for each of the six measurement categories, and score it in accordance with Table 3.2. The managers add up the score and obtain a result out of 25 providing a quantifiable measure that represents a certain maturity level.
Table 3.2: Quality Management Maturity Grid Points Guide. (Source: Own Source Adopted from Crosby, 1979: 31)
Quality Management Maturity Grid Point Grid Measurement Categories Stage 1: Uncertainty Stage 2: Awakening Stage 3: Enlightenment Stage 4: Wisdom Stage 5: Certainty Points
Allocation 1 Point 2 Points 3 Points 4 Points 5 Points
The following section describes process maturity and shows at how it is utilised.
3.2.3 Process maturity
The author seeks to understand a Process Maturity Model and consulted literature on the subject that includes:
The description of the process maturity models.
Identifying the basic levels observed in a process maturity model.
Three ways to utilise maturity models.
3.2.3.1 Description of the Process Maturity Model
This section describes the Process Maturity Model. Paulk, Curtis, Chrissis and Weber (s.a., Online) defines process maturity as: Process maturity is the degree to which a particular process is well defined, controlled, evaluated and successful.
According to Boutros and Purdie (2014: Online), a process maturity model is a set of well-defined structured stages that explain how well the practice, behavior and process of an organisation can consistently produce the predetermined outcome. Jochem, Geers and Heinze (2011: Online) consider the maturity model as a specific competency model that point out various degrees of maturity.
Dijkman, Lammers, and De Jong (2015, Online) explain that Business Process Management (BPM) is a contemporary management practice centered on managing the organisations ‘business processes’. Pešić, Milić and Anđelković (2012, Online), citing Oliveira, Ladeira and McCormack (2012), describe BPM as a complete management approach focused on identifying, defining, implementing, measuring monitoring, analysing and continual improvement of business processes. Maier, Moultrie and Clarkson (2012: Online) found that the focus on quality management and process improvement programs often encourage the organisations to assess their capability against improvement frameworks.
3.2.3.2 The basic levels of process maturity models
Paulk, Curtis, Chrissis and Weber (s.a., Online), Song, Zhu, Danilovic and Hoveskog (2011, Online) and Boutros and Purdie (2014: Online), support the view of Humphrey (1987: Online), that the process maturity model has five levels.
Figure 3.4 presents the basic process maturity levels. Pešić, Milić and Anđelković (2012, Online) find that the models developed by Rosemann and De Bruin (2004) include five factors influencing five phases that an enterprise has to go through to improve the maturity of the Business Process Management.
According to Rosemann and De Bruin (2005: Online), the BPM have five maturity levels which is similar to Capability Maturity Model (CMM) and are: Initial Stage, defined, repeatable, managed; and optimised.
Figure 3.4: Five Levels of Process Maturity (Source: Own Source adopted from Humphrey 1987: Online)
Figure 3.4 presents Humphrey’s (1987: Online) detailed description of the five levels of a process maturity model are:
Initial: The process is not under statistical control; therefore, no systematic process improvement is likely.
Repeatable: To achieve a process that is stable and repeatable, statistical controlled; introduce accurate project management of responsibilities, cost, schedule and changes.
Defined: The process definition is essential to assure consistent implementation and to provide a foundation for better comprehension of the process.
Managed: Subsequent to the defined phase, it is possible to start process measurement. At this phase significant quality improvement begins to emerge
Optimise: The measured process is the foundation for continuing
Level 1 - No organised processes Level 2 - Some organised processes Level 3 - Most processes organised Level 4 - Processes are organised and managed Level 5 - Processes are continuously improved