2018
Predicting pavement performance utilizing artificial
neural network (ANN) models
Fawaz Alharbi
Iowa State University
Follow this and additional works at:https://lib.dr.iastate.edu/etd Part of theTransportation Commons
This Dissertation is brought to you for free and open access by the Iowa State University Capstones, Theses and Dissertations at Iowa State University Digital Repository. It has been accepted for inclusion in Graduate Theses and Dissertations by an authorized administrator of Iowa State University Digital Repository. For more information, please [email protected].
Recommended Citation
Alharbi, Fawaz, "Predicting pavement performance utilizing artificial neural network (ANN) models" (2018).Graduate Theses and Dissertations. 16703.
Predicting pavement performance utilizing artificial neural network (ANN) models
by
Fawaz Alharbi
A dissertation submitted to the graduate faculty in partial fulfillment of the requirements for the degree of
DOCTOR OF PHILOSOPHY
Major: Civil Engineering (Transportation Engineering)
Program of Study Committee: Omar Smadi, Major Professor
Shauna Hallmark Peter Savolainen Jennifer Shane
Guping Hu
The student author, whose presentation of the scholarship herein was approved by the program of study committee, is solely responsible for the content of this dissertation. The
Graduate College will ensure this dissertation is globally accessible and will not permit alterations after a degree is conferred.
Iowa State University Ames, Iowa
2018
DEDICATION
To my parents To my wife
TABLE OF CONTENTS
LIST OF FIGURES ... v
LIST OF TABLES ... vii
ACKNOWLEDGEMENTS ... viii ABSTRACT ... ix CHAPTER 1: INTRODUCTION ...1 Problem Statement ... 2 Research Objectives ... 3 Dissertation Organization ... 4
CHAPTER 2: LITERATURE REVIEW ...5
Pavement Management Systems (PMS) ... 5
Pavement Management Levels ... 6
PMS Components ... 7
Assessment Categories in Evaluating Pavement Conditions ... 8
Pavement Roughness ... 8
Pavement Surface Distress ... 8
Structural Adequacy... 10
Surface Friction ... 11
Pavement Condition Ratings... 12
Pavement Performance Modeling ... 13
Deterministic Models ... 15
Probabilistic Models ... 17
Expert Models ... 18
Artificial Neural Network (ANN) Models ... 18
Summary of Pavement Performance Models ... 21
CHAPTER 3: METHODS ...22
Pavement Distress Data ... 23
Pavement Condition Indices ... 27
Cracking Index ... 27
Riding Index... 28
Rutting Index ... 29
Faulting Index ... 29
Overall Pavement Condition Index ... 29
Pavement Age ... 30
Traffic Loading ... 30
Climate Data ... 31
Data Integration ... 34
Developing Pavement Performance Models ... 43
Developing Artificial Neural Network (ANN) Models ... 47
ANN learning process ... 48
Neuron activation function ... 49
Relative contribution of input variables ... 51
Developing Multiple Linear Regression (MLR) Models... 52
An ANN Model for Correlating Structural Capacity and Rutting ... 53
CHAPTER 4: RESULTS AND DISCUSSION ...55
Comparison of ANN and MLR Models... 55
Validation of Prediction Models ... 58
ANN Predictions of Future Pavement Performance ... 60
Relative Contribution of Input Variables ... 63
Variables that Influence ACC Pavements... 64
Variables that Influence PCC Pavements ... 66
Variables that Influence Composite Pavements ... 68
ANN Models for Correlating Structural Capacity and Rutting ... 70
CHAPTER 5: CONCLUSIONS AND RECOMMENDATIONS ...73
REFERENCES ...76
APPENDIX A. WEIGHT MATRICES ...83
LIST OF FIGURES
Figure 1. Schematic of FWD (Smith et al., 2017) ...11
Figure 2. Illustration of pavement performance over time (Haas et al., 1994) ...13
Figure 3. Markov Matrix...17
Figure 4. Research flowchart ...23
Figure 5. Data collection Practice (Jeong, Smadi and Abdelaty, 2016) ...24
Figure 6. Screenshot from the PMIS database ...25
Figure 7. Distribution of pavement age of Iowa highway systems (2015) ...30
Figure 8. Traffic loading distribution of Iowa highways (2015) ...31
Figure 9. Changes in traffic loading on highways in Iowa ...31
Figure 10. NWS climate stations in Iowa ...32
Figure 11. Screenshot of the IEM weather database ...33
Figure 12. Average annual freeze-thaw cycles for 2014 ...34
Figure 13. Pavement sections associated with the closest weather station ...35
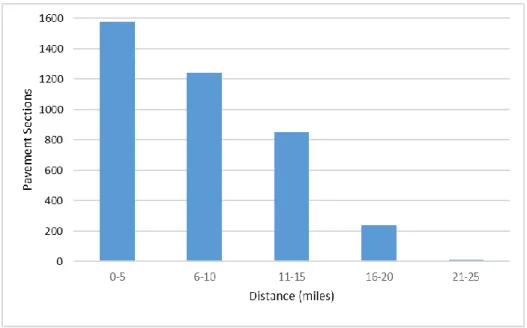
Figure 14. Distribution of the distances from pavement sections to the closest weather station ...36
Figure 15. Final dataset format after integration of PMIS and IEM data ...36
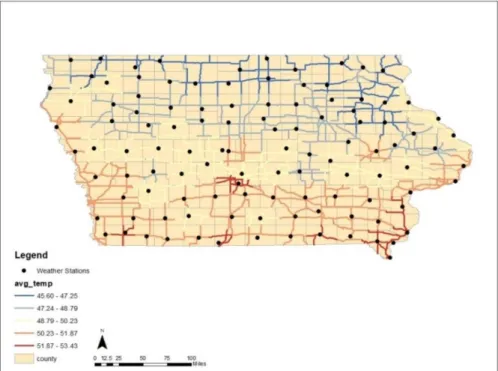
Figure 16. Iowa average temperatures (2015) ...37
Figure 17. Average rainfall amount (in.) on Iowa highways (2015) ...38
Figure 18. Average snowfall amount (in.) on Iowa highways (2015) ...39
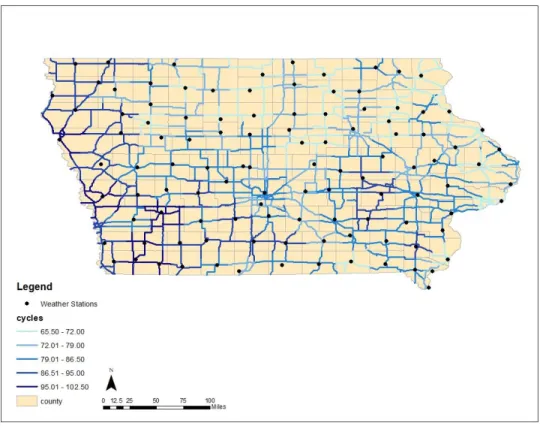
Figure 19. Number of freeze-thaw cycles of Iowa highways (2015) ...39
Figure 20. PCI rating distribution of Iowa highways (2015) ...40
Figure 21. PCI map of Iowa highways (2015) ...41
Figure 22. Pavement roughness distribution of Iowa highways (2015) ...42
Figure 23. IRI map of Iowa highways (2015)...42
Figure 24. Flowchart of predicting PCI for ACC pavements ...44
Figure 25. Neural network architecture (Yang, Lu, and Gunaratne, 2003) ...47
Figure 26. RMSE values to determine the number of neurons for training a COM pavement model ...48
Figure 27. Diagram of an artificial neuron (Liu, 2013) ...50
Figure 28. Residual plot for the cracking model in ACC pavements ...59
Figure 29. Residual plot for the riding model in ACC pavements ...59
Figure 30. Residual plot for the rutting model in ACC pavements ...59
Figure 31. Pavement performance curve for I-35 section (ACC pavement) ...61
Figure 32. Pavement performance curve for US-30 section (COM pavement) ...62
Figure 33. Performance curve for the Iowa-1 pavement section (PCC pavement) ...63
Figure 34. Relative contribution of inputs on Riding Index (ACC Pavement) ...65
Figure 35. Relative contribution of inputs on Cracking Index (ACC Pavement) ...65
Figure 36. Relative contribution of inputs on Rutting Index (ACC Pavement) ...66
Figure 37. Relative contribution of inputs on Riding Index (PCC Pavement) ...67
Figure 38. Relative contribution of inputs on Faulting Index (PCC Pavement) ...67
Figure 39. Relative contribution of inputs on Cracking Index (PCC Pavement) ...68
Figure 40. Relative contribution of inputs on Riding Index (COM Pavement)...69
Figure 41. Relative contribution of inputs on Cracking Index (COM Pavement) ...69
Figure 43. Scatter plots of actual SN vs actual rutting depth...71 Figure 44. Fitted line between actual and predicted SN for ACC pavements ...71
LIST OF TABLES
Table 1. Differences between PMS network and project levels (AASHTO, 2012) ...7
Table 2. Pavement types in Iowa highways ...26
Table 3. Center mile length of each pavement type (miles) ...26
Table 4. Descriptive statistics of pavement segments ...27
Table 5. Threshold for cracking indices ...28
Table 6. Input variables for modeling ACC pavements ...46
Table 7. Input variables for modeling COM pavements...46
Table 8. Input variables for modeling PCC pavements ...46
Table 9. Comparison of MLR and ANN for ACC pavements ...56
Table 10. Comparison of MLR and ANN for PCC pavements ...57
Table 11. Comparison of MLR and ANN for composite pavements ...57
Table 12. Goodness of fit of ANN models of validation dataset ...58
ACKNOWLEDGEMENTS
I would like to express my deepest gratitude to my committee chair and advisor, Dr. Omar Smadi, for his encouragement, guidance, and support. I am honored to have had the opportunity to be under his supervision. I must also thank all my committee members, Dr. Shauna Hallmark, Dr. Guiping Hu, Dr. Peter Savolainen, and Dr. Jennifer Shane for taking their valuable time to review my work.
Also, I would like to express my deep gratitude and thanks to my parents for their continued love and support. I am extremely grateful and thankful for all they provided me in the past and continue to provide me today. Additionally, I would like to send special thanks to my wife for her endless support, care, and love.
Finally, I would like to thank my country, Saudi Arabia, for giving me the opportunity to study abroad, and complete six years through my master and PhD programs in the United States. I would also like to thank Qassim University for supporting me financially to pursue my PhD program at Iowa State University.
ABSTRACT
Pavement management systems (PMS) play a significant role in cost-effective
management of highway networks to optimize pavement performance over predicted service life of the pavements. Successful PMS implementation requires accurate performance prediction modeling to plan future maintenance and rehabilitation strategies.
The Iowa DOT manages three primary highway systems (i.e., Interstate, US, and Iowa highways) that represent 8% (approximately 9,000 miles) of the total roadway system in the state (114,000 miles), but these systems carry around 62% of the total vehicle miles traveled (VMT) and 92% of the total large truck VMT (ASCE, 2015). These highways play a major role in Iowa’s economy because highways are important to several sectors (e.g., agriculture, manufacturing, and industry). According to the Bureau of Transportation Statistics, in 2012 around 263.36 billion tons of goods valued at $195.99 billion were transported on Iowa
highways (BTS, 2012). PMSs that use robust pavement prediction models are needed to ensure continued optimum performance of Iowa highways. In the past, these models were developed from historical information about pavement condition data.
In this research, historical climate data was acquired from the Iowa Environmental Mesonet and integrated with pavement condition data to include all related variables in prediction modeling. An artificial neural network (ANN) model was used to predict the performance of ride, cracking, rutting, and faulting indices on different pavement types. The goodness of fit of the ANN prediction models was compared with multiple linear regression (MLR) models. The results show that ANN models were more accurate in predicting future conditions than MLR models. The contribution of input variables in prediction models were also determined and discussed.
The results indicated that weather factors directly influence highway pavement conditions, and that ANN model results can be used by decision makers and maintenance engineers to determine proper treatment actions and pavement designs to withstand harsh weather over the years. An ANN model that was used to estimate the correlation between the rutting depth and structural capacity of asphalt pavements suggests that rutting depth can be an indicator of structural capacity. As such, an ANN approach might be feasible for small
transportation agencies (e.g., cities and counties) that cannot afford to collect structural information.
CHAPTER 1: INTRODUCTION
State highway agencies spend millions of dollars each year on maintenance and rehabilitation to meet legislative, agency, and public requirements. Effective pavement
management requires a systematic approach that includes project planning, design, construction, maintenance, and rehabilitation. Pavement management systems (PMS) play a significant role in managing the condition of highway networks efficiently based on cost-effective strategies to be applied at a given time for maintaining that pavement condition at an acceptable level so the pavement can satisfy the demands of traffic and environment over its service life. In general, pavement conditions are characterized by cracking, surface deformation, roughness, surface friction (skid resistance), or faulting.
Individual PMSs operate on two administrative levels, the network and project management levels. At the network management level, a PMS predicts the overall pavement performance for determining budget allocation and treatment strategies. At the project management level, more detailed information and specific treatment options are required to determine when a particular pavement section may need maintenance or rehabilitation action.
Traffic loading and environmental factors result in pavement distress. The ability to trace that distress over time allows researchers and agency decision makers to develop performance prediction models. Predicting pavement performance requires historical data about pavement conditions, traffic loading, structural characteristics, and climate data. These data can be acquired from a single test road or from in-service pavements to obtain data for more practical prediction models. However, constructing and monitoring single test roads is expensive and unrealistic for small and local agencies. Developing accurate prediction models for pavements allows
transportation agencies to effectively manage their highways in terms of budget allocation and scheduling maintenance and rehabilitation activities.
In this research, historical traffic loading and pavement condition data was obtained from the Iowa Department of Transportation (DOT), and climate data was acquired from the Iowa Environmental Mesonet (IEM) in order to include all related variables in the prediction models. The results of this research will improve pavement management strategies by predicting an accurate pavement distress, and evaluate the impact of Iowa weather conditions on predicting pavement performance.
Problem Statement
The Iowa DOT manages three primary highway systems (i.e., Interstate, US, and Iowa highways) that represent 8% (approximately 9,000 miles) of the total roadway system in the state (114,000 miles), but these systems carry around 62% of the total vehicle miles traveled (VMT) and 92% of the total large truck VMT (ASCE, 2015). These highways play a major role in Iowa’s economy by connecting customers and supplies across the United States, and the roads are important to economic development in several sectors such as agriculture, manufacturing, and industry. According to the Bureau of Transportation Statistics, in 2012 around 263.36 billion tons of goods valued at $195.99 billion were transported on Iowa highways to other states (BTS, 2012).
Iowa faces critical challenges in providing a safe, efficient highway system, particularly in terms of balancing optimum highway conditions and available local, state, and federal funds. According to the American Society of Civil Engineers, 45% of major roads in Iowa were in fair condition, and large truck VMT, which directly affects pavement deterioration, will increase by 66% between 2015 and 2040 (2105). The Iowa DOT has allocated about $2.7 billion for
highway construction and $1.2 billion for improving highway safety during fiscal years 2015 to 2019 (ASCE, 2015). Despite these allocations, Iowa DOT administration, maintenance and construction costs result in an estimated annual funding shortfall of over $215 million (Iowa DOT, 2016).
Current PMS models used by the Iowa DOT do not consider climate factors and as such, may not be accurate. Therefore, the Iowa DOT could benefit from better prediction of the future needs of pavements to ensure they serve as effectively as possible. Therefore, efforts have been made to acquire historical climate data from Iowa Environmental Mesonet (IEM) and integrate it with pavement condition data from Iowa DOT. Then pavement performance models could be developed for asphalt, concrete, and composite pavements.
In addition to pavement performance modeling, some transportation agencies (e.g., cities and counties) do not have the capability for conducting deflection tests on their roadways for structural evaluation because these tests generally require specialized equipment, experience, and knowledge. As a result, these agencies may rely primarily on functional condition data to assess the strength of their roadways. However artificial neural network (ANN) pavement prediction models have been developed that can account for both pavement conditions and climate data and can estimate the relationship between structural capacity and rutting depth in asphalt pavement at the network level.
Research Objectives
The goal of this research is to explore pavement performance prediction models that can help decision makers take appropriate actions by meeting the following objectives:
1. Developing and comparing traditional regression and artificial neural network models in predicting future pavement conditions for asphalt, concrete, and composite pavements and support pavement management decisions.
2. Determining the impact of various input variables on the deterioration of pavement conditions.
3. Utilizing an ANN model to estimate the correlation between structural capacity and rutting depth on asphalt pavements that will allow agencies to consider structural capacity in making investment decisions.
Dissertation Organization
Four chapters make up the rest of this dissertation. Chapter two presents information about pavement management systems and pavement condition evaluation and summarizes previous studies that have been done in modeling pavement performance. Chapter three describes the data and methodology used to predict pavement performance. Chapter four presents the results of developing prediction models, determining the relative importance of input variables, and estimating the correlation between rutting depth and structural capacity. Chapter five summarizes the research contributions with recommendations for future work.
CHAPTER 2: LITERATURE REVIEW
This chapter summarizes the literature about pavement management systems, assessment categories in evaluating pavements, pavement condition ratings, and pavement performance modeling.
Pavement Management Systems (PMS)
Management of large transportation assets requires tools for coordinating activities in an optimal manner, and a pavement management system (PMS) is an element of transportation infrastructure asset management that includes all transportation activities. A PMS is defined by the American Association of State Highway and Transportation Officials (AASHTO) as “a set of tools or methods that assist decision makers in finding optimum strategies for providing,
evaluating, and maintaining pavements in a serviceable condition over a period of time” (AASHTO, 1993, p. I-31). The PMS concept began in the mid-1960s as support tools to help decision makers provide required rehabilitation and maintenance for highways with limited available funds (Kirbas, 2010).
In general, PMS activities include investment planning, design, construction, maintenance, and routine pavement evaluation (Falls et al., 2001). A PMS can improve the efficiency of decisions by reviewing the consequences of decisions made at different management levels (George, 2000). Moreover, by applying a PMS, the potential impact of limited funding can be reduced by optimizing budget allocation, prioritizing projects in a data-driven process, and using effective maintenance strategies (TAC, 1999).
A PMS provides highway agencies with the following capabilities (AASHTO, 2012):
Estimating the funds required for improving pavement condition up to a particular condition level.
Identifying pavement treatments and preservation options based on available funds.
Evaluating the long-term impact of changes in material properties, construction practices, or design procedures on pavement performance.
To develop a PMS, it is necessary to understand the PMS levels, PMS components, and available prediction models.
Pavement Management Levels
There are two administrative levels, the network and project management levels, in any pavement management and decision-making system (Mbwana, 2001). At the network level, decisions to achieve the agency’s goals are identified and, at this level, prioritized reconstruction and rehabilitation activities and a schedule for maintenance activities are developed. Collecting specific data about an entire pavement network requires a significant investment, so agencies attempt to achieve a balance between the level of detail in data and available resources
(AASHTO, 2012). The network level is typically used by directors of state-level transportation agencies or budget directors since they want to know the overall indices of pavement conditions, riding quality, or safety (Mbwana, 2001).
The project level, on the other hand, represents decisions that concentrate on individual portions of the network, and more detailed data collection methods, such as material testing to evaluate pavement conditions, are required at this level. Traffic loading, environmental factors, material properties, construction and maintenance work, and available funding are considered to be the inputs for project-level analysis (Dillon, 2003). These detailed data are utilized to predict
pavement performance and establish optimal maintenance strategies. A comparison of the different criteria between project and network levels is shown in Table 1.
Table 1. Differences between PMS network and project levels (AASHTO, 2012)
Decision
Level Decision Makers Type of Decisions
Range of Assets Considered Level of Detail Breadth of Decisions Network Asset manager Pavement management engineer District engineer Treatment recommendations for a multi-year plan Funding needed to achieve
performance targets Consequences of different
investment strategies
Range of assets in a
geographic area Moderate Moderate
Project Design engineer Construction engineer Materials engineer Operations engineer
Maintenance activities for current funding year Pavement rehabilitation
thickness design Material type selection Life cycle costing
Specific assets in a
particular area High Focused
PMS Components
The components of PMSs vary based on available information and resources. AASHTO (2012) has determined the activities of pavement management systems to be the following:
Inventorying pavement assets, including all information related to network pavements.
Using models to analyze existing data to predict future pavement performance that supports appropriate decisions.
Filing all related information about pavement networks to be used as feedback in
generating standards or reports that can be used by other agencies to improve their PMS. A PMS must at least contain inventories of physical pavement features, pavement conditions, traffic information, pavement performance analysis, and investment strategies for prioritizing projects for maintenance or rehabilitation activities for state highways and the national highway system (Cottrel et al., 1996). Modern PMSs should collect pavement condition data, analyze the data to determine maintenance and rehabilitation plans, and provide
Assessment Categories in Evaluating Pavement Conditions
Evaluating pavement conditions is a fundamental component of the decision making process that is carried out to determine the current condition of pavement in terms of functional and structural adequacy. Accurate evaluation of pavement conditions requires good quality pavement distress data (e.g., accurately collected, collected often enough, and sufficient data for analysis). Haas et al. (1994) reported that pavement conditions can be determined by measuring roughness (as related to ride quality); surface distress, deflection (as related to structural
adequacy); and surface friction (as related to safety). The following sections describe each assessment category.
Pavement Roughness
Pavement roughness is defined as pavement surface irregularities that can affect driver safety, vehicle operating costs, and ride quality (Islam and Buttlar, 2012). Pavement roughness is thus considered the most important pavement performance indicator because it is the primary characteristic that affects road users. Several factors have been found to affect pavement roughness, including traffic loading, climate factors, pavement type, drainage type, subgrade properties, and construction quality (Kargah-Ostadi et al., 2010). The International Roughness Index (IRI) is widely used by highway agencies to characterize pavement roughness as a ride quality indicator (Papagiannakis and Raveendran, 1998).
Pavement Surface Distress
The quantification of type, severity, and extent of surface distress is an effective approach to evaluate pavement conditions. There are different types of pavement materials (e.g., asphalt, concrete, and composite such as a concrete layer overlaid by an asphalt layer pavements), and for each pavement type, there are different types of distress that could impact pavement
performance. In a 2003 AASHTO report, Miller and Bellinger identified fifteen distress types for asphalt pavements, sixteen for jointed concrete pavements, and fifteen for continuously
reinforced concrete pavements. While distress types of composite and asphalt pavements are typically similar, composite pavements are exposed to reflection cracking, reflecting an asphalt layer joint or cracking deficiency (Huang, 1993). The causes and description of the major distresses are reported as follows.
Alligator cracking, also known as fatigue or map cracking, is one of the major distress types observed in asphalt pavements. Alligator cracking is defined as a series of interconnecting cracks that initiate from the bottom of the surface layer where the tensile stress is high (Castell, 2000). It is a load-related cracking caused by repeated traffic loading, and the severity of cracking depends on the stiffness modulus of the pavement material (El-Basyouny, 2005). Low strength of a pavement structure and improper drainage can also cause fatigue cracking (Dillon, 2003).
Longitudinal cracking occurs parallel to the pavement centerline. Chen and Won (2007) attribute the causes of longitudinal cracking in concrete pavement to delayed or shallow cutting of longitudinal joints and weak support under the concrete slab. In asphalt pavements,
longitudinal cracking is caused by poor construction of joints between lanes or pavement shrinkage as a result of freeze-thaw cycles or low temperature, while in concrete pavement, the main causes of longitudinal cracking are repeated traffic loading and thermal gradient curling (Colorado DOT, 2004).
Transverse cracking occurs perpendicular to the pavement centerline and includes
shrinkage cracking and reflective cracking, with the severity of transverse cracking dependent on pavement thickness and properties of base materials (Zhou, 2010). The differential movement of
layers beneath the pavement surface and freeze-thaw cycles are the usual reasons for transverse cracking (Texas DOT, 2015).
Rutting is defined as a longitudinal deformation in the wheel-path of asphalt pavements, and rutting severity is affected by traffic loading or temperature variations that affect subgrade strength (Archilla and Madanat, 2000). Wang, Zhang, and Tan (2009) report that high
temperature also has a significant effect on rutting propagation and that more attention should be paid to pavement design, material selection, and construction methods to mitigate the extent of rutting.
Faulting, a common type of distress in concrete pavements, results from vertical displacement between subsequent slabs across a joint or crack. Faulting is a concern because it can negatively affect ride quality (Bektas et. al., 2015). Faulting occurs at transverse joints as a result of inadequate load transfer, pumping action, and lack of base support (Jung et. al., 2008). According to the Ohio DOT, curling or warping of slabs due to temperature variation, settlement in subgrade soil, and pumping action of underlying fine soils are the main causes of faulting in concrete pavements (2006).
Structural Adequacy
Structural adequacy is described as the ability of pavement structures to carry expected traffic loads with acceptable levels of service. So evaluating structural capacity is an important consideration in pavement highway systems for optimizing network maintenance and agency fund allocation.
At least 14 state transportation agencies are beginning to incorporate structural evaluation by conducting deflection testing as a part of the routine evaluation of their highways (Rada et. al., 2016). Generally, structural assessment is conducted for a specific pavement section at the
pavement management project level due to the detailed data, such as deflection, layer thickness, and laboratory results of material properties that are required to evaluate the structural strength of pavements (Haas et. al., 1994). Falling weight deflectometers (FWD), which have been
commonly used in the United State since the 1980s, measure the deflection caused by an impact load at different distances from the load source as shown in Figure 1 (Rada et. al., 2016).
Figure 1. Schematic of FWD (Smith et al., 2017)
Rolling wheel deflectometers (RWD) have been developed to measure deflections at traffic speeds on in-service pavements for use in network-level pavement management and evaluation. An RWD impacts a vertical load to the pavement surface and measures the
deflections by four spot laser mounted on a beam beneath the trailer (Smith et. al., 2017). RWDs provide several advantages over FWD testing because RWD testing does not disturb traffic flow or affect safety on the highway, and also it can be used at the network level management (Abdel-Khalek et. al., 2012). Iowa DOT compared the results of deflection values from FWD and RWD, and reported that FWD and RWD results were well correlated (Iowa DOT, 2006).
Surface Friction
Safety is an integral component of any PMS, and maintaining proper surface friction or skid resistance is an important parameter related to safety, especially in wet weather. Increasing the depth of the pavement surface texture from 0.3 mm to 1.5 mm can improve the surface
friction that can decrease the crash rate by 50% (AASHTO, 2012). The equipment for measuring skid resistance has developed over the years, and all are mainly based on principles of friction between tires and the road surface (Flintsch et. al., 2012).
Pavement Condition Ratings
In the 1950s the American Association of State Highway Officials (AASHO) developed a pavement condition rating (PCR), also known as the present serviceability rating (PSR), that was based on subjective ratings of ride quality and rater experience (Attoh-Okine and Adarkwa, 2013). While the PSR is simple and convenient to use, it does not accurately evaluate pavement conditions because the factors are subjective (e.g., interaction of riding quality, rater’s
perception, and vehicle characteristics). The subjectivity of PSR led to the development of the pavement serviceability index (PSI), a more objective rating system. The PSI was developed in 1960 by Carey and Irick and was based mainly on panel ratings and measurements of roughness, rut depth, and cracking (Sun, 2001).
The main difference between the PSI and PSR is that PSI is derived by a formula for estimating the physical features of the pavement, and the PSR is mainly based on individual observations (Pierce et. al., 2013). Both the PSR and PSI have been widely used by highway agencies, but in the 1970s, the U.S. Army Corps of Engineers developed the Pavement Condition Index (PCI) based on types and severity of distress (Shahnazari et al., 2012). The PCI has been used since then by state DOTs for pavement evaluation.
In general, PCI ratings are single values that reflect the overall pavement condition based on the measurements of pavement roughness, surface distress, deflection, and surface friction. PCI values are on a numerical scale that can be used as a communication tool to provide a brief information about the pavement condition to senior administrators, elected officials, and the
public (Haas et. al., 1994). Most importantly, the PCI values can be utilized by decision makers to assess the health of a pavement network, predict the time required for maintenance and rehabilitation actions, and estimate future funding needs (McNeil et. al., 1992).
Pavement Performance Modeling
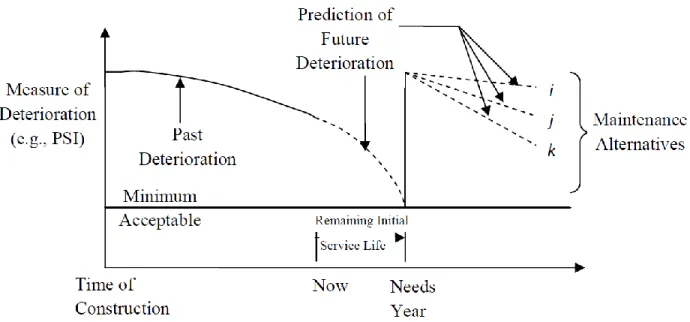
Successful implementation of a pavement management system (PMS) requires an accurate performance prediction model for optimizing maintenance and rehabilitation strategies throughout the pavement service time. The pavement performance prediction model, described as an engine in a pavement management system, is defined as “a mathematical description of the expected values that a pavement attribute will take during a specified analysis period” (Hudson et. al., 1979, p. 8). Pavement performance is also defined in terms of how pavement changes its condition over time (Lytton, 1987). Prediction models help agency engineers to know when, where, and what maintenance actions should be taken (George, 2000). Figure 2 illustrates how an existing pavement section would behave in predicting its future performance.
A prediction model can be employed at both the network and project management levels to determine maintenance and rehabilitation strategies. At the network level, the prediction model can predict the future condition of a pavement, the required budget, and project
prioritization. The roles of pavement performance prediction models at the project level are to prioritize projects, to determine life cycle costs, and to determine maintenance and rehabilitation alternatives for each candidate project. Pavement performance is predicted based on structural properties, environmental factors, and traffic loading, enabling highway agencies to allocate budget and prioritize their projects (Hong and Prozzi, 2006).
Performance prediction models play a significant role in pavement management system with respect to the following activities:
estimating future pavement conditions;
identifying appropriate timing for pavement maintenance and rehabilitation actions;
determining the most cost-effective treatment strategy in a pavement network;
estimating funds required to meet agency objectives; and
determining the impact of different pavement investment strategies (AASHTO, 2012). Modeling pavement performance is also required to satisfy the requirements of the federal legislation called Moving Ahead for Progress in the 21st Century Act (MAP-21), which was introduced on July, 2012. MAP-21 requires each state to have a risk-based asset
management plan and performance targets with respect to safety, improving infrastructure conditions, reducing congestion, system reliability, facilitate good movement and economic vitality, environmental sustainability, and project delivery (Corley-Lay, 2014). Evaluating pavement condition of highways is required by MAP-21 through its infrastructure conditions criteria.
The typical form of a performance model is to relate a pavement performance indicator to explanatory variables to establish a causal relationship between them and determine factors that influence pavement performance. The four requirements of a reliable performance prediction model are long term historical data of in-service pavements, including all variables that have a significant effect on response variables, an adequate model form that considers interaction and nonlinearity, and criteria to evaluate the accuracy of the model (Darter, 1980).
Various pavement performance models used in pavement management include: deterministic, probabilistic, expert or knowledge-based, and artificial neural network (ANN) models (Wolters and Zimmerman, 2010).
Deterministic Models
Deterministic models predict a single dependent value (e.g., PCI) from one or more independent variables (e.g., pavement age, traffic loading, environment, and structural parameters). Deterministic models, based mostly on regression analysis, can be broken down into three subcategories: empirical, mechanistic, and empirical-mechanistic models (Li, Xie and Haas, 1996).
Empirical models, widely used in pavement performance studies, require massive data for modeling. They estimate pavement response to variations in some input variables. Empirical models include S-shaped curves, polynomials, and logistic growth patterns. Several advantages and disadvantages of using empirical models have been reported by Silva et al. (2000):
Advantages of using empirical models:
A simple mathematical method can be used to predict the pavement performance.
The relationships between actual and predicted coefficients can be easily described.
Disadvantages of using empirical models:
Accurate data is required to get a good regression model, and outliers may affect accuracy.
Maintenance or rehabilitation activity data may affect accuracy of model performance.
All significant variables must be to be included in the performance model.
Mechanistic models determine interaction between traffic loading and dynamic pavement responses (i.e., stress, strain, and deflection). Mechanistic models require extensive laboratory testing data or precise measurements as primary input factors that influence pavement
performance (Mills et. al., 2012). In general, pavement engineers usually do not use primary response parameters because they deal mostly with more readily available distress data and pavement properties to predict pavement performance (Haas et al., 1994). As a result, they have not been able to accurately predict pavement performance. Further, pure mechanistic models are not considered to be prediction models (Shahin, 2005).
Mechanistic-empirical (ME) models, however, can be used for performance predictions because they address the complexity of interaction between stress, strain, and deflection with traffic loadings. ME models combine mechanistic and empirical models by using regression techniques. Also, they are more representative of pavement performance because they include new parameters such as material properties, traffic loading, and climate factors. However, according to Ayed (2016) there is a need to investigate the suitability of ME models at the network level.
Probabilistic Models
Probabilistic models are used to predict a range of values for dependent variables, such as probability of pavement condition changes from a given pavement condition to another
condition. These models are used to capture the uncertainty in material properties, environmental conditions, and traffic loadings that can produce less accurate models. According to Golroo and Tighe (2012), the common types of probabilistic models are Markov models, Bayesian
regression, survivor curves, and semi-Markov models. The primary Markov chain model
involves an initial probability and a transition probability matrix, as shown in Equation 1, and the probability matrix shown in Figure 3 (Li et. al., 1996).
𝑃𝑖= 𝑃𝑜(𝑃)𝑖 (1)
where:
P0 = the vector of initial probability; P =probability transition matrix;
Pi = probability condition of ith duty cycle; and
i = duty cycle. P = 1 ... 0 0 0 0 ... 0 0 0 0 . . . . . . . . . . . . . . . . . . . . . . . . ... 0 0 0 ... 0 0 ... 0 ... ) 1 ( 4 44 3 34 33 2 24 23 22 1 14 13 12 11 n n n n n n P P P P P P P P P P P P P P P
Figure 3. Markov Matrix
The major benefit of using probabilistic models is that the amount of data required for model development is less than the data needed for deterministic models (Jack and Chou, 2001).
According to Golroo and Tighe (2012), the benefits of utilizing probabilistic models for predicting pavement performance are as follows:
probabilistic models, in conjunction with other tools, can capture uncertainty in a pavement performance-prediction model;
the probabilistic approach is more realistic than the deterministic approach because it combines field observations and expert opinion; and
expert knowledge can be incorporated in cases where the database is incomplete, of low quality, or imprecise.
Expert Models
Expert models are based on the collective experience and knowledge of agency engineers who are familiar with pavement deterioration patterns, and expert models can be used when there are no historical data available, there are missing data, or if a new design is produced (Wolters and Zimmerman, 2010). Hicks and Groeger (2011) summarized some states’ practices in predicting pavement performance and reported that many agencies have used expert opinions. For example, the Connecticut DOT developed their performance curve based on expert panels, the Massachusetts DOT uses expert knowledge in predicting cracking, raveling, ride, and rutting performance, and the New Hampshire DOT predicts ride, cracking, and rutting indices based on expert knowledge.
Artificial Neural Network (ANN) Models
While various studies including factors that affect pavement performance have been conducted on pavement performance modeling, most of the models have faced challenges such as dealing with a large number of input variables, lack of availability of some variables, and correlation between the variables (Kargah-Ostadi and Stoffels, 2015). Recently, ANN models
have been widely used to simulate the biological nervous systems in human brain. The biological nervous system contains billions of neuron cells, and each neuron receives inputs from other neurons, processes them by transfer function, and sends its own output to the next layer (Mehta et al., 2008).
ANN models use data to build prediction models and compute the relative importance of variables instead of the natural relationships among variables. An ANN can be defined as, “A computational mechanism with an ability to acquire, represent, and compute mapping from one multivariate space of information to another, given a set of data representing that mapping” (Rafiq et. al., 2001, p. 1542). ANN techniques can solve complex problems because of the capability of interconnecting neurons between layers to achieve computation of large data volumes (Basheer and Hajmeer, 2000).
Engineers often are faced with incomplete or noisy data, so ANN models may be the most appropriate models for recognizing meaningful relationships from data patterns to solve a particular problem (Rafiq et al. 2001). Zhang et al. (1998) reported that ANN models can predict nonlinear relationships between variables as well traditional models that are usually used to predict these relationships.
ANN models have been widely used in different civil engineering areas with good results because they are accurate and convenient (Karlaftis and Vlahogianni, 2011). Adeli (2001)
conducted a review of the neural network model literature from 1989 to 2000, with a focus on structural engineering, construction engineering, and management, and reported that ANN models are suitable for modeling complex problems.
Other, more recent studies have shown the robustness of ANN models compared to regression models. For example, the comparison between ANN and autoregressive time series
models for forecasting freeway speeds showed that neural networks provide more accurate predictions than classical statistical approaches (Vlahogianni and Karlaftis, 2013). Golshani et al. (2017) compared the prediction capabilities of traditional statistical models and neural network models for modeling two critical trip-related decisions related to travel mode and departure time. Their results show that the neural network models offered better performance with an easier and faster implementation process. ANN and multivariable regression models were also used to predict stress intensity factors in pavement cracking with results showing the advantage of utilizing ANN over multivariable regression models with respect to prediction accuracy (Wu et. al., 2014). In a 2004 study, Felker, Najjar, and Hossain reported that the ANN models provided a reasonably high R2 in predicting roughness for jointed portland cement concrete pavements with R2 = 0.90, while the statistical analysis approach yielded R2 = 0.73 (2004). In a study by Kargah-Ostad, Stoffels, and Tabatabaee (2010), the ANN model also performed successfully in
predicting IRI values using complex input variables. ANN models also have been used to predict cracking index for Florida’s highways and were found to be more accurate than an
autoregressive model (Lou et. al., 2001). Gencel, Kocabas, Gok, and Koksal developed ANN and linear regression models to determine the correlation between cement content, metal content, and traffic loading on rough wear of concrete, and the ANN models were superior to linear
regression models in predicting the abrasive wear of concrete (2011).
Basheer and Hajmeer (2000) reported that ANN models have several capabilities to solve various problems from several categories such as:
Pattern classification: ANN models can use supervised learning to deal with unknown input pattern and, unlike traditional statistics models, require no linearity assumption.
same cluster by finding similarities and differences between inputs.
Modeling: training input and output data to find the relationship between them using multilinear ANN model.
Optimization: ANN models were more efficient in solving optimization problems by maximizing or minimizing an objective function subject to a set of constraints.
Further, Attoh-Okine (1994) reported two benefits of using ANN over more traditional statistical prediction models: ANN models can handle unseen data and generalize results and they can solve complex problems because of their massive parallelism and strong
interconnectivity.
Summary of Pavement Performance Models
The literature indicates that researchers have used ANN models to predict pavement performance since at least the 1990s and that ANN pavement performance models are powerful modeling tools. However, most of the existing studies in predicting pavement performance have focused on a specific pavement type at the project management level. Further, many models have not included all the parameters that might impact pavement performance because of lack of data, and many previous studies do not quantify the impact of input variables such as weather
CHAPTER 3: METHODS
Decision makers rely on robust models to evaluate pavement performance and improve pavement asset management. Predicting pavement performance is often considered to be a difficult task because many factors must be considered. Consequently, accurate pavement performance models that include more pavement data are needed as the basis for pavement maintenance and rehabilitation strategies. There are many causes of pavement deterioration that potentially vary from one road section to the next, which makes the modeling of pavement performance a complex process. Therefore, developing pavement performance prediction models requires both obtaining relevant data (e.g., pavement conditions and climate data) and identifying robust performance prediction approaches. In this research, multiple linear regression (MLR) and artificial neural network (ANN) models were used to predict pavement performance and the results were compared. Also, this research analyzed the results of ANN models to determine the relative contribution of each variable on several distress indices. An ANN model was used to model a reliable relationship between structural strength numbers (SN) calculated from
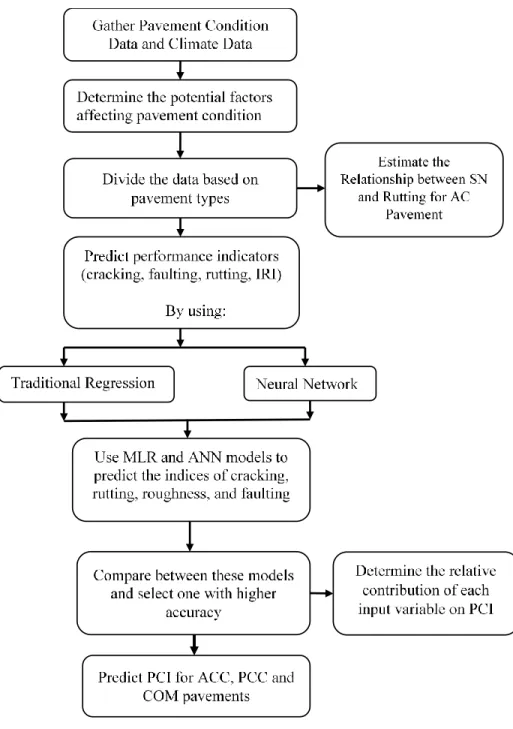
measuring deflections on roadways after impact and rutting depth at the network level for ACC pavements. The flowchart in Figure 4 describes the research steps.
Data are the main building blocks in performance modeling, so obtaining good quality data is essential to getting accurate results. In this study, two kinds of data were obtained. Pavement distress data was obtained from the Iowa DOT Pavement Management Information System (PMIS) and climate data was obtained from the Iowa Environmental Mesonet (IEM). Data used in this study are described in the following sections, followed by sections that discuss data integration, developing ANN and MLR pavement performance models, and developing an ANN model to correlate structural capacity and rutting.
Figure 4. Research flowchart
Pavement Distress Data
The Iowa DOT PMIS database includes information about the highway system, including section identification, construction history, pavement type, maintenance history, traffic loading,
structure parameters, and pavement distress. The Iowa DOT collects data about pavement surface distresses such as longitudinal cracking, transverse cracking, wheel-path cracking, alligator cracking, durability cracking, joint spalling, patching, and surface friction (skid
resistance). These pavement distresses are assigned three severity levels: low, medium and high. The Iowa DOT also collects rutting depths for asphalt pavements and faulting for concrete pavements and measures pavement roughness, since it is used as one of the performance indicators (Bektas et. al., 2014).
The pavement condition data used in this study were collected on a two-year cycle. Pavement condition data for northwest Iowa were collected in even years (e.g., 2010, 2012, and 2014), while pavement condition data in southeast Iowa are collected in odd years (e.g., 2011, 2013, and 2015) as shown in Figure 5. The data collection process costs Iowa DOT around $1 million annually on contracts for collecting pavement condition data (Bektas, 2015).
The collected pavement condition data are aggregated into the PMIS database by averaging the rutting and IRI values to represent the roughness and rutting of large pavement sections and by counting the lengths of cracks to represent the length of cracks per unit length. Each pavement section in the database includes IRI values, rutting depth, faulting values, and surface distresses. Each section in the PMIS is defined by the route number, the county, the highway system (Interstate, US, or Iowa highways), the direction, the district, and the beginning and ending mileposts, as shown in Figure 6. The PMIS also contains traffic, material, layer thicknesses, and pavement history information for each section. (Jeong et. al., 2016).
Figure 6. Screenshot from the PMIS database
Table 2 presents the total of directional miles for each of the seven pavement types in the PMIS database in 2015.
In this research, only asphalt concrete cement (ACC), portland concrete cement (PCC), and composite (COM) pavements were selected for developing performance prediction models because there were insufficient miles for the other pavement types. ACC and PCC pavements are described as flexible and rigid pavements, respectively.
Pavement condition data from 1998 through the end of 2015 was used in this research. Each pavement section in the study had the same features (i.e., pavement type, maintenance history, traffic loading, subgrade stiffness, layer thicknesses, and pavement distresses). Rutting,
roughness, faulting, longitudinal cracking, longitudinal wheel-path cracking, transverse cracking, durability cracking, patching, and joint spalling were pavement distress features of the pavement sections.
Table 2. Pavement types in Iowa highways
Pavement Types Directional
Miles % of Miles
ACC Asphalt concrete cement 1798.21 16.17%
PCC Portland concrete cement 3487.30 31.36%
COM Composite with asphalt surface 5156.81 46.38% CRC w/ATB Continuous reinforcement concrete with
asphalt treated base
4.83 0.04%
CRC w/GSB or CTB Continuous reinforcement concrete with granular or cement treated base
0.97 0.01%
Composite w/JT PCC
Composite built on jointed concrete 262.23 2.36% Composite w/CRC Composite built on continuous reinforcement
concrete
409.45 3.68%
Total 11119.80 100.00%
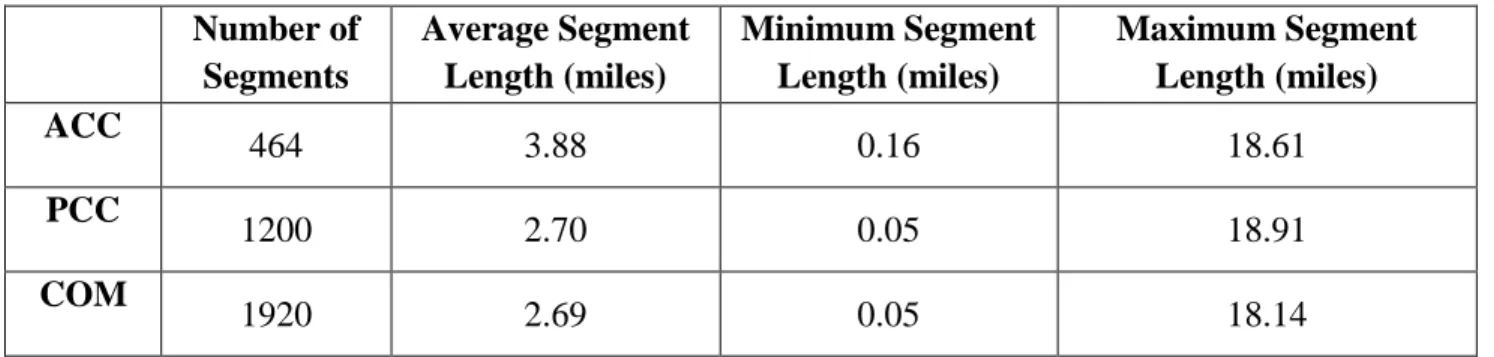
Iowa highways are classified into three systems: Interstate highways, US highways, and Iowa highways. The most recent PMIS data from 2015 shows totals of approximately 460 miles of interstate highway, 3544 miles of US highway, and 4567 miles of Iowa highway. The number of miles of ACC, PCC, and COM pavements in interstate, US, and Iowa highways are given in Table 3. The lengths and number of pavement segments at each pavement type based on 2015 data are given in Table 4.
Table 3. Center mile length of each pavement type (miles) Pavement Type
ACC PCC COM Total
Interstate 57 364 39 460
Iowa 1366 752 2449 4567
US 221 1098 2225 3544
Table 4. Descriptive statistics of pavement segments Number of Segments Average Segment Length (miles) Minimum Segment Length (miles) Maximum Segment Length (miles) ACC 464 3.88 0.16 18.61 PCC 1200 2.70 0.05 18.91 COM 1920 2.69 0.05 18.14
Pavement Condition Indices
Four indices have been developed to evaluate the pavement conditions of Iowa highways. These indices are on a 100-point scale to be consistent with the PCI scale that ranges from 0 to 100. Cracking and riding indices were developed for ACC, PCC, and COM pavements, rutting indices were developed for ACC and COM pavements, and a faulting index was developed for PCC pavements.
Cracking Index
Four types of cracking are evaluated by Iowa DOT for ACC pavements: transverse cracking (count/mile), longitudinal cracking (ft/mile), longitudinal-wheel-path cracking (ft/mile), and alligator cracking (ft2/mile). For PCC pavements, transverse cracking (count/mile),
longitudinal cracking (ft/mile), and longitudinal-wheel-path cracking (ft/mile) are evaluated. The cracking index was developed based on a 100-point scale, with 0 indicating the worst condition and 100 indicating the best condition. The cracking index includes sub-indices for each type of crack. For instance, for ACC pavements, four sub-indices were developed for transverse, longitudinal, longitudinal-wheel-path, and alligator cracking. For PCC pavements, two sub-indices were developed for transverse and longitudinal cracking. Iowa DOT combines
longitudinal and longitudinal-wheel-path into one index since these show similar behavior in PCC pavements.
These sub-indices are calculated based on deduction from 100 as shown in Equation 2,
𝐶𝑟𝑎𝑐𝑘 𝑆𝑢𝑏_𝑖𝑛𝑑𝑒𝑥 = 100 − (100 ×𝑐𝑟𝑎𝑐𝑘 𝑣𝑎𝑙𝑢𝑒
𝑡𝑟𝑒𝑠ℎ𝑜𝑙𝑑 𝑣𝑎𝑙𝑢𝑒 ) (2)
Iowa DOT has determined threshold values for calculating sub-indices for each pavement type in Iowa highways as shown in Table 5 (Mark Murphy, personal communication, December, 2017).
Table 5. Threshold for cracking indices
Pavement Type
Cracking Type ACC PCC COM
Transverse (count/mile) 483 241 805
Longitudinal (ft/mile) 2640 1320 2640
Longitudinal-wheel-path (ft/mile) 2640 — 2640
Alligator (ft2/mile) 6236 — 6236
A cracking index for each pavement type was calculated by summing the weighted coefficient values for ACC and COM and for PCC as shown in Equation 3 (for ACC and COM) and 4 (for PCC). The coefficient values of each sub-index were determined by Iowa DOT using equations 3 and 4.
𝐶𝑟𝑎𝑐𝑘 𝐼𝑛𝑑𝑒𝑥 (𝐴𝐶𝐶) = (0.2 × 𝑇𝑟𝑎𝑛𝑠𝑣𝑒𝑟𝑠𝑒) + (0.1 × 𝐿𝑜𝑛𝑔𝑖𝑡𝑢𝑑𝑖𝑛𝑎𝑙) + (0.3 × 𝐿𝑜𝑛𝑔𝑖𝑡𝑢𝑑𝑖𝑛𝑎𝑙𝑊𝑃) + (0.4 × 𝐴𝑙𝑙𝑖𝑔𝑎𝑡𝑜𝑟)
(3)
𝐶𝑟𝑎𝑐𝑘 𝐼𝑛𝑑𝑒𝑥 (𝑃𝐶𝐶) = (0.6 × 𝑇𝑟𝑎𝑛𝑠𝑣𝑒𝑟𝑠𝑒) + (0.4 × 𝐿𝑜𝑛𝑔𝑖𝑡𝑢𝑑𝑖𝑛𝑎𝑙) (4)
Riding Index
The Iowa DOT calculates the riding index by converting the IRI values using Equation 5:
𝑅𝑖𝑑𝑖𝑛𝑔 𝐼𝑛𝑑𝑒𝑥 = (𝐼𝑅𝐼 𝑣𝑎𝑙𝑢𝑒𝑠 −253
The riding index is a 100 scale, with 0 being the worst and 100 being perfect. On the Iowa DOT ride index scale, all IRI values below 32 (in./mile) are considered to be 100, and all values above 253 (in./mile) are considered to be 0.
Rutting Index
Rutting depth is collected by Iowa DOT for ACC and COM pavements. Iowa DOT converts the rutting depth values into a 100-point scale rutting index ranging from 0 (worst) to 100 (perfect) using Equation 6.
𝑅𝑢𝑡𝑡𝑖𝑛𝑔 𝐼𝑛𝑑𝑒𝑥 = 100 − ((𝑅𝑢𝑡𝑡𝑖𝑛𝑔 𝑑𝑒𝑝𝑡ℎ
0.47 ) × 100) (6)
Faulting Index
The faulting index is only calculated for PCC pavements (FIPCC) based on the fault
measurements from the PMIS database. The fault index also is a 100 scale where 100 indicates the perfect condition (no faulting) and 0 the worst. The fault threshold value is 0.47 in. so values equal to or greater than so 0.47 are rated as 0 on the faulting index. The Iowa DOT converts the fault values into an index by using Equation 7.
𝐹𝑎𝑢𝑙𝑡𝑖𝑛𝑔 𝐼𝑛𝑑𝑒𝑥 = 100 − ((𝐹𝑎𝑢𝑙𝑡
0.47 ) × 100) (7)
Overall Pavement Condition Index
After calculating the individual indices, the overall pavement condition index (PCI) was calculated by combining the weighted individual indices. The weighing factors were determined by Iowa DOT. For PCC pavements, the PCI combines the cracking index, riding index, and faulting index by weighting factors based on Equation 8. For ACC and COM pavements, the PCI combines the cracking index, rutting index, and riding index as shown in Equation 9.
𝑃𝐶𝐼𝑃𝐶𝐶 = (0.4 × 𝐶𝑟𝑎𝑐𝑘𝑖𝑛𝑔 𝐼𝑛𝑑𝑒𝑥) + (0.4 × 𝑅𝑖𝑑𝑖𝑛𝑔 𝐼𝑛𝑑𝑒𝑥) + (0.2 × 𝐹𝑎𝑢𝑙𝑡𝑖𝑛𝑔 𝐼𝑛𝑑𝑒𝑥) (8) 𝑃𝐶𝐼𝐶𝑂𝑀 & 𝐴𝐶𝐶 = (0.4 × 𝐶𝑟𝑎𝑐𝑘𝑖𝑛𝑔 𝐼𝑛𝑑𝑒𝑥) + (0.4 × 𝑅𝑖𝑑𝑖𝑛𝑔 𝐼𝑛𝑑𝑒𝑥) + (0.2 × 𝑅𝑢𝑡𝑡𝑖𝑛𝑔 𝐼𝑛𝑑𝑒𝑥) (9)
Pavement Age
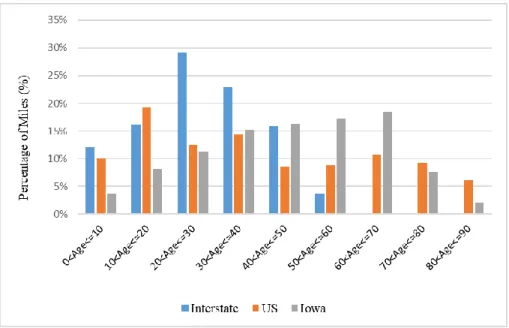
Pavement age, calculated as the difference between the PMIS year (input date) and either the most recent resurfacing or construction year, affects pavement condition. In 2015, more than 60% of miles of Iowa highways were 40 years old or older, while more than 50% of interstate and US highway miles were less than 30 years (Figure 7).
Figure 7. Distribution of pavement age of Iowa highway systems (2015)
Traffic Loading
Iowa highways carry heavy trucks, so traffic loading is a significant factor that might cause pavement deterioration. The traffic loading data in the PMIS database contains the average daily traffic (ADT); average daily truck traffic (Truck); and average equivalent single axle loads (ESAL) (18,000 lb). The ESAL converts all traffic loading with different magnitude and axle configuration into an equivalent number of 18,000 lb ESAL. Figure 8 shows the ESAL values for the Interstate, US, and Iowa systems in 2015 in Iowa. and Figure 9 shows changes in traffic loading over time.
Figure 8. Traffic loading distribution of Iowa highways (2015)
Figure 9. Changes in traffic loading on highways in Iowa
Climate Data
Weather conditions, such as temperature variation and moisture change, affect the
material properties of both pavement surfaces and sublayers (Žiliūtė et. al., 2016). Further, when saturated pavement material is subjected to frost heave during freeze-thaw cycles freezing causes
tensile stresses that increase deterioration process (Smith et. al., 2006). Later thawing leaves voids that can also contribute to pavement deterioration (Adkins et. al., 1989). The state of Iowa is located in a wet-freeze climate zone and is exposed to severe weather, especially in the winter, so it is important to investigate the effects of environmental factors on pavement condition, particularly since weather factors have not previously been considered in pavement performance modeling at the network level.
The climate data for this study was obtained from the Iowa Environmental Mesonet (IEM). The IEM is a data collection project developed by the Department of Agronomy at Iowa State University (ISU). The climate data in the IEM is based on observational data collected from the National Weather Service (NWS) by manual and automated sensors in each county across the state (Breakah et. al., 2010). The NWS is an agency in the United States that collects all related information about weather conditions. In Iowa, there are 111 weather stations as of 2015 (Figure 10).
The weather data that were used in the analysis were average annual temperature, average annual rainfall, average annual snowfall, and the number of freeze-thaw cycles. Figure 11 shows the format of the weather database that was obtained from the IEM at Iowa State University that contains weather data from 1951 to the present.
Figure 11. Screenshot of the IEM weather database
Freeze-thaw cycles were defined by counting the number of times the temperature changes from freezing to thawed states. In this research, the freeze-thaw cycle was considered when the temperature fell below a freeze point (to be more conservative, 30°F was considered the freeze point), and followed by the temperature rising above 32°F.
In some areas in Iowa, the number of freeze-thaw cycles was low because the
temperature stayed below 30°F all winter. For example, Figure 12 shows that the area in northern Iowa had the fewest freeze-thaw cycles in 2014. Most freeze-thaw cycles happen during spring and fall months when temperatures can be expected to change during a day.
Figure 12. Average annual freeze-thaw cycles for 2014
Data Integration
Geographic information system (GIS) software was used to integrate the PMIS road condition data and the IEM climate data according to locations. The GIS spatial integration process provided accurate overlays of the weather stations over Iowa highways. The GIS also was used to display weather conditions as colored maps. To ensure that the climate data and locations of each pavement section were associated, each pavement section was assigned to the closest weather station. For example, Figure 13 shows the 32 pavement sections that were closest to weather station IA0133.
Figure 13. Pavement sections associated with the closest weather station
The distances between the weather stations and their related pavement sections ranged from 0 to 24 miles with an average distance of around 7 miles, while most pavement sections are located between 0 and 5 miles from the weather station. Figure 14 shows the distribution of the distances between pavement sections and their weather stations.
GIS software integrated the PMIS attribute table and weather station attribute table based on their spatial locations to create the final dataset (Figure 15). In that dataset, that each
pavement section record contains the section location, pavement distresses, traffic loading, and structural characteristics. Each pavement record also includes the average annual temperature, snowfall and rainfall amount, the number of freeze-thaw cycles for the nearest weather station, and the distance between each pavement segment and its closest weather station.
Figure 14. Distribution of the distances from pavement sections to the closest weather station
Figure 15. Final dataset format after integration of PMIS and IEM data
After integrating the data for years from 1998 through 2015, the climate data (i.e., temperature, snowfall, rainfall, and freeze-thaw cycles) were represented by GIS maps to
illustrate which pavement segments had experienced more extreme conditions. Figure16 shows the average annual temperature for the entire highway network in 2015, when the lowest average was recorded in Worth County in northern Iowa. The highest average temperature in 2015 was recorded in Polk County in the middle of the state around Des Moines.
Figure 16. Iowa average temperatures (2015)
The statewide average annual rainfall was higher in the southern part of the state (Figure 17) in 2015 when he largest amount of rain fell on Taylor County in southern Iowa. The
Figure 17. Average rainfall amount (in.) on Iowa highways (2015)
Figure 18 shows the higher amount of snow was in Clayton County in the northwest part of the state. Figure 19 illustrates the number of freeze-thaw cycles over the state when
temperatures fluctuated above and below freezing. In 2015, the most freeze-thaw cycles occurred in the southern and western parts of the state.
Figure 18. Average snowfall amount (in.) on Iowa highways (2015)
Performance Indicators
The Iowa DOT uses two pavement performance indicators to assess pavement conditions, the Pavement Condition Index (PCI) and the International Roughness Index (IRI). The PCI uses an objective scale ranging from 0 to 100 to quantify pavement conditions. PCI ratings fall into five categories very poor (0-20); poor (21-40); fair (41-60); good (61-80); and excellent (81-100). In 2015, more than 41.56% of miles in Iowa were in an excellent condition, 35.12% were in good condition, 18.83% were in fair condition, and the remaining were in poor or very poor condition (Figure 20). Figure 21 shows a GIS map of Iowa with the PCI for all Iowa highways.
Figure 21. PCI map of Iowa highways (2015)
The International Roughness Index (IRI) is obtained by measuring the longitudinal profile of a pavement. Pavements are classified as good (95 in./mile); fair (95–170 in./mile); or poor (>170 in./mile) condition. In 2015 in Iowa, 52.66% of highway miles were in good condition, 39% were in fair condition, and 8.31 % were in poor condition (Figure 22). Figure 23 is a map of the IRI measurements of Iowa highways in 2015.
Figure 22. Pavement roughness distribution of Iowa highways (2015)
Developing Pavement Performance Models
Two kinds of pavement performance models, traditional multiple linear regression (MLR) and artificial neural network (ANN) models were developed to study three pavement types with different pavement properties and different material properties. Goodness of fit is a common measure for evaluating model performance. Therefore, the coefficient of determination (R2) and root mean square error (RMSE) were utilized to measure and compare the performance of the models. Good prediction models should have a high R2 and a low RMSE. R2 values
represent the correlation between the actual and predicted values to determine the accuracy of the model (Rahman and Tardfer, 2017). R2 values range between 0 and 1 where 1 indicates that the actual and predicted values are in agreement and 0 indicates there is no relationship between them. RMSE values represent used measure the differences between predicted and actual values. R2 and RMSE values were determined using Equation 10 and Equation 11 respectively
n i i n i i i y y y y R 1 2 1 2 2 ˆ 1 (10)
n y y RMSE n i i i
2 ˆ (11) where𝑦𝑖 = actual value observation i;
𝑦̂ = predicted value of observation i;
𝑦̅ = average value of observation i; and n = number of observations.
Historical data was used on in both ANN and MLR models to predict individual distresses for three pavement types, ACC, PCC, and COM pavements. These individual
distresses were predicted based on weather factors (i.e., temperature, precipitation, and freeze-thaw cycles), traffic loading, pavement age, SN, layer thicknesses, and subgrade stiffness. By predicting individual distresses, decision makers can evaluate the individual distress for each pavement section, and determine which distress has more effect on the overall pavement condition.
These models were used to predict the individual distresses in ACC, PCC, and COM pavements. For ACC and COM pavements, three models were developed for predicting roughness, cracking, and rutting, and for PCC pavements, three models were developed for predicting roughness, cracking, and faulting. These predicted distresses were combined to
calculate the PCI values based on Equations 8 and 9 in order to represent the overall PCI over the years. The flowchart in Figure 24 illustrates the modeling process. To determine the reliability of ANN models, the results obtained from the ANN models were compared with the results from MLR models.
Figure 24. Flowchart of predicting PCI for ACC pavements
Stepwise analysis was used to determine factors that affect pavement conditions to remove any correlation between input variables by using JMP software. Stepwise analysis is the