NASA/TP-2004-212046
Flight Test Results for the F-16XL With a
Digital Flight Control System
Susan J. Stachowiak and John T. Bosworth NASA Dryden Flight Research Center Edwards, California
The NASA STI Program Office…in Profile Since its founding, NASA has been dedicated
to the advancement of aeronautics and space science. The NASA Scientific and Technical Information (STI) Program Office plays a key part in helping NASA maintain this
important role.
The NASA STI Program Office is operated by Langley Research Center, the lead center for NASA’s scientific and technical information. The NASA STI Program Office provides access to the NASA STI Database, the largest collection of aeronautical and space science STI in the world. The Program Office is also NASA’s institutional mechanism for disseminating the results of its research and development activities. These results are published by NASA in the NASA STI Report Series, which includes the following report types:
• TECHNICAL PUBLICATION. Reports of completed research or a major significant phase of research that present the results of NASA programs and include extensive data or theoretical analysis. Includes compilations of significant scientific and technical data and information deemed to be of continuing reference value. NASA’s counterpart of peer-reviewed formal professional papers but has less stringent limitations on manuscript length and extent of graphic presentations. • TECHNICAL MEMORANDUM. Scientific
and technical findings that are preliminary or of specialized interest, e.g., quick release reports, working papers, and bibliographies that contain minimal annotation. Does not contain extensive analysis.
• CONTRACTOR REPORT. Scientific and technical findings by NASA-sponsored contractors and grantees.
• CONFERENCE PUBLICATION.
Collected papers from scientific and technical conferences, symposia, seminars, or other meetings sponsored or cosponsored by NASA.
• SPECIAL PUBLICATION. Scientific, technical, or historical information from NASA programs, projects, and mission, often concerned with subjects having substantial public interest.
• TECHNICAL TRANSLATION. English- language translations of foreign scientific and technical material pertinent to
NASA’s mission.
Specialized services that complement the STI Program Office’s diverse offerings include creating custom thesauri, building customized databases, organizing and publishing research results…even providing videos.
For more information about the NASA STI Program Office, see the following:
• Access the NASA STI Program Home Page at http://www.sti.nasa.gov
• E-mail your question via the Internet to [email protected]
• Fax your question to the NASA Access Help Desk at (301) 621-0134
• Telephone the NASA Access Help Desk at (301) 621-0390
• Write to:
NASA Access Help Desk
NASA Center for AeroSpace Information 7121 Standard Drive
NASA/TP-2004-212046
Flight Test Results for the F-16XL With a
Digital Flight Control System
Susan J. Stachowiak and John T. Bosworth NASA Dryden Flight Research Center Edwards, California
March 2004
National Aeronautics and Space Administration
Dryden Flight Research Center Edwards, California 93523-0273
NOTICE
Use of trade names or names of manufacturers in this document does not constitute an official endorsement of such products or manufacturers, either expressed or implied, by the National Aeronautics and Space Administration.
Available from the following:
NASA Center for AeroSpace Information (CASI) National Technical Information Service (NTIS)
7121 Standard Drive 5285 Port Royal Road
Hanover, MD 21076-1320 Springfield, VA 22161-2171
(301) 621-0390 (703) 487-4650
CONTENTS
Page ABSTRACT . . . 1 NOMENCLATURE . . . 1 INTRODUCTION . . . 2 AIRPLANE DESCRIPTION . . . 3 MANEUVERS FLOWN . . . 5PILOT QUALITATIVE ASSESSMENT. . . 6
FLIGHT DATA ANALYSIS . . . 7
ROLL PERFORMANCE . . . 7
Roll Mode Time Constant . . . 8
Maximum Roll Rate and Time to Reach a 90° Bank Angle . . . 11
LONGITUDINAL RESULTS . . . 12
Fast Fourier Transform Analysis . . . 12
Lower Order Equivalent System . . . 14
Method . . . 15
Results. . . 16
Neal–Smith Criterion . . . 18
Method . . . 18
Results. . . 19
The Ralph–Smith Criterion . . . 22
Method . . . 22 Results. . . 22 Bandwidth Criterion. . . 23 Method . . . 23 Results. . . 25 CONCLUDING REMARKS . . . 26
APPENDIX A: DESCRIPTION OF HANDLING QUALITIES TASKS . . . 27
Normal Acceleration Captures. . . 27
Pitch Attitude Captures . . . 27
Bank Angle Captures . . . 27
Air-to-Air Tracking . . . 27
APPENDIX B: PILOT COMMENTS AND RATINGS FOR HANDLING QUALITIES TASKS. .29
Normal Acceleration Captures. . . 29
Flight Condition: Mach 0.6, 25K . . . 29
Flight Condition: Mach 0.9, 25K . . . 29
Pitch Attitude Captures . . . 29
Flight Condition: Mach 0.6, 25K . . . 29
Flight Condition: Mach 0.9, 25K . . . 30
Bank Angle Captures . . . 30
Flight Condition: Mach 0.6, 15K . . . 30
Flight Condition: Mach 0.9, 15K . . . 30
Flight Condition: Mach 0.6, 25K . . . 30
Flight Condition: Mach 0.8, 25K . . . 31
Flight Condition: Mach 0.9, 25K . . . 31
Flight Condition: 18° , 30K . . . 31
Air-to-Air Tracking . . . 31
Flight Condition: Mach 0.8, 10K . . . 31
Flight Condition: Mach 0.9, 10K . . . 32
Flight Condition: Mach 0.6, 15K . . . 32
Flight Condition: Mach 0.9, 15K . . . 32
Flight Condition: Mach 0.6, 25K . . . 32
Flight Condition: Mach 0.9, 25K . . . 32
Flight Condition: Mach 0.9, 25K . . . 33
Flight Condition: 250 KCAS, 15K . . . 33
Flight Condition: 280 KCAS, 15K . . . 33
Flight Condition: 350 KCAS, 15K . . . 33
Flight Condition: 400 KCAS, 15K . . . 33
Flight Condition: 11° , 15K, Powered Approach . . . 33
Close Trail Formation Flight . . . 34
Flight Condition: Mach 0.8, 10K . . . 34
Flight Condition: Mach 0.9, 10K . . . 34
Flight Condition: Mach 0.6, 15K . . . 34
Flight Condition: Mach 0.9, 15K . . . 34
Flight Condition: Mach 0.6, 25K . . . 34
Flight Condition: Mach 0.9, 25K . . . 35
Flight Condition: 280 KCAS, 15K . . . 35
REFERENCES . . . 36 α
TABLES
1. Pilot ratings given during formation flight tasks . . . 6
2. Pilot ratings given during air-to-air tracking tasks . . . 7
3. Longitudinal LOES results . . . 16
4. Results from Neal–Smith analysis . . . 21
FIGURES
1. F-16XL ship 1 takes off for the first flight using the digital flight control system . . . 32. F-16XL planview with key physical and geometric properties . . . 4
3. Flight envelope and limits for F-16XL ship 1 . . . 5
4. Time history method for and calculation . . . 8
5. Model used for and time history method validation . . . 9
6. Sample result of comparison between model and F-16XL flight data . . . 9
7. Roll mode time constant and effective time delay as a function of flight condition . . . 10
8. Roll mode time constant as a function of time delay . . . 10
9. Maximum roll rate versus velocity. . . 11
10. Time to roll to 90° bank angle as a function of velocity. . . 12
11. Typical frequency sweep time history . . . 13
12. Typical pitch rate to stick transfer function obtained from F-16XL flight data . . . 13
13. Sample pitch attitude to stick input transfer function from F-16XL flight data . . . 13
14. Pitch stick to pitch rate transfer function comparison for frequency sweeps at 1.0 g and 3.0 g. .14 15. Lα estimation method . . . 15
16. Typical LOES fit to flight data pitch rate transfer function . . . 16
17. LOES results: equivalent time delay as a function of flight condition . . . 17
18. LOES short period frequency estimates for the F-16XL . . . 17
19. Block diagram of the pitch attitude control loop used in Neal–Smith analysis . . . 18 τr τeff
20. Explanation of the Neal–Smith chart . . . 19
21. Compensated closed loop frequency response obtained using Neal–Smith method . . . 20
22. Neal–Smith results for the F-16XL. . . 20
23. Ralph–Smith method for a sample flight data transfer function. . . 22
24. Ralph–Smith results for the F-16XL as a function of Mach number . . . 23
25. Pitch attitude to stick input transfer function showing bandwidth calculation method . . . . 24
26. F-16XL bandwidth results with MIL-STD requirements, category A . . . 25
ABSTRACT
In the early 1980s, two F-16 airplanes were modified to extend the fuselage length and incorporate a large area delta wing planform. These two airplanes, designated the F-16XL, were designed by the General Dynamics Corporation (now Lockheed Martin Tactical Aircraft Systems) (Fort Worth, Texas) and were prototypes for a derivative fighter evaluation program conducted by the United States Air Force. Although the concept was never put into production, the F-16XL prototypes provided a unique planform for testing concepts in support of future high-speed supersonic transport aircraft. To extend the capabilities of this testbed vehicle the F-16XL ship 1 aircraft was upgraded with a digital flight control system. The added flexibility of a digital flight control system increases the versatility of this airplane as a testbed for aerodynamic research and investigation of advanced technologies. This report presents the handling qualities flight test results covering the envelope expansion of the F-16XL with the digital flight control system.
NOMENCLATURE
CHR Cooper–Harper rating
dep pitch stick input
DFLCS digital flight control system FFT fast Fourier transform
acceleration of gravity
HUD head-up display
K thousands of feet, altitude KCAS knots calibrated airspeed
LEF leading edge flaps
LOES lower order equivalent system dimensional lift curve slope, sec-1 MIL-STD military standard
normal load, g
PIO pilot induced oscillation specific excess power, ft/sec
q pitch rate, deg/sec
dynamic pressure, psi
S slope, dB
VCAS calibrated airspeed, kn true velocity, ft/sec
α angle of attack, deg
g Lα Nz Ps q VTRUE
ζe LOES equivalent damping
estimated time delay, sec, bandwidth criterion effective time delay, sec
LOES equivalent time delay, sec roll mode time constant, sec
Ralph–Smith phase angle at critical frequency, deg
phase value at twice the phase crossover frequency, rad/sec
bandwidth frequency from gain curve, rad/sec, bandwidth criterion bandwidth frequency from phase curve, rad/sec, bandwidth criterion Ralph–Smith critical frequency, rad/sec
LOES equivalent frequency, rad/sec
magnitude at phase crossover frequency, dB twice the phase crossover frequency, dB
INTRODUCTION
The F-16XL ship 1 aircraft was flown with a digital flight control system (DFLCS) for the first time in December 1997. The F-16XL has its origins in the early 1980s when the General Dynamics Corporation (Ft. Worth, Texas) (now Lockheed Martin Tactical Aircraft Systems (LMTAS)) developed a prototype concept for a derivative fighter evaluation program conducted by the Air Force between 1982 and 1985. The concept was to modify the existing F-16 design to extend the fuselage length and incorporate a large area delta wing planform. The resulting F-16XL had a greater range because of increased fuel capacity in the wing tanks, and a larger load capability because of increased wing area. Two airplanes were built and extensively flight-tested (ref. 1).
The F-16XL concept was never put into production, but the two prototypes provided a unique planform for testing technological concepts in support of future high speed aircraft, such as supersonic commercial transports. A passive wing glove was utilized to investigate the ability to achieve natural laminar flow through careful contouring of the wing surface (ref. 2). The feasibility of active laminar flow control using an internal suction system built into the wing (ref. 2) was investigated. Further support for future supersonic transport aircraft was provided by a sonic boom research project that used the F-16XL for airborne measurements of the propagation of an SR-71 sonic shock wave (ref. 3).
To extend the capabilities of this testbed vehicle F-16XL ship 1 was upgraded with a DFLCS. The DFLCS was designed by LMTAS and used hardware developed for the fleet F-16 digital upgrade (block 40).
The DFLCS flight envelope clearance program began in December 1997 and ended in March 1998. A total of ten flights were flown to collect maneuvering performance and handling qualities data. Conventional handling qualities analysis techniques were applied to the F-16XL flight data, and where possible results were compared with qualitative pilot assessments of the airplane handling qualities. This report summarizes the results obtained during these ten flights.
τ τeff τeq τr φc φ2ω 180 ωbg ωbp ωc ωe ω180 2ω180
AIRPLANE DESCRIPTION
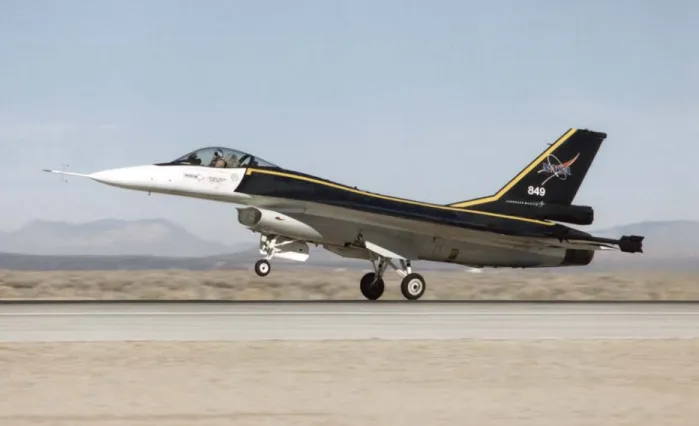
The F-16XL ship 1 aircraft is a modified F-16A and is shown in figure 1. This high performance, single seat airplane features a highly swept delta wing designed for sustained supersonic flight. Vehicle control is achieved by elevons and ailerons at the trailing edge of the wing, and a rudder mounted on the trailing edge of the single vertical stabilizer. Outboard leading edge flaps (LEF) are used as secondary control surfaces and are automatically scheduled with angle of attack (α) and Mach number. Figure 2 contains a summary of the physical properties of the airplane (ref. 4).
Figure 1. F-16XL ship 1 takes off for the first flight using the digital flight control system.
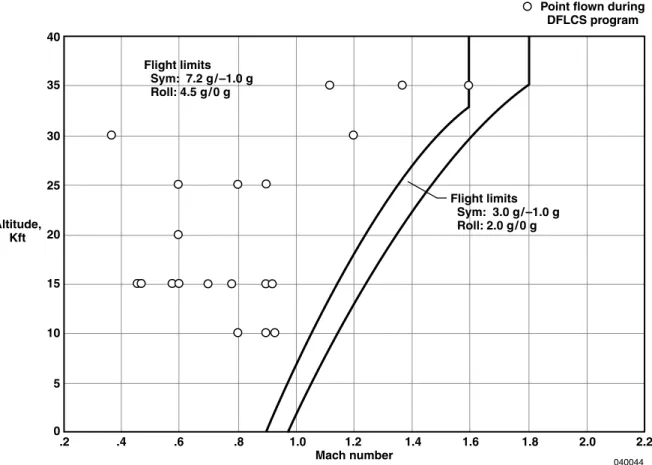
The F-16XL can operate at a Mach number as high as 2.0, an altitude as high as 60,000 ft, and under a load as high as 9.0 g. During this program, however, the airplane was operated under a limit of Mach 1.6 with a load limit of 7.2 g or Mach 1.8 with a restricted load limit of 3.0 g.
Figure 2. F-16XL planview with key physical and geometric properties.
Longitudinal and lateral pilot inputs to the control system are from a minimum displacement side stick controller. This is the same force command side stick that is used on the production F-16. More information on the F-16 side stick can be found in reference 5. The longitudinal control law is a blended pitch rate and normal acceleration command system. Desired longitudinal motion is achieved though symmetric deflection of the elevons and ailerons. Lateral stick inputs are translated into a limited roll rate command. The maximum allowable roll rate command can be reduced by placing the stores cockpit switch in the CAT III position. Desired lateral motion is achieved through asymmetric deflection of the
32 ft 4.9 in. Rudder
Area: 14.3 ft 2
Authority: 30 deg right, left Max. rate: 90 deg/sec
Vertical tail Area: 54.8 ft 2 Span: 101 in. Aspect ratio: 1.3
Leading edge sweep: 44.5 deg
54 ft 1.9 in. 17 ft 7 in.
Leading edge flap Area: 18.2 ft 2
Authority: 6.4 deg up, 36.5 deg down Max. rate: 31 deg/sec
Aileron Area: 29.4 ft 2
Authority: 20 deg up, 30 deg down Max. rate: 60 deg/sec
Elevon
Area: 44.1 ft 2
Authority: 30 deg up, down Max. rate: 60 deg/sec
Delta wing Area: 663.3 ft 2 Span: 388.9 in. Apect ratio: 1.6
Mean aerodynamic chord: 24.7 ft Inboard leading edge sweep: 70 deg Outboard leading edge sweep: 50 deg
ailerons and elevons. Leading edge flaps are used to augment lateral-directional stability at low speed flight conditions and to provide pitch trim and improved performance at higher speeds.
The basic F-16XL airplane was modified by replacing the obsolete analog computers with quadraplex-redundant production F-16 (block 40) digital flight control computers (DFLCCs). The F-16XL control laws were re-coded in the digital domain with a sample time of 64 cycles/sec. Other changes to the control laws included the addition of new, and modification of some existing, gains and filters. The existing electronic component assembly (ECA) was retained, but some of the functions it performed, including LEF scheduling, air data, and angle of attack functions, were moved to the DFLCC. More detailed information about the architecture and function of the DFLCS is given in reference 6.
MANEUVERS FLOWN
Ten flights were flown between December 1997 and March 1998 with the new DFLCS. The objective of these flights was to demonstrate adequate flying qualities and define a flight envelope for the F-16XL DFLCS. A variety of tasks were performed at flight conditions that included a Mach number as high as 1.6, an angle of attack as high as 18°, and altitude as high as 35,000 feet. Figure 3 shows selected test points used during the DFLCS program.
Figure 3. Flight envelope and limits for F-16XL ship 1.
Altitude, Kft 040044 0 5 10 15 20 25 30 35 40 1.2 1.4 1.6 1.8 2.0 2.2 1.0 .8 .6 .4 .2 Mach number
Point flown during DFLCS program Flight limits Sym: 3.0 g / –1.0 g Roll: 2.0 g / 0 g Flight limits Sym: 7.2 g / –1.0 g Roll: 4.5 g / 0 g
Doublets in all three axes, windup turns, –1.0 g pushovers, steady heading sideslips and 360° rolls were performed at most flight conditions. Pitch and roll frequency sweeps were also performed at most flight conditions, but due to control surface rate limiting, the roll frequency sweep data is unusable. Pilot comments and Cooper–Harper rating (CHR) were obtained for close trail formation flight and air-to-air tracking maneuvers in both up-and-away (UA) and powered approach (PA) configurations. Additional tasks included 180° over-the-top rolls, pitch, roll and normal acceleration captures, loaded rolls, and loaded roll reversals. Appendix A contains detailed task descriptions and the criteria used to assess the performance of the airplane for selected maneuvers.
Two new restrictions were placed on the airplane for the DFLCS program as a result of problems identified during piloted simulation. During testing, the simulator predicted an increase in roll rate of about 25 percent over the original analog system. Because sufficient instrumentation was not available to monitor the potential increase in structural loads, the vehicle was restricted to flying with a cockpit stores switch in the CAT III mode only. Engaging the CAT III switch reduces the maximum possible commanded roll rate by 75 deg/sec. With the CAT III switch engaged the digital control laws commanded less roll rate than the analog control laws. The simulation also identified a deficiency in the DFLCS control laws that allowed the airplane to exceed the 9.0 g limiter during aggressive maneuvering. The second restriction, which requires the airplane to be operated with the g-limiter set no higher than 7.2 g, was placed on the airplane to eliminate the potential to exceed the 9.0 g limit in flight.
PILOT QUALITATIVE ASSESSMENT
This section provides an overview of pilot opinion of the handling qualities of the F-16XL with the DFLCS. The CHR and pilot comments were obtained from two pilots for several handling qualities tasks. A summary of the pilot ratings for the 3.0 g tracking and formation flight tasks can be found in tables 1 and 2 respectively. A more detailed listing of the pilot ratings and comments is given in Appendix B.
Table 1. Pilot ratings given during formation flight tasks. Altitude, ft Mach number Steady state Reversal
10000 0.8 4 7
10000 0.9 4 6
15000 0.6 5 7
15000 0.9 4 7
In general, pilots gave favorable comments for the aircraft performance in the lateral axis during handling qualities maneuvers. Pilots also noted that the airplane with the DFLCS was “very similar to the analog aircraft.” Performance during lateral handling qualities tasks was typically rated as desired. Steady state performance during formation flight tasks was rated as adequate and given primarily level 2 CHR. Pilots also commented that adequate performance was not possible while executing reversals during formation flight tasks and typically gave level 3 CHR. During air-to-air tracking tasks, the airplane was given primarily level 2 ratings for gross acquisition and level 2 to level 3 ratings for fine tracking. Frequent references were made to a “pitch bobble.” This pitch bobble seemed to have the most negative effect during fine tracking, and was the main contributor to the “less than adequate” performance (level 3) ratings given by pilots at some flight conditions.
FLIGHT DATA ANALYSIS
Conventional handling qualities analysis techniques were applied to the F-16XL flight data. These techniques are generally empirical in nature and were developed using aircraft that utilized more conventional control stick dynamics. No corrections to the criteria are available to take into account the F-16XL side stick.
ROLL PERFORMANCE
Full stick, 360° rolls were performed at various altitudes and Mach numbers with the cockpit switch set to the CAT III configuration. From each of these rolls the maximum roll rate, roll mode time constant, effective time delay, and the time taken to reach a 90° bank angle were obtained. Results were compared with the criteria found in reference 7.
Table 2. Pilot ratings given during air-to-air tracking tasks. Altitude, ft Mach number Velocity, ft/sec Dynamic pressure, psi Gross acquisition Fine tracking 10000 0.80 449 653 4 7 10000 0.90 507 826 3 7 15000 0.60 304 301 6 7 15000 0.50 250 206 3 4 15000 0.69 350 395 2 3 15000 0.78 400 510 3 4 15000 0.90 465 678 4 7 25000 0.95 407 496 3 not given 25000 0.90 384 446 3 4 25000 0.60 248 198 not given 7
Roll Mode Time Constant
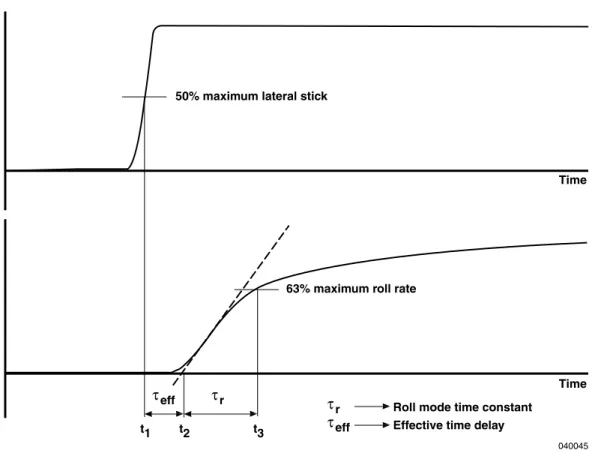
The roll mode time constant ( ) and effective time delay ( ) were found using the time history method show in figure 4. In this method, t1 is defined as the time when the lateral stick input reaches 50 percent of maximum value. A line representing the maximum slope of the roll rate is plotted; the time at which this line intersects the x-axis is denoted as t2. The roll rate reaches 63 percent of its maximum value at t3. The is the time difference between t2 and t1. The is the difference between t2 and t3.
Figure 4. Time history method for and calculation.
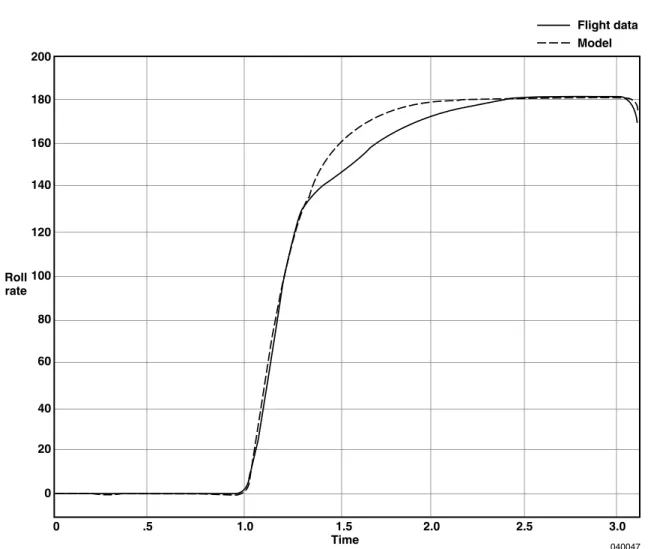
This method was validated using the model shown in figure 5. Full stick, 360° rolls from flight data were analyzed using the above method and the resulting and values were substituted into the model. Lateral stick measurements from flight data were used as input to the model. The model output and flight data roll rate were compared. A sample comparison is shown as figure 6. Although the flight data shows a higher order roll rate response, the model accurately reproduces the initial delay and roll rate onset.
τr τeff
τeff τr
50% maximum lateral stick
63% maximum roll rate
Time
Time
t1 t2 t3 τeff
τeff τr τ
r Roll mode time constant
Effective time delay
040045 τr τeff
Figure 5. Model used for and timehistory method validation.
Figure 6. Sample result of comparison between model and F-16XL flight data.
Stick input
Normalize stick input
Max
roll rate time delayEffective Roll rate
Transfer fcn 1
Max stick s + 1/tau1/tau
040046 τr τeff Roll rate 040047 80 200 180 160 140 120 100 60 40 20 0 1.5 0 .5 1.0 2.0 2.5 3.0 Time Flight data Model
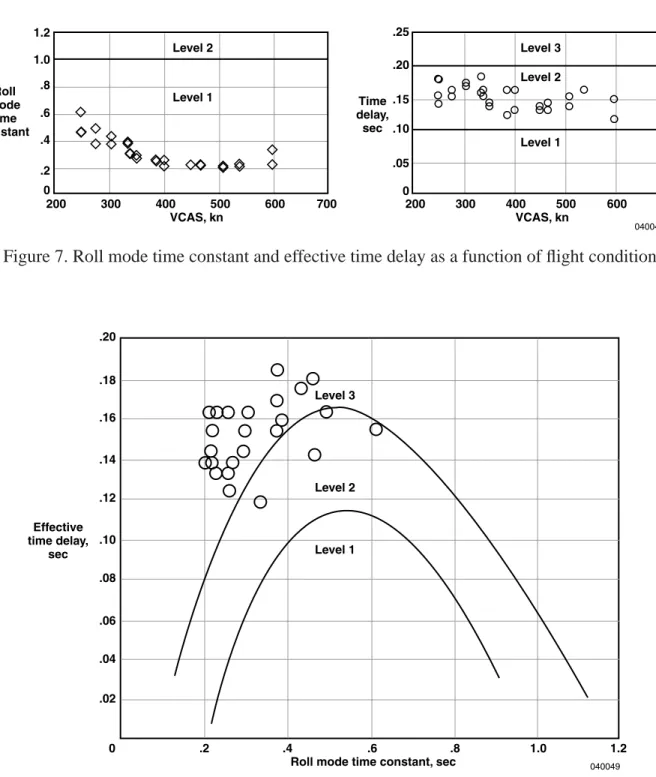
The roll mode time constants and effective time delays for the F-16XL with the DFLCS are shown in figure 7. The varied from 0.21 to 0.61. These values are predicted to produce level 1 handling qualities. The was approximately 0.15 and predicts level 2 handling qualities.
Figure 8 shows a plot of the versus (ref. 7). Most of the F-16XL data is in the level 3 region, due to low roll mode time constants and high time delays. As pilot comments indicate desirable performance in the lateral axis, this may indicate that the time delay boundaries are too restrictive.
Figure 7. Roll mode time constant and effective time delay as a function of flight condition.
Figure 8. Roll mode time constant as a function of time delay. τr τeff τeff τr Roll mode time constant 040048 1.2 Time delay, sec .25 .20 .15 .10 .05 0 1.0 .8 .6 .4 .2 0 400 500 600 700 200 300 400 500 600 700 300 200 VCAS, kn VCAS, kn Level 1 Level 2 Level 3 Level 2 Level 1 Effective time delay, sec .20 .18 .16 .14 .12 .10 .08 .06 .04 .02 .6 .8 1.0 1.2 .4 .2 0
Roll mode time constant, sec Level 3
Level 2
Level 1
Maximum Roll Rate and Time to Reach a 90° Bank Angle
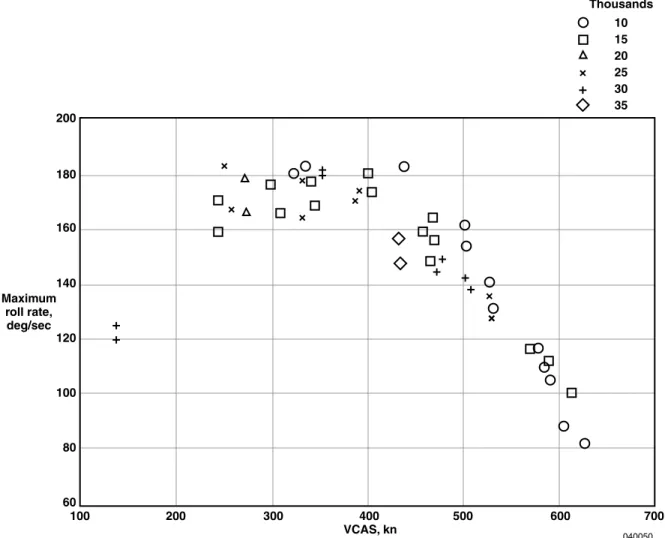
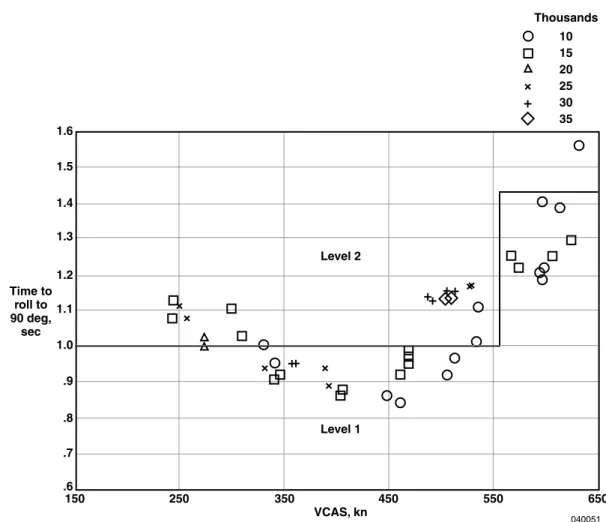
Figure 9 shows the maximum roll rate achieved by the DFLCS in the CAT III configuration during full stick rolls. Flying the airplane in conventional mode could increase the maximum roll rate by 75 deg/sec. The time to reach a 90° bank angle was measured and is plotted in figure 10 against the criteria found in reference 7. These results show a combination of level 1 and level 2 handling qualities, depending on flight conditions.
Figure 9. Maximum roll rate versus velocity.
Maximum roll rate, deg/sec 040050 200 180 160 140 120 100 80 60 400 300 200 100 500 600 700 VCAS, kn 10 15 20 25 30 35 Thousands
Figure 10. Time to roll to 90° bank angle as a function of velocity.
LONGITUDINAL RESULTS
Fast Fourier Transform Analysis
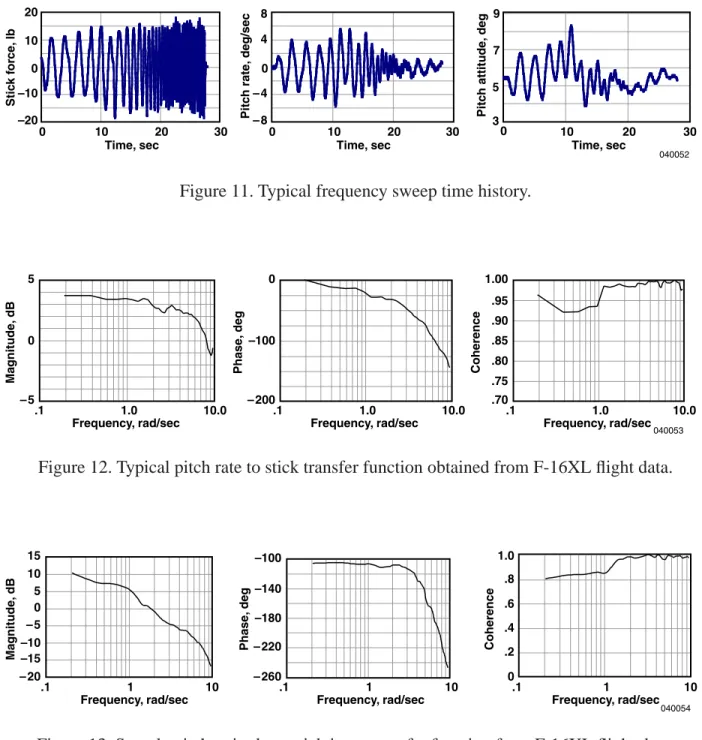
Many of the analysis methods presented in the “Longitudinal Results” section require aircraft frequency response data. This data was obtained from 30-sec pitch frequency sweeps performed by pilots at flight conditions throughout the F-16XL flight envelope. A fast Fourier transform (FFT) technique was used on this time history data to obtain either pitch rate to stick input transfer functions or pitch attitude to stick input transfer functions. The FFT used stick force in lb as input, and pitch rate in deg/sec or pitch attitude in deg as output. To avoid nonlinearities, the stick input measurement was taken after the stick shaping function. Figure 11 shows typical stick input, pitch rate, and pitch attitude time histories. Typical pitch rate to stick input and pitch attitude to stick input transfer functions are shown in figure 12 and figure 13 respectively. Time to roll to 90 deg, sec 040051 1.6 1.5 1.4 1.3 1.2 1.1 1.0 .9 .8 .7 .6 450 550 650 350 250 150 VCAS, kn Level 1 Level 2 10 15 20 25 30 35 Thousands
Figure 11. Typical frequency sweep time history.
Figure 12. Typical pitch rate to stick transfer function obtained from F-16XL flight data.
Figure 13. Sample pitch attitude to stick input transfer function from F-16XL flight data.
Flight data frequency sweeps were performed with the airplane trimmed for 1.0 g flight; however, results were typically compared with the pilot ratings and comments from 3.0 g tracking tasks. To justify the direct comparison between the two, some transfer functions from a 1.0 g flight condition were compared with those from a 3.0 g flight condition. As no frequency sweeps were performed at 3.0 g in flight, simulation data was used for this comparison. Pitch frequency sweeps were performed in the simulation for 1.0 g flight and repeated with the vehicle trimmed in a 3.0 g turn. Pitch rate transfer functions were obtained for both time histories. These transfer functions were nearly identical, as shown by the representative plot in figure 14.
Stic k for ce , lb 040052 20 10 0 0 5 3 –10 –20 Pitc h rate , deg/sec 8 4 – 4 – 8 Pitc h attitude , deg 9 7 10 20 30 0 Time, sec 10 20 30 0 Time, sec 10 20 30 0 Time, sec Ma gnitude , d B 040053 5 – 5 0 .1 1.0 10.0 Frequency, rad/sec .1 1.0 10.0 Frequency, rad/sec .1 1.0 10.0 Frequency, rad/sec Phase , deg 0 – 200 –100 Coherence 1.00 .70 .85 .95 .90 .80 .75 Ma gnitude , d B 040054 15 – 20 10 5 0 – 5 –10 –15 .1 1 10 .1 1 10 Frequency, rad/sec Frequency, rad/sec .1 1 10 Frequency, rad/sec Phase , deg – 260 –100 –140 –180 – 220 Coherence 1.0 .8 .6 .4 .2 0
Figure 14. Pitch stick to pitch rate transfer function comparison for frequency sweeps at 1.0 g and 3.0 g.
Lower Order Equivalent System
The lower order equivalent system (LOES) is a frequency response method used to reduce complex, higher order models of aircraft dynamics to a lower order form suitable for direct comparison with conventional flying qualities criteria. The LOES method was applied to F-16XL flight data for pitch rate to stick input transfer functions obtained from pilot initiated pitch frequency sweeps. Results were compared with the flying qualities criteria given in reference 7.
Phase, deg Magnitude, dB – 500 – 400 – 300 – 200 –100 0 100 – 60 – 70 – 50 – 40 – 30 – 20 –10 0 10 1 g 3 g 1.0 10.0 Frequency, rad/sec 100.0 .1 040055
Method
Pitch rate transfer functions were fit to a second order system of the form:
(1)
by minimizing the following cost equation:
(2)
For this analysis, the dimensional lift curve slope ( ) was held constant at a value estimated from flight data using:
(3)
The parameter, was calculated as the average slope of the versus a curve for the low frequency segment of the frequency sweep, as shown in figure 15. was taken to be the true airspeed of the vehicle at the start of the frequency sweep.
Figure 15. estimation method.
In general, LOES fits were performed on flight data over the range from 0.2 to 10 rad/sec. For some flight conditions, this frequency range was reduced because of poor coherence of the data. A typical LOES fit to a flight data pitch rate transfer function is shown in figure 16.
q(s) (s) K s L s q s dep = + + + − ( α) τ ε ζ ω ω e eq e e 2 2 2
Cost=(GainFlight−GainLOES)2+0 0175. (PhaseFlight−PhaseLOES)2 Lα Lα Nz( )g α(rad) ---g ft sec2 --- VTRUE ft sec --- ---× = Nz α --- Nz VTRUE 040056 4 2 6 8 .050 .055 .060 .065 .070 .075 .080 0 Time, sec
Data used in Nz/α estimation
α , deg 4.4 3.0 3.8 4.2 4.0 3.4 3.6 3.2 Nz ,g α, rad Nz/αdetermination Slope = Nz/α= 24.2 (g /rad) 1.3 .6 1.0 1.2 1.1 .8 .9 .7 Lα
Figure 16. Typical LOES fit to flight data pitch rate transfer function.
Results
LOES fits were attempted for each flight condition in which frequency sweep data was available. Some results, however, were discarded due to poor matches with flight data. Where acceptable fits could be obtained, the equivalent time delay, short period frequency, and short period damping were taken from the LOES model. Table 3 summarizes these results.
Table 3. Longitudinal LOES results.
Flight condition Altitude, ft Mach number Normal load per , g/rad Equivalent frequency, rad/sec Equivalent damping Equivalent time delay, sec Dimensional lift curve slope,
1/sec–1 1 10,000 0.81 30.30 2.81 1.35 0.18 1.16 2 15,000 0.47 9.98 1.52 1.25 0.19 0.65 3 15,000 0.60 14.51 1.36 1.36 0.18 0.77 4 15,000 0.60 12.91 1.54 1.34 0.18 0.67 5 15,000 0.70 18.74 1.73 1.70 0.18 0.83 6 15,000 0.78 24.16 2.48 1.78 0.18 0.95 7 20,000 0.60 10.64 1.10 1.72 0.17 0.55 8 25,000 0.60 10.15 0.97 1.54 0.19 0.54 9 25,000 0.80 12.85 1.34 1.46 0.18 0.51 040057 1 .1 10 Frequency, rad/sec LOES Flight Bound 1 .1 10 Frequency, rad/sec Ma gnitude , d B 20 – 10 5 15 10 0 – 5 Phase , deg 200 100 0 –100 – 200 α
Time delays ranged from 0.17 to 0.21 sec. As shown in figure 17, when compared with the handling qualities boundaries found in reference 7, these results are level 2. Damping values were between 1.20 and 2.03 and are also primarily level 2, also shown in figure 17. Estimated short period frequencies ranged from 0.97 to 2.85 rad/sec and typically increased with increasing . These short period frequencies predict level 2 to level 3 handling qualities when compared with the criteria found in reference 7, as shown in figure 18. Generally, these predictions are consistent with the level 2 to level 3 pilot rating given during the close trail formation flight and air-to-air tracking maneuvers. Based on the LOES short period frequency estimates, the data also predict an improvement in handling qualities as airplane speed increases. This trend was not seen in the actual pilot ratings or comments.
Figure 17. LOES results: equivalent time delay as a function of flight condition.
Figure 18. LOES short period frequency estimates for the F-16XL. q Time dela y , sec 040058 .05 .10 .15 .20 .25 4 3 2 1 0 5 6 7 8 9 10 11 Flight condition Level 3 Level 2 Level 1 Level 3 Level 2 Level 1 Damping .5 .7 .9 1.1 1.3 1.5 1.7 1.9 2.1 2.3 2.5 4 3 2 1 0 5 6 7 8 9 10 11 Flight condition ωe, rad/sec 040059 1 10 0 1 100 Level 3 Level 1 Level 2 Level 3 1 Nz/α, g /rad
Neal–Smith Criterion
The Neal–Smith criterion (ref. 8) is a method for estimating the handing qualities of fighter aircraft. This method was applied to F-16XL flight data for pitch attitude to stick input transfer functions obtained from pilot initiated pitch frequency sweeps.
Method
The Neal–Smith method (ref. 8) adds a pilot modeled as a simple compensator to the aircraft pitch attitude control loop, as shown in figure 19.
Figure 19: Block diagram of the pitch attitude control loop used in Neal–Smith analysis.
Compensator parameters are set to force the closed loop pilot/aircraft system to meet the following requirements:
• –90° phase at the bandwidth frequency.
• A minimum droop of –3 dB at or below the bandwidth frequency.
Once the compensator parameters are set, the maximum value of the compensated closed loop magnitude curve (above the bandwidth frequency) is found. This value is known as the resonance peak and is used as measure of pilot induced oscillation (PIO) tendency. The amount of pilot–compensator lead or lag required to meet the criterion is combined with the resonance peak value to determine a handling qualities level. Figure 20 shows the Neal–Smith level boundaries with typical pilot comments for each region of the chart.
The Neal–Smith method uses a bandwidth frequency to set the difficulty level of the task being performed. For the F-16XL flight data, the bandwidth frequency used during analysis was 3 rad/sec. The pilot time delay was 0.3 sec.
040060 Desired pitch attitude Pilot/compensator F-16XL aircraft plus control system Aircraft pitch attitude + Fs – Kpe–0.3s ττp1 s +1 p2 s + 1
Figure 20. Explanation of the Neal–Smith chart.
Results
The Neal–Smith method was applied to the F-16XL pitch attitude to stick input transfer functions. For most flight conditions, the flight data frequency range analyzed was 0.2 to 10 rad/sec. This range was reduced for some flight conditions due to poor coherence of the flight data. Figure 21 shows an example of the compensated closed loop response obtained using the Neal–Smith method.
Region E Resonance peak, dB 040061 14 12 10 8 6 4 2 0 20 10 30 40 50 60 70 80 90 – 40 – 30 – 20 –10 0 Region B CH rating 3.5 Region D Region C Region F CH rating 6.5 Region G Level 1 Level 2 Level 3
Lead compensation, deg
Pilot comments Region Level 1 A B C D E F G 2 2 2 3 3 3 Region A
Good responsive aircraft. Easy to acquire target.
Initial responses abrupt. Tendency to bobble on target. Have to fly it smoothly. Initial forces light, heavying up as response develops.
Tendency to oscillate or overshoot.
Initial response sluggish. Final response difficult to predict. Tendency to overcontrol or dig in. Have to overdrive it. Initial forces heavy, lightening up as response develops.
Abrupt response. Strong pilot induced oscillation tendencies. Have to fly it smoothly.
Strong pilot induced oscillation tendencies.
Sluggish response. Strong pilot induced oscillation tendencies. Have to overdrive it.
Figure 21. Compensated closed loop frequency response obtained using Neal–Smith method.
Table 4 summarizes the Neal–Smith handling qualities predictions for the F-16XL. The majority of the results were level 2, and fall into the region D area of the Neal–Smith chart, as shown in figure 22. Required pilot lead values ranged from 23 deg (supersonic) to 76 deg at the lowest condition. These results show an improvement in airplane handling qualities as speed increases. While this is consistent with the LOES results, this trend was not seen in the actual pilot ratings or comments. Neal–Smith analysis predicted level 1 handling qualities for most supersonic flight conditions. Unfortunately, no tracking or formation flight tasks were performed at supersonic flight conditions; therefore, there are no pilot opinions with which to compare these results. Although Neal–Smith predicts level 2 results, which is consistent with the rating given by pilots during the formation flight and air-to-air tracking maneuvers, the majority of the data fall into the region where excessive lead is required. These characteristics were not observed in the pilot comments, which indicated a consistent problem with pitch bobble.
Ma gnitude , d B 040062 10 8 6 4 2 – 6 0 – 2 – 4 10.0 1.0 .1 100.0 Frequency, rad/sec 10.0 1.0 .1 100.0 Frequency, rad/sec Phase , deg – 50 –100 –150 –200 0 q Resonance peak, dB 040063 12 10 8 6 4 2 0 30 40 50 60 70 20 80 90 –10 0 –20 – 30 10 Level 1 Level 2 Level 3
Table 4. Results from Neal–Smith analysis. Mach number Altitude, ft Lead, deg Peak, dB 0.81 10,000 39.24 2.01 0.92 10,000 51.84 2.21 0.93 10,000 44.83 2.09 0.46 15,000 76.89 5.43 0.47 15,000 62.55 1.92 0.58 15,000 73.36 4.99 0.59 15,000 74.61 3.27 0.65 15,000 46.69 1.94 0.65 15,000 59.48 3.48 0.69 15,000 41.42 1.49 0.69 15,000 63.21 1.99 0.92 15,000 39.85 2.02 0.60 20,000 70.00 2.00 0.80 25,000 60.59 1.97 0.91 25,000 34.26 4.01 1.20 30,000 31.89 1.97 1.11 35,000 27.41 1.90 1.34 35,000 29.11 1.94 1.61 35,000 23.44 3.98
The Ralph–Smith Criterion
The Ralph–Smith criterion estimates an average pilot CHR from the aircraft pitch attitude to stick force transfer function. This method was applied to the F-16XL flight data for all flight conditions where frequency sweep data was available.
Method
The Ralph–Smith method for estimating average pilot CHR is shown in figure 23. This method determines the slope (S) of the pitch attitude to stick force transfer function between one and six rad/sec in dB per octave. This slope is then used to determine the critical frequency ( ):
(4)
Finally, the phase angle at the critical frequency ( ) is found. This phase angle correlates with an average CHR.
Figure 23. Ralph–Smith method for a sample flight data transfer function.
Results
This method was applied to F-16XL for all flight conditions in which frequency sweep data was available. Results ranged from level 3 to level 1 as shown in figure 24, with ratings typically improving as Mach number increased. Predominantly level 1 handling qualities are predicted for supersonic flight
ωc ωc= +6 0 24. S φc Phase , deg Ma gnitude , d B 040064 –200 –150 –100 –20 –15 – 5 –10 0 5 10 15 –250 1.0 10.0 .1 Frequency, rad/sec Average CHR: 3.51 S = 7.2 dB/oct –200 –250 –150 –100 φc, deg φc = –130 deg ωc = 6 + 0.24S ωc = 4.3 rad/sec φc Cooper–Harper rating 2 1 3 4 5 6 7 8 9 10
conditions. These results are consistent with the trends found in both the Neal–Smith and LOES analysis results. This trend, however, was not substantiated by the pilot comments and ratings received during handling qualities tasks.
Figure 24. Ralph–Smith results for the F-16XL as a function of Mach number.
Bandwidth Criterion
The bandwidth criterion is a frequency response method used to predict aircraft handling qualities during tracking tasks. This method was applied to the F-16XL flight data for pitch attitude to stick input transfer functions obtained from pilot initiated pitch frequency sweeps.
Method
For this criterion, bandwidth is defined as the maximum frequency at which a pilot can aggressively perform tracking maneuvers without risking instability. The bandwidth criterion calculates this frequency from pitch attitude to stick input transfer functions using the following process:
Step 1: The magnitude value at the phase crossover frequency ( ) is found.
Step 2: The frequency at which the magnitude is 6 dB over the magnitude at the phase crossover frequency is found. This is the bandwidth frequency from the gain curve ( ).
Average Cooper–Harper rating 040065 10 9 8 7 6 5 4 3 2 1 .8 1.0 1.2 1.4 .6 .4 Level 1 Level 2 Level 3 Mach number ω180 ωbg
Step 3: The bandwidth from the phase curve ( ) is found. This is the frequency at which a 45° phase margin exists (phase = –135°).
Step 4: The bandwidth frequency is determined as the smaller of and .
This method of finding the bandwidth frequency is shown in figure 25.
Figure 25. Pitch attitude to stick input transfer function showing bandwidth calculation method.
The bandwidth frequency is combined with a time delay estimate to determine a handling qualities level. This time delay estimate is calculated from:
(5)
where is twice the phase crossover frequency, and is the phase value at twice the phase crossover frequency. The excessive delay indicated by the bandwidth criterion could be a contributor to the pitch bobble observed in pilot comment data.
ωbp ωbg ωbp Phase, deg Magnitude, dB 040066 15 10 5 0 – 5 –10 –15 – 20 –100 –120 –140 –160 –180 – 200 – 220 – 240 – 260 1.0 10.0 .1 45° ωbp ω180 ωbg ω180 6 dB Frequency, rad/sec τ φ ω ω =− + × 2 180 180 180 57 3. 2 2ω180 φ2ω 180
Results
The bandwidth method was applied to the F-16XL for all flight conditions in which frequency sweep data was available. For some flight conditions, however, the transfer function showed poor coherence around the estimated bandwidth frequency, or near the frequency used to estimate time delay. Results for these flight conditions are not presented.
Bandwidth frequencies ranged from 1.6 to 3.6 rad/sec. Time delays ranged from about 0.13 to 0.16 ms. These results are a combination of levels 2 and 3, as shown in figure 26. In general, both bandwidth frequency and estimated time delays increased with increasing . The bandwidth method predicts no improvement in airplane performance with increasing speed. Results show the airplane performance would be consistently near the level 2 to level 3 handling qualities border, regardless of flight conditions. These results are consistent with pilot ratings.
Figure 26. F-16XL bandwidth results with MIL-STD requirements, category A. q Time delay, sec 040067 .18 .16 .14 .12 .10 .08 .06 .04 .02 0 5 10 15 Level 1 Level 2 Increasing Qbar Level 3 Bandwidth, rad/sec
CONCLUDING REMARKS
The digital flight control system (DFLCS) flight envelope clearance program began in December 1997 and ended in March 1998. A total of ten flights were flown to collect maneuvering performance and handling qualities data. The flight envelope cleared to Mach 1.6 and an altitude of 40,000 ft with standard flight limits or Mach 1.8 and an altitude of 40,000 ft with restricted flight limits. Due to problems identified during piloted simulation studies, the vehicle was restricted to flying with a cockpit stores switch in the CAT III mode only and with the g-limiter set no higher than 7.2 g.
Pilot comments and Cooper–Harper ratings (CHR) were obtained for air-to-air tracking and close trail formation flight tasks at several subsonic flight conditions. Pilot comments during lateral handling qualities tasks were generally favorable. Frequent references, however, were made to a pitch bobble during longitudinal tasks. This pitch bobble degraded airplane performance during fine tracking and caused the pilots to give level 3 ratings at some flight conditions. Pilots also noted that adequate performance could not be obtained for reversals during close trail formation flight, and rated the airplane as level 3 for these tasks at some flight conditions.
Pitch and roll frequency sweep data was obtained at both subsonic and supersonic flight conditions. However, due to control surface rate limiting, the roll frequency sweep data was unusable. Conventional analysis techniques were applied to longitudinal frequency sweep data obtained during flight. Data analysis predicts level 2 to level 3 handling qualities, depending on flight conditions.
The Neal–Smith, Ralph–Smith, and lower order equivalent system (LOES) analysis methods predicted an improvement in handling qualities as airplane speed increases. This trend was not apparent in the actual pilot rating and comments. Both Neal–Smith and Ralph–Smith criterion predicted level 1 handling qualities for supersonic flight conditions. No pilot ratings were obtained at supersonic flight conditions; these results could not be verified. Bandwidth results showed the airplane near the level 2 to level 3 handling qualities border regardless of flight conditions. These results were largely due to the high estimated time delay of the F-16XL with the DFLCS.
The analysis techniques applied to F-16XL frequency sweep data were developed using more conventional stick dynamics, and no corrections were made to account for the F-16XL side stick force controller. This may explain some of the discrepancies between analysis results and actual pilot ratings and comments.
Dryden Flight Research Center
National Aeronautics and Space Administration Edwards, California
APPENDIX A
DESCRIPTION OF HANDLING QUALITIES TASKS
Normal Acceleration Captures
From 1.0 g trim conditions, the pilot performed an abrupt symmetric pull up to capture 2.0 g. Pilots also performed 3.0 g captures starting from 2.0 g windup turns. Pilots commented on the initial and final aircraft response, pitch and roll attitude performances, and stick forces using abrupt inputs.
Pitch Attitude Captures
From 1.0 g trim conditions, pilots captured 5° changes in pitch attitude using abrupt stick inputs. Pitch attitude captures were also performed using 2.0 g windup turns as the starting point. Pilots commented on the initial and final aircraft response and stick forces using abrupt inputs.
Bank Angle Captures
From 1.0 g trim conditions, the pilot captured target bank angles using full stick force. Target bank angles of ±30° and ±90° were captured starting from a 1.0 g trim reference point. Target bank angles of ±90° were also captured using 90° opposite bank as the starting point of the maneuver. Pilots commented on the initial and final aircraft response, roll attitude performances, and stick forces using abrupt inputs.
Air-to-Air Tracking
In this maneuver, the F-16XL attempts to track a target airplane from ranges of 1000 to 1500 feet. Once the F-16XL is in a position behind the target, the target airplane performs a 3.0 g turn. When the target airplane is about 30° off the nose, the F-16XL pilot acquires the target. With the target acquired, the F-16XL fine tracks the target for 2 to 3 seconds. The F-16XL then calls for target reversal with a repeat in the opposite direction. This task is repeated with random maneuvering of the target up to 3.0 g with unannounced reversals.
To achieve desired performance in gross acquisition, the pilot must be able to track the target within a 50 mm diameter on the pipper, with one overshoot and no PIO. Adequate performance required that the target be kept within 75 mm with two overshoots and no PIO. In fine tracking, desired performance kept the target within a ±10 mil diameter on the pipper for 2 sec without PIO. Adequate performance required ±20 mil without PIO.
Pilots commented on undesirable motions, predictability, aggressiveness effects and compensation techniques. Figure A-1 shows the CHR scale, which was used to rate both gross acquisition and fine tracking based on the desired and adequate performance margins.
Figure A-1. Cooper–Harper rating scale.
Close Trail Formation Flight
In this maneuver, the F-16XL follows the tail of the lead airplane with increasing aggressiveness though s-turn maneuvers. For initial evaluation, the lead airplane maneuvered up to 3.0 g. Desired performance required that both lateral and vertical displacement be kept within ±1 tailpipe diameter from the tailpipe without PIO. Adequate performance allowed for lateral and vertical displacements of ±2 tailpipe diameters without PIO.
Pilots evaluated response during steady state flight and during reversals. Cooper-Harper ratings were given for both gross acquisition and fine tracking based on the desired and adequate performance margins.
Excellent Highly desirable
Good
Negligible deficiencies
Fair – some mildly unpleasant deficiencies
Minor but annoying deficiencies
Moderately objectionable deficiencies
Very objectionable but tolerable deficiencies
Major deficiencies
Major deficiencies
Major deficiencies
Major deficiencies
Pilot compensation not a factor for desired performance
Pilot compensation not a factor for desired performance
Minimal pilot compensation required for desired performance
Desired performance requires moderate pilot compensation
Adequate performance requires considerable pilot compensation
Adequate performance requires extensive pilot compensation
Adequate performance not attainable with maximum tolerable pilot compensation. Controllability not in question
Considerable pilot compensation is required to control
Intense pilot compensation is required to retain control
Control will be lost during some portion of required operation Is it
satisfactory without improvement?
Is adequate performance attainable
with a tolerable pilot workload? Is it controllable? Deficiencies warrant improvement Deficiencies require improvement Improvement mandatory Pilot decisions 1 2 3 3 4 5 6 7 8 9 10 Yes
Adequacy for selected task or required operation*
Aircraft characteristics
Demands on the pilot in selected task or required operation*
Pilot rating Yes Yes No No No
* Definition of required operation involves designation of flight phase and/or subphases with accompanying conditions.
APPENDIX B
PILOT COMMENTS AND RATINGS FOR HANDLING QUALITIES TASKS
This appendix presents pilot comments and CHR for handling qualities tasks flown with the F-16XL during the DFLCS program. Some of the comments contained herein have been edited.Tasks performed include normal acceleration captures, pitch attitude captures, bank angle captures, air-to-air tracking, and close trail formation flight. Appendix A contains detailed descriptions of these tasks; the criteria used to assess performance for air-to-air tracking and close trail formation flight tasks are also included in Appendix A.
Normal Acceleration Captures
Flight Condition: Mach 0.6, 25K
2.0 g capture from wings level:
“Full abrupt stick input. Easy to capture. Bobbled to 1.7 g. Predictable.”
3.0 g capture from 2.0 g windup turn:
“Got right to 3 g with full aft stick. Easy to capture. Starting to bleed off—really can’t get much more than that.”
Flight Condition: Mach 0.9, 25K
2.0 g capture from wings level:“Expected faster initial acceleration at higher speed. Was still relatively easy to capture. I did spike it down to about 1.6 g, then recaptured the 2 g pretty well.”
3.0 g capture from 2.0 g windup turn:
“Spiked to 3.5 g. Eased off to capture 3 g. Good, predictable response.”
Pitch Attitude Captures
Flight Condition: Mach 0.6, 25K
5° pitch attitude capture from wings level:
“Trying to use abrupt inputs to really capture it. Three degree overshoot and a little bit of bobble as I settled in on it.”
5° pitch attitude capture from constant altitude 2.0 g windup turn:
Flight Condition: Mach 0.9, 25K
5° pitch attitude capture from wings level:“Negligible overshoot. Three quick half-degree bobbles. Predictable and good.”
5° pitch attitude capture from constant altitude 2.0 g windup turn:
“Using gyro in cockpit. Can’t use HUD. Response seems a bit quicker—maybe due to differences in gauges. Predictable.”
Bank Angle Captures
Flight Condition: Mach 0.6, 15K
30° bank angle captures from wings level:
“Nice response. Ten degree overshoot. Very easy.”
90° bank angle captures from wings level:
“Moderate roll mode time constant. Builds up gradually.”
Flight Condition: Mach 0.9, 15K
30° bank angle captures from wings level:“Much more abrupt roll response. On left capture, went to 40°, came back with another overshoot to 35°, then captured it nicely. Better on right—did not overshoot. Crisp roll response.”
90° bank angle captures from wings level:
“A little bit of bobble. Two small amplitude bobbles. Seems like a nice smooth response. Easy to capture.”
Flight Condition: Mach 0.6, 25K
30° bank angle captures from wings level:“One overshoot of about three degrees on left capture. Pretty easy to capture. Nice crisp, quick movement—easier than the simulator. Bigger overshoot on left capture—probably 10 to 12°, but came back with no overshoot to capture. A good crisp acceleration.”
90° bank angle captures from wings level:
“Nice acceleration. Easy to check with negligible overshoot. Kind of a smooth roll rate. Easy to capture.”
Flight Condition: Mach 0.8, 25K
90° bank angle captures from wings level:“Moderate roll rate. Easy to anticipate. Easy to lead. Minimum compensation.”
90° bank angle captures from 90° opposite bank:
“Fifteen degree overshoot on right capture. Performance right on limit of desired. Increased workload.”
Flight Condition: Mach 0.9, 25K
30° bank angle captures from wings level:“Nice acceleration. Spiked to just under 45° on left capture, then came back to 30° with no problems. Nice forces. Ten degree overshoot on right capture. Came back with a one to two degree overshoot then captured. Nice crisp response.”
90° bank angle captures from wings level:
“Slight ratcheting. Not quite as fast as expected. Starts off well, but steady state is slower than expected. Stuck around 70° then captured.”
Flight Condition: 18°
α, 30K
90° bank angle captures from wings level:
“Right—coupled with pitch. Adequate. A couple of oscillations. Slow roll rate.
Left—smooth and predictable—captured real well.”
90° bank angle captures from 90° opposite bank:
“Desired performance. No problems with pitch. Easy to anticipate.”
Air-to-Air Tracking
Flight Condition: Mach 0.8, 10K
“Desired performance on gross acquisition—nice response. Fine tracking not quite adequate. Pitch bobble—8 mils.”
Flight Condition: Mach 0.9, 10K
“Could get desired on gross acquisition—nice handling qualities. Couldn’t get adequate in fine tracking.”
CHR: gross acquisition — 3; fine tracking — 7.
Flight Condition: Mach 0.6, 15K
“No PIO tendency. Twenty mils edge twice during gross acquisition. Adequate performance not possible for fine tracking. Slight pitch bobble. No major deficiencies.”
CHR: gross acquisition — 6; fine tracking — 7.
Flight Condition: Mach 0.9, 15K
“Nice crisp performance on gross acquisition. Able to get it there without any overshoots. Desired. Right at ten mils or so. Real nice handling qualities for gross acquisition. Not quite adequate performance on fine tracking.”
CHR: gross acquisition
—
4; fine tracking—
7.Flight Condition: Mach 0.6, 25K
“Three g tracking task not doable at this flight condition. With full afterburner and full aft stick, it is just lagging. Can’t match target’s pitch rate. At 45° and full aft stick, can’t match target’s turn rate. Just continues to bleed. Have to go off the plane and cut across, and still can’t get the nose back to him.”
“Two g tracking—two overshoots on gross acquisition. Once to edge, once a couple of mils past. Not able to get adequate performance during fine tracking. Transitory, two to four mils off target. Cycles around target. No real PIO tendency.”
CHR: gross acquisition — none given; fine tracking
—
6 or 7.Flight Condition: Mach 0.9, 25K
“Crisper response. Able to get desired performance on gross acquisition. Could not keep adequate in fine tracking. Would be stable on exhaust and bobble to wingtip. In a period of ten seconds, a bobble put it out to almost twice the adequate performance level allowance.”
Flight Condition: Mach 0.9, 25K
“Desired performance on gross acquisition. Crisper response. Could not keep within desired for fine tracking. A bobble would put out to adequate performance.”
CHR: gross acquisition — 3; fine tracking — 4
Flight Condition: 250 KCAS, 15K
“Easy to get desired for gross acquisition—within 15 mils. Real smooth, some pitch bobble in fine tracking.”
CHR: gross acquisition — 3; fine tracking — 4.
Flight Condition: 280 KCAS, 15K
“PIO tendency in pitch axis. Similar to analog airplane—maybe better. Pitch bobble (four mils). Nice and stable.”
CHR: none given.
Flight Condition: 350 KCAS, 15K
“Easy, nice handling qualities, no overshoot in gross acquisition. Preferred speed range for fine tracking.”
CHR: gross acquisition — 2; fine tracking — 3.
Flight Condition: 400 KCAS, 15K
“Easy gross acquisition. Within 30 mils without overshoot. Most pitch bobble during fine tracking at this speed range. Seemed to decrease at other speeds.”
CHR: gross acquisition — 3; fine tracking — 4.
Flight Condition: 11°
α, 15K, Powered Approach
“Easy to get desired for gross acquisition. Some pitch bobble seen in fine tracking; no roll bobble. More pitch bobble with increased aggressiveness.
CHR: gross acquisition — 2; fine tracking — 3.
“Two overshoots in gross acquisition. Sensitive. Pitch heavier than roll. Energy low. Tendency to couple in roll — impacts predictability.”
“Nose seems to bobble. Pitch bobble—5 mils.”
CHR: gross acquisition — 3; fine tracking — 3.
Close Trail Formation Flight
Flight Condition: Mach 0.8, 10K
“Desired performance in steady state. Very nice handling qualities. Need to lag for quicker reverse. For slower reverse, can get adequate performance, but not desired.”
CHR: steady state — 4; reversals — 6.
Flight Condition: Mach 0.9, 10K
No comments.CHR: steady state — 4; reversals — 7.
Flight Condition: Mach 0.6, 15K
“Able to maintain adequate performance steady state. Adequate performance not possible for reversals.”
CHR: steady state — 5; reversals — 7.
Flight Condition: Mach 0.9, 15K
“Able to maintain desired performance for the majority of the time in steady state. For a number of seconds after a reversal, unable to maintain adequate. Probably five or more diameters away.”
CHR: steady state — 4; reversals — 7.
Flight Condition: Mach 0.6, 25K
“Can get desired performance in steady state for both longitudinal and lateral–directional. Any movement puts me to adequate, or not even adequate, even if he is calling the reversals. We can’t match the Ps, so we start drifting back. Difficult to evaluate at greater ranges.”
Flight Condition: Mach 0.9, 25K
“Noticed a couple of PIO bobbles that were outside of adequate then got settled out. Not the most predictable thing. Could have mainly desired for an extended period of time, then have adequate, or not even adequate performance for straight and level flight. Relatively predictable and able to meet adequate the majority of the time in turns.”
CHR: none given.
Flight Condition: 280 KCAS, 15K
“Control harmony good. Can see difference between pitch and roll. Adequate. Very similar to analog aircraft. No tendency roll–ratchet. Six to seven mil cycling in pitch.”
REFERENCES
1. Talty, Patrick K. and Donald J. Caughlin, “F-16XL Demonstrates New Capabilities in Flight Test at Edwards Air Force Base,” Journal of Aircraft, vol. 25, no. 3, March 1988, pp. 206–215.
2. Anderson, Bianca T. and Marta Bohn-Meyer, Overview of Supersonic Laminar Flow Control Research on the F-16XL Ships 1 and 2, NASA TM-104257, 1992.
3. Haering, Edward A., Jr., L. J. Ehernberger, and Stephen A. Whitmore, Preliminary Airborne Measurements for the SR-71 Sonic Boom Propagation Experiment, NASA TM-104307, 1995.
4. Voracek, David F., Ground Vibration and Flight Flutter Tests of the Single-Seat F-16XL Aircraft With a Modified Wing, NASA TM-104264, 1993.
5. Smith, John W. and Terry Montgomery, Biomechanically Induced and Controller Coupled Oscillations Experienced on the F-16XL Aircraft During Rolling Maneuvers, NASA TM-4752, 1996.
6. Jones, S. E. and N. S. Yakzan, F-16XL Digital Flight Control System Handling Qualities Analysis Report, 72PR206, February 1997.
7. U.S. Air Force, Flying Qualities of Piloted Vehicles, MIL-STD-1797, March 31, 1987.
8. Bailey, R. E. and R. E. Smith, “Analysis of Augmented Aircraft Flying Qualities Through Application of the Neal–Smith Criterion,” AIAA 81-1776, August 1981.
9. Cooper, George E. and Robert P. Harper, Jr., The Use of Pilot Rating in the Evaluation of Aircraft Handling Qualities, NASA TN D-5153, 1969.
10. Cox, Timothy H. and Bruce G. Powers, Flying Qualities Experience With the X-29A Aircraft, NASA TP-3340, 1993.
11. Hodgkinson, J. and W. J. Lamanna, “Equivalent System Approaches to Handling Qualities Analysis and Design Problems of Augmented Aircraft,” AIAA 77-1122, August 1977.
12. Hodgkinson, J., “Equivalent Systems Criteria for Handling Qualities of Military Aircraft,” Criteria for Handling Qualities of Military Aircraft, AGARD-CP-333, April 1982.
13. Hodgkinson, John, Aircraft Handling Qualities, American Institute of Aeronautics and Astronautics, Inc., Reston, Virginia, 1999.
14. Hoh, R. H., David G. Mitchell, and John Hodgkinson, “Bandwidth: A Criterion for Highly Augmented Airplanes,” Criteria for Handling Qualities of Military Aircraft, AGARD-CP-333, April 1982.
15. Monagan, Stephen J., Rogers E. Smith, and Randall E. Bailey, Lateral Flying Qualities of Highly Augmented Fighter Aircraft, AFWAL-TR-81-3171, vol. 1, Air Force Wright Aeronautical Laboratories, Wright-Patterson Air Force Base, Ohio, June 1982.
16. Smith, R. H. and N. D. Geddes, Handling Quality Requirements for Advanced Aircraft Design Longitudinal Mode; Final Report, AFFDL-TR-78-154, Air Force Flight Dynamics Laboratory, Wright-Patterson Air Force Base, Ohio, August 1979.
17. Smith, Ralph H., A Theory for Longitudinal Short-period Pilot Induced Oscillations, AFFDL-TR-77-57, Air Force Flight Dynamics Laboratory, Wright-Patterson Air Force Base, Ohio, April 1977.
18. Stoliker, Patrick C. and John T. Bosworth, Evaluation of High-Angle of-Attack Handling Qualities for the X-31A Using Standard Evaluation Maneuvers, NASA TM-104322, 1996.
19. Stoliker, P. C., High-Angle-of-Attack Handling Qualities Predictions and Criteria Evaluation for the X-31A, NASA TM-4758, 1997.
REPORT DOCUMENTATION PAGE
Form ApprovedOMB No. 0704-0188Public reporting burden for this collection of information is estimated to average 1 hour per response, including the time for reviewing instructions, searching existing data sources, gathering and maintaining the data needed, and completing and reviewing the collection of information. Send comments regarding this burden estimate or any other aspect of this collection of information, including suggestions for reducing this burden, to Washington Headquarters Services, Directorate for Information Operations and Reports, 1215 Jefferson Davis Highway, Suite 1204, Arlington, VA 22202-4302, and to the Office of Management and Budget, Paperwork Reduction Project (0704-0188), Washington, DC 20503.
1. AGENCY USE ONLY (Leave blank) 2. REPORT DATE 3. REPORT TYPE AND DATES COVERED
4. TITLE AND SUBTITLE 5. FUNDING NUMBERS
6. AUTHOR(S)
8. PERFORMING ORGANIZATION REPORT NUMBER
7. PERFORMING ORGANIZATION NAME(S) AND ADDRESS(ES)
9. SPONSORING/MONITORING AGENCY NAME(S) AND ADDRESS(ES) 10. SPONSORING/MONITORING
AGENCY REPORT NUMBER
11. SUPPLEMENTARY NOTES
12a. DISTRIBUTION/AVAILABILITY STATEMENT 12b. DISTRIBUTION CODE
13. ABSTRACT (Maximum 200 words)
14. SUBJECT TERMS 15. NUMBER OF PAGES
16. PRICE CODE 17. SECURITY CLASSIFICATION OF REPORT 18. SECURITY CLASSIFICATION OF THIS PAGE 19. SECURITY CLASSIFICATION OF ABSTRACT 20. LIMITATION OF ABSTRACT Flight Test Results for the F-16XL With a Digital Flight Control Sys