Internet Banking: Developments and Prospects
Karen Furst, William W. Lang, and Daniel E. Nolle
Economic and Policy Analysis Working Paper 2000-9 September 2000
Internet Banking: Developments and Prospects Karen Furst, William W. Lang, and Daniel E. Nolle
Office of the Comptroller of the Currency Economic and Policy Analysis Working Paper 2000-9
September 2000
Abstract: This paper addresses significant gaps in existing knowledge about the Internet banking landscape. Using information drawn from a survey of national bank examiners, we find that while only 20 percent of national banks offered Internet banking in Q3 1999, these transactional Internet banks accounted for almost 90 percent of national banking system assets and 84 percent of the total number of small deposit accounts. All of the largest national banks offered Internet banking, but only about 7 percent of the smallest banks offered it. Among institutions offering Internet banking, large banks are more likely than small banks to offer a broad range of services on the Internet. Matching call report data to the examiner survey information, we also find that banks in all size categories offering Internet banking tend to rely less on interest-yielding activities and deposits than do non-Internet banks, and institutions with Internet banking outperformed non-Internet banks in terms of profitability. Excepted from the superior performance of Internet banks versus non-Internet banks are de novo Internet banks, which were less profitable and less efficient than non-Internet de novos. Projections based on banks’ plans as of Q3 1999 indicate that 45 percent of all national banks will be offering Internet banking by the beginning of 2001. While most of the growth in new Internet banking will be due to small banks coming online, almost half of all national banks had no plans to offer Internet banking. Large banks have more aggressive plans to offer business Internet banking services in the future than small institutions.
We develop logit models to explain why banks choose to adopt Internet banking, and why some choose to offer a relatively wider array of Internet banking products and services. Among the key factors explaining which banks have chosen to offer Internet banking are membership in a bank holding company, physical location of the bank in an urban area, relatively higher premises and other fixed expenses to net operating revenue, and higher noninterest income, and efficiency than non-Internet banks. More profitable banks were more likely to adopt Internet banking after Q2 1998, but more profitable institutions were less likely to be among the “first movers” - i.e. banks adopting Internet banking as of Q2 1998. Among banks that offer Internet banking, larger banks and banks that offered the service for a longer time were significantly more likely to offer a wider range of services on the Internet.
The views expressed in this paper are those of the authors alone, and do not necessarily reflect those of the Office of the Comptroller of the Currency or the Department of the Treasury. The authors wish to thank Bernard Locey for his help, Steve Egli for research assistance, and Frank Dwyer for editorial assistance. We also thank Gary Whalen, Bob DeYoung, Mark Flannery, and Jim Barth for insightful comments.
Please address correspondence to Daniel E. Nolle, Senior Financial Economist, Policy Analysis Division, Office of the Comptroller of the Currency, 250 E. Street, S.W., Washington, DC 20219 (phone: 202-874-4442; e-mail: [email protected]).
I. Introduction
Banking over the Internet has attracted increasing attention from bankers and other financial services industry participants, the business press, regulators, and law makers, both in the United States and other countries. Among the reasons for Internet banking’s audience are the notion that electronic banking and payments will grow rapidly, more or less in tandem with proliferating electronic commerce; industry projections that Internet banking will cut banks’ costs, increase banks’ revenue growth, and make banking more convenient for customers; and some vexing public policy issues. Despite this attention, there is a dearth of systematic
information on the nature and scope of Internet banking. Bankers and public policymakers alike have had to plan using largely anecdotal evidence and conjecture.
The main purpose of this paper is to help fill significant gaps in existing knowledge about the Internet banking landscape. We use the term “Internet bank” to mean a bank offering its customers the ability to transact business with the bank over the Internet.1 Using information drawn from a survey of national bank examiners, we present data on the number of national banks offering Internet banking and the products and services being offered. We also use the survey’s results to project how much Internet banking will have grown by the beginning of 2001. In addition, using univariate statistical analysis, we investigate the profile of national banks offering Internet banking relative to other national banks with respect to profitability, cost efficiency, and other characteristics. We separately examine de novo national banks to investigate the extent to which new entrants are embracing Internet banking technology to a different degree than existing banks. We then develop and test empirical models explain why
1 We do not confine the term to Internet-only or “virtual” banks. Customer transactions on the Internet can be as simple as online balance inquiry or credit application, but can also include such services as electronic bill
presentment, insurance, and brokerage. “Non-Internet banks” refer to banks that do not offer transactional Internet banking, even if they have a Web site.
banks choose to adopt Internet banking, and why some choose to offer a relatively wider array of Internet banking products and services.
Our main findings are:
! Only 20 percent of national banks offered Internet banking in Q3 1999. However, as a group, these “Internet banks” accounted for almost 90 percent of national banking system assets and 84 percent of the total number of small deposit accounts.
! All of the largest national banks offered Internet banking, but only about 7 percent of the smallest banks offered it. Among institutions offering Internet banking, large banks are more likely than small banks to offer a broad range of services on the Internet.
! Banks in all size categories offering Internet banking tend to rely less on interest-yielding activities and deposits than do non-Internet banks.
! Institutions with Internet banking outperformed non-Internet banks in terms of profitability. It is likely that the more aggressive business posture of these banks explains both their relatively higher profitability and their decision to offer Internet banking.
! Excepted from the superior performance of Internet banks versus non-Internet banks are de novo Internet banks. Such de novos were less profitable and less efficient than non-Internet
de novos.
! Among the key bank characteristics explaining which banks have chosen to offer Internet banking are membership in a bank holding company, physical location of the bank in an urban area, relatively higher premises and other fixed expenses to net operating revenue, and higher noninterest income, and efficiency than non-Internet banks. More profitable banks were more likely to adopt Internet banking after Q2 1998, but more profitable institutions were less likely to be among the “first movers” - i.e. banks adopting Internet banking as of Q2 1998.
! Among banks that offer Internet banking, larger banks and banks that offered the service for a longer time were significantly more likely to offer a wider range of services on the Internet. Large banks have more aggressive plans to offer business Internet banking services in the future than small institutions.
! Projections based on banks’ plans as of Q3 1999 indicate that 45 percent of all national banks will be offering Internet banking by the beginning of 2001. Those banks will account for 95 percent of the assets and 93 percent of the small deposit accounts at national banks.
! While most of the growth in new Internet banking will be due to small banks coming online, almost half of all national banks had no plans to offer Internet banking. The large majority of those are small institutions.
! Customer use of Internet banking is disproportionately concentrated among a few large banks. Based on analysis of data from private sector studies, we estimate that the five banks with the greatest number of online customers account for almost 36 percent of all Internet banking users. By comparison, these same five banks account for only 20 percent of small deposit accounts.
Section II of this paper defines Internet banking and provides context for our analysis. Section III describes our database and specifies the number and size distribution of national banks offering Internet banking. That section also outlines the nature of Internet banking products and services offered by national banks. Section IV compares the structure and
performance of banks offering Internet banking with other banks. Section V develops and tests logit models of factors explaining why banks offer Internet banking, as well as factors explaining which Internet banks offer a wide range of Internet banking services. Section VI projects how much Internet banking will have grown by the beginning of 2001 based on the stated plans of national banks. That section also discusses current and potential future demand for Internet banking using bank and industry estimates of customer use. The concluding section summarizes our major findings.
II. Internet banking: definitions and background
Internet banking refers to the use of the Internet as a remote delivery channel for banking services. Such services include traditional ones, such as opening a deposit account or
transferring funds among different accounts, and new banking services, such as electronic bill presentment and payment (allowing customers to receive and pay bills on a bank’s Web site).
Banks offer Internet banking in two main ways. An existing bank with physical offices can establish a Web site and offer Internet banking to its customers as an addition to its
traditional delivery channels. A second alternative is to establish a “virtual,” “branchless,” or “Internet-only” bank. The computer server that lies at the heart of a virtual bank may be housed
in an office that serves as the legal address of such a bank, or at some other location. Virtual banks may offer their customers the ability to make deposits and withdraw funds via ATMs or other remote delivery channels owned by other institutions.
To date, it has been difficult to assemble comprehensive information on the Internet banking activities of commercial banks in the United States. This is because there are no special reporting requirements for Internet banks, and hence there is no regularly compiled set of data about banks’ Internet activity.2 Although two recent studies have estimated the number of banks offering Internet banking and described some of these banks’ characteristics, the studies relied on sampling methods for a banking industry profile rather than an actual count of banks.3 To our knowledge, prior to the current study, only Egland, Furst, Nolle, and Robertson (1998) provide both an actual count of banks offering Internet banking and an analysis of major structure and performance characteristics of these banks.4
With this in mind, Figure 1 approximates the “supply” of Internet banking from the end of 1997 through the end of 1999. During that time, according to estimates by the FDIC, as well as Couch and Parker (2000), the number of banks and thrifts with Web sites more than doubled from approximately 1500 to 3500; by year-end 1999, approximately one-third of the 10,000 U.S.
2 Banks are also not required to report information about other delivery channels, such as ATMs and telephone banking. Note that beginning in 1999 the OTS has required prior notice for federally chartered thrifts, and in the third quarter of 1999 a line was added to the call report for all banks and thrifts to report their URL.
3 See United States General Accounting Office (1998) and the Board of Governors of the Federal Reserve System, Federal Deposit Insurance Corporation, Office of the Comptroller of the Currency, and the Office of Thrift Supervision (1999) (henceforth referred to as the “Interagency Web Site Privacy Report”).
4 As Egland, Furst, Nolle, and Roberston (1998) explain, there is an element of estimation even in that study. This is because a single Web site may cover more than one bank that is a member of a multibank holding company. As a consequence, the authors distinguish between the number of Web sites and banks covered by those Web sites. See Egland, Furst, Nolle, and Robertson (1998), footnote 5.
banks and thrifts had Web sites. Approximately 1,100 of those Web sites were transactional, i.e., they allowed customers to conduct business online. The remainder were information-only sites.5
While “virtual banks” have generated considerable attention in the press and within the banking industry, at the beginning of 2000 only nine separately chartered banks were Internet-only. Virtual banks can be established in several ways. New investors in the banking industry obtain charters from state or federal supervisory authorities to establish new, independent virtual banks. Alternatively, existing banking companies create virtual banks as separately capitalized subsidiary banks of a bank holding company. A third route that is beginning to be pursued by investors is to purchase the existing charter of a traditional bank, and then to recast the bank as a virtual bank under the existing charter.
5 In Q2 1998, Egland, Furst, Nolle and Robertson (1998) found that 223 Web sites represented 374 banks.
Extrapolating from this ratio of 1.68 banks-per-banking company Web site, 18 percent of banks and thrifts offered true Internet banking as 2000 began.
F i g u r e 1 — E s t i m a t e d b a n k a n d t h r i f t W e b s i t e s , a n d t r a n s a c t i o n a l I n t e r n e t b a n k i n g W e b s i t e s 1 , 5 0 0 1 0 3 * 1 , 8 0 0 2 5 8 * 2 , 0 0 0 3 5 0 2 , 2 0 0 6 5 0 3 , 5 0 0 1 , 1 0 0 0 5 0 0 1 , 0 0 0 1 , 5 0 0 2 , 0 0 0 2 , 5 0 0 3 , 0 0 0 3 , 5 0 0 Q 4 - 9 7 Q 2 - 9 8 Q 4 - 9 8 Q 2 - 9 9 Q 4 - 9 9 A l l W e b s i t e s T r a n s a c t i o n a l W e b s i t e s S o u r c e : O f f i c e o f t h e C o m p t r o ll e r o f t h e C u r r e n c y u s i n g d a ta f r o m t h e F D I C , C o u c h a n d P a r k e r ( 2 0 0 0 ) , a n d b a n k a n d t h r i f t W e b s it e s * A c t u a l .
As an alternative to seeking a separate charter for an Internet-only bank, “trade-name” Internet banks have been established as separate divisions of an existing bank.6 At the beginning of 2000, there were roughly twenty name virtual “banks” in the United States. A trade-name virtual bank typically operates independent of the rest of the bank in terms of staffing, marketing, and integration of computer systems into the existing bank’s legacy systems. This corporate strategy arises out of the desires to capture the perceived advantages of a virtual bank’s operating style, and to project a fresh image that will attract new customers. But both trade-name and separately chartered virtual banks may find it difficult to attract and retain customers unless they give the bank some physical presence such as kiosks or limited service offices.7 Such a “clicks and bricks” approach could emerge as a popular way of offering Internet banking.8
III. Internet banking in the national banking system The data set
The data set for the current study is unique in a number of respects. First, it covers the Internet banking offerings of every national bank. That information was compiled based on responses to a questionnaire OCC examiners completed between August and
6 For business press accounts of Internet-only banks, including trade-name banks such as WingSpanBank.com, see Hallerman (1999a), Costanzo and Senior (1999), Daudelin (2000), Financial Service Online (2000), Giesen (2000), and O’Sullivan (2000 a and b).
7
See O’Sullivan (2000b) and Costanzo (2000) for discussions of the difficulties virtual banks face in the marketplace. O’Sullivan (2000b) reports on research evaluating the performance of virtual banks relative to traditional banks offering Internet banking. See also Bank Technology News (2000), which compares studies by CheckFree Corp. and GartnerGroup showing that consumers wishing to engage in electronic billing have a
significantly stronger preference for dealing with a bank with a physical presence rather than an Internet-only bank. See also Financial Service Online (1999), Bank Network News (2000), Day (2000), and Toonkel (2000b) on this issue.
8 The strategy of moving away from an Internet-only strategy is receiving attention in businesses besides banking. See, for example, McIntyre and Christensen (1999), and Hamilton (2000).
September 1999 for 2,535 national banks. The questionnaire covered whether a bank had a Web site and, if so, whether the Web site was transactional. For banks with transactional sites,
examiners provided a more detailed set of information on the nature of their sites, including information on the range of products offered. Examiners also answered questions about banks’ plans for offering Internet banking in the future.
We matched the examiner-response data with financial data for the 2,517 national banks that filed a third quarter 1999 Report of Condition and Income (the “call report”), and we added banking structure data from the OCC’s Integrated Banking Information System database. In addition, we included supervisory information on banks’ CAMELS ratings, as well as on their information technology (IT) practices. While our data set is confined to national banks, we believe it is broadly applicable to the banking system at large.9
Number and size distribution of Internet national banks
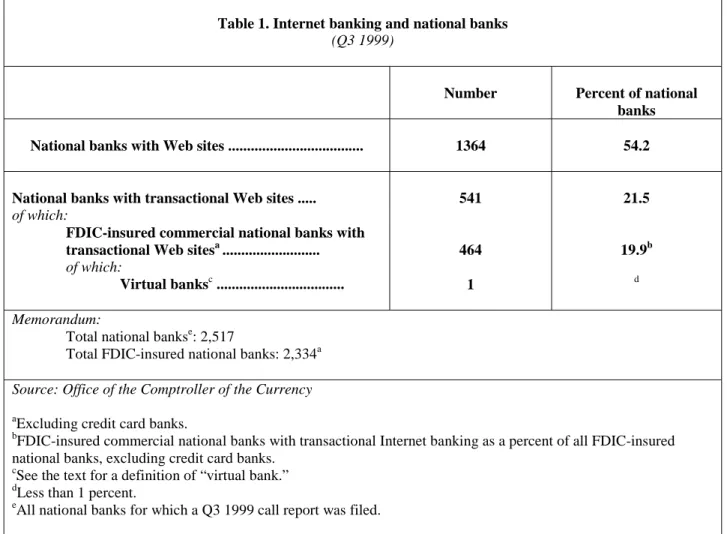
Based on daily articles in the business press, one might easily conclude that most banks offer Internet banking.10 In fact, as Table 1 shows, while slightly more than half of all national banks had Web sites in the third quarter of 1999, only 464 national banks — just under 20 percent of all FDIC-insured national banks — offered transactional Internet banking to their customers.11
9
As of the third quarter of 1999, national banks accounted for 28 percent of all banks and 59 percent of all banking system assets. On average, national banks are larger than state banks. But national banks are widely distributed across asset size categories, and they exhibit the same performance characteristics as state banks of like size.
Egland, Furst, Nolle, and Robertson (1998) found no evidence of significant differences in the structural attributes of national and state banks offering Internet banking.
10 For example, during the week of March 20, 40 percent of the articles in the American Banker dealt with Internet banking.
Table 1. Internet banking and national banks (Q3 1999)
Number Percent of national banks National banks with Web sites ... 1364 54.2
National banks with transactional Web sites ... of which:
FDIC-insured commercial national banks with transactional Web sitesa ... of which: Virtual banksc ... 541 464 1 21.5 19.9b d Memorandum:
Total national bankse: 2,517
Total FDIC-insured national banks: 2,334a Source: Office of the Comptroller of the Currency aExcluding credit card banks.
bFDIC-insured commercial national banks with transactional Internet banking as a percent of all FDIC-insured national banks, excluding credit card banks.
c
See the text for a definition of “virtual bank.” dLess than 1 percent.
eAll national banks for which a Q3 1999 call report was filed.
Although only a minority of institutions offer Internet banking, banks offering these services accounted for almost 90 percent of the assets in the national banking system (Table 2). In addition, transactional Internet banks accounted for almost 85 percent of all deposit accounts under $100,000 in the national banking system. Because such deposits are a reasonably good measure of consumer accounts at banks, we can say that most consumer accounts are at banks that offer Internet banking. According to market surveys, consumers do not transact much banking business over the Internet. Our data suggest that this limited usage is primarily due to a lack of consumer demand for the current set of Internet banking products, rather than a lack of access. The infrastructure is in place to allow for very rapid growth in the use of Internet
banking if consumers can be persuaded that using the Internet is superior to traditional delivery channels.12
Table 2. Internet banks few in number, but dominant in key characteristics (Q3 1999)
Transactional Internet national banks as a percent of all national banks
Number of banks 19.9
Assetsa 89.2
Small deposit accountsb 84.1
Transactional Internet national banks
Non-Internet national banksc
Average size (assets in $ billions) 5.88 0.18
Average number of employees 1,659 69
Average number of offices per bankd 61 5
Average number of employees per office 27 15
Percent of banks in urban arease 72.2 42.6
Source: Office of the Comptroller of the Currency. a Dollar value of assets.
b Percent of number of deposit accounts under $100,000. c
Includes banks with Web sites that are not transactional. d Includes headquarters, branches, and non-branch offices.
e “Urban area” is defined as a Standard Metropolitan Statistical Area.
As a group transactional Internet banks had, on average, 33 times more assets, 24 times more employees, and 12 times more offices than non-Internet national banks. In addition, although Internet banking can enable a remotely located bank to reach potential customers
12 Recent analyses indicate that a large percentage of customers who sign up for Internet banking discontinue using it. See, e.g., Redman (1999), who summarizes the findings of a Cyber Dialogue study. Craig (1999) presents a theoretical analysis of the obstacles to changes in payment patterns. Also see Marks (1999), who compares the relative success of online brokerage to online banking.
anywhere, transactional Internet banks were more than one-and-a-half times more likely to be located in an urban area than were non-Internet banks.
Table 3. National banks offering transactional Internet banking: size distribution
(Q3 1999) Number of Internet
banks
Internet banks as a percent of banks in size
category
Average asset size of Internet banks relative to
non-Internet banksa
Less than $100 million 85 7.1 0.95
$100 million to less than $1 billion
265 27.1 1.45
$1 billion to less than $10 billion
73 61.9 1.40
$10 billion and over 41 100.0 n.a.
Total 464 19.9 32.67
Source: Office of the Comptroller of the Currency a
Non-Internet banks include those with a Web site that is not transactional. n.a.: not applicable.
Table 3 illustrates the size distribution of Internet and non-Internet banks. All of the largest banks (i.e., those with $10 billion or more in assets) and almost two-thirds of mid-sized banks (i.e., those with between $1 billion and $10 billion in assets) offered Internet banking. By contrast, only 7 percent of small banks (i.e., those with under $100 million in assets) did.
Nevertheless, it is clear that while large banks are far more likely to be transactional, small size is not a prohibitive barrier to offering Internet banking.
The rate of growth in the number of banks adopting transactional Internet capabilities has been substantial in every size category. As Table 4 shows, between mid-1998 and the third
quarter of 1999, the number of transactional Internet banks under $1 billion in asset size more than tripled. Over that 15-month period, the percentage of national banks offering transactional Internet banking rose from 6.3 percent to 19.9 percent.
Table 4. Recent growth in Internet banking offered by national banks
Percent of banks offering transactional Internet banking
Percent increase in number of banks offering Internet banking
Asset size Q2 1998 Q3 1999 Q2 1998 to Q3 1999
All 6.3 19.9 188.2
Less than $100 million 2.0 7.1 226.9
$100 million to less than $1 billion
7.2 27.1 258.1
$1 billion to less than $10 billion
27.2 61.9 82.5
$10 billion and over 52.5 100.0 95.2
Source: Office of the Comptroller of the Currency; Egland, Furst, Nolle, and Robertson (1998).
Key Internet banking services
Egland, Furst, Nolle, and Robertson (1998) showed that in mid-1998, most transactional Internet banks offered the services of balance inquiry and funds transfer between accounts. That generalization still applied in the third quarter of 1999, as Table 5 shows, although small
transactional banks were somewhat less likely to offer these services.13 There is a more
13
Most of the banks that did not offer balance inquiry or funds transfer at a minimum offered online credit applications.
significant divergence by size category in the proportion of banks offering electronic bill payment. 14 All of the very largest banks, and over 90 percent of banks in the $1 billion to $10 billion asset class, offer electronic bill payment. This drops to 77 percent for banks between $100 million and $1 billion, and to 60 percent for the smallest banks.
Looking at Internet banking services beyond balance inquiry, funds transfer, and bill payment, what is offered, which varies greatly, depends on a bank’s size. In general, larger banks are more likely to accept credit applications online. Except for the smallest banks, there is no relationship between size and the ability to set up a new account on the Internet.
One notable feature of Table 5 is that banks of all sizes were roughly equally likely to offer online cash management services. Cash management is a key business-oriented service and the Internet would seem to offer significant opportunities for banks to create value by
improving the efficiency of cash management systems. Thus, competing in this line of business may be an important determinant of how well small banks compete with larger institutions for business customers. As of the third quarter of 1999, it appeared that small banks were giving this business line as much focus as large banks. However, as Table 5 makes clear, only about 16 percent of all transactional banks offered this service, a percentage far below that for most other online products for which we collected data.15
14 Electronic bill payment allows a bank’s customers to instruct the bank to make payments electronically. The bank then either sends an automated clearinghouse (ACH) payment or a paper check. In either case, the customer’s account is debited for the amount of the payment.
15 In the first quarter of 1999, Pizzani (1999) reported that “banks have largely ignored the online banking needs of small businesses.” As we discuss in the section on banks’ plans (below), it appears that bankers are planning to increase dramatically their emphasis on business Internet banking services.
Table 5. Key services offered by transactional Internet national banks (Q3 1999)
Type of service Percent of transactional Internet banks offering selected services All banks Less than $100
million $100 million to less than $1 billion $1 billion to less than $10 billion $10 billion and over
Balance inquiry and funds transfer
88.8 74.1 90.2 94.5 100.0
Bill payment 78.2 60.0 77.4 90.4 100.0
Credit applications 60.0 51.8 51.7 75.3 80.5
New account set-up 36.6 29.8 43.9 45.2 43.9
Brokerage 21.6 10.6 14.7 41.1 53.7 Cash management 15.7 14.1 16.2 15.1 17.1 Fiduciary 11.9 3.5 9.8 12.3 41.5 Bill presentment 10.6 7.1 7.9 16.4 24.4 Insurance 5.4 2.4 2.3 6.8 29.3 Basica 77.6 56.5 77.4 90.4 100.0 Premiumb 23.9 14.1 17.0 41.1 58.5
Source: Office of the Comptroller of the Currency. a
“Basic” includes balance inquiry, funds transfer, and bill payment. b “Premium” includes “Basic” and at least three other services.
Table 5 also describes to what extent particular business lines — brokerage, fiduciary, and insurance services — were offered online. Consistent with their practices in the physical world, larger banks are much more likely to offer brokerage services than smaller banks; the
online pattern is less clear for offerings of insurance and fiduciary services, although banks under $100 million in assets are least likely to offer any of these services.16
To gain a clearer picture of the typical range of Internet services available at banks in different size categories, we defined two alternative “menus” of Internet banking services. “BASIC” Internet banking is defined as the three core Internet banking services of balance inquiry, funds transfer, and bill payment. We define “PREMIUM” Internet banking as BASIC plus at least three other services. Figure 2 shows the proportion of banks by size category that offer only BASIC services to those that offer PREMIUM services. Small Internet banks are
more likely to offer only the BASIC services; only 14 percent of the smallest banks offer the PREMIUM range. But nearly 60 percent of the largest banks offer the PREMIUM range. More
16 As Table 4 shows, 41.5 percent of the largest transactional banks offer fiduciary services online. That percent is lower than the percent of the largest banks offering six of the other 10 online services. This relatively low
percentage appears to be consistent with more general findings about the somewhat lackluster competitive position of large banks in offering retirement services, both online and by traditional channels. See Robertson, Cambruzzi, Jacques, Nigro, Pate, Rich, and Steele (2000) for a detailed study of this issue.
Figure 2—Larger banks offer a greater range of Internet banking services
14.1 42.4 17.0 60.4 41.1 49.3 58.5 41.5 0 10 20 30 40 50 60 70
Less than $100 million $100 million to $1 billion $1 billion to $10 billion O ver $10 b illio n
Percent of transactio nal Internet national banks offering BAS IC and PR EMIUM servic e (Q3 1999)*
BASIC PR EM IUM
* BASIC service includes balance inquiry, funds transfer, and bill payment. PREMIUM service includes BASIC and at least three other online services.
generally, banks holding assets of more than $1 billion are at least two-and-a-half times more likely than banks holding assets of less than $1 billion to offer customers a PREMIUM package of services. The evidence indicates that, while small banks can establish an online presence, they are currently less likely to compete with large banks on the basis of the range of product
offerings. To the extent that product variety attracts and maintains a strong customer base, small banks may be at a disadvantage to large banks.
Web site privacy statements
Both banks and their customers stand to benefit substantially using the Internet to collect information. Customers can benefit from allowing banks to collect and integrate large amounts of personal information that help banks to tailor a wide range of products to individual demands. However, these same information collection, analysis, and distribution activities raise questions related to personal privacy protection.17 In response, many banks post an online statement of their policies about the collection and use of customer information. Our database includes information on how many transactional banks had such a statement on their Web site. Table 6 summarizes that information.18
More than four-fifths of transactional Internet banks had a privacy policy statement on their Web site in Q3 1999. That number has more than doubled since mid-1998.19 Large banks were more likely to post an online privacy policy than small banks. Indeed, 100 percent of the
17 See Office of the Comptroller of the Currency (1999a) for a discussion of privacy issues facing banks offering Internet banking.
18 Note that our data is confined to whether or not transactional Internet banks posted online a privacy statement; it does not include an evaluation of the nature of banks’ privacy statements. For an analysis of attributes of the online privacy statements of depository institutions, see the Interagency Web Site Privacy Report (1999).
largest banks posted one, and nearly every bank holding assets of more than $1 billion posted one, as compared with 75 percent of the smallest banks. However, the discrepancy between large and small bank practices in this respect narrowed considerably during 1999. Figure 3 illustrates the fact that online privacy statements have become more common for transactional Internet banks over time.
Table 6. Substantial increases in number of Web site privacy policy statements.
Percent of transactional Internet national banks with a privacy policy statement on the Web site
Asset size category Q2 1998 Q4 1998 Q3 1999
All 40.9 54.5 83.8
Less than $100 million 21.4 35.7 75.0
$100 million to less than $1 billion 32.6 41.3 79.5
$1 billion to less than $10 billion 37.5 62.5 97.7
$10 billion and over 75.0 95.0 100.0
Source: Office of the Comptroller of the Currency; Egland, Furst, Nolle, and Robertson (1998).
IV. Internet and non-Internet banks: performance comparisons
In comparing transactional Internet banks in mid-1998 to non-Internet banks, Egland, Furst, Nolle, and Robertson (1998) found little besides relative size to distinguish the two groups. As Tables 7, 8, and 9 illustrate, by Q3 1999 differences between Internet and non-Internet banks had begun to emerge in balance sheet composition and funding, in sources of income and expenditures, and in measures of performance.20
20 We make extensive use of univariate comparisons between Internet and non-Internet bank characteristics. Because the importance of bank size has already been established, we “control” for differences in bank size, roughly
speaking, by stratifying the data by asset size categories. This “first-step” approach is useful for an initial investigation to establish a foundation of stylized facts.
Figure 3—Most transactional Internet national banks have an online privacy statement
40.9 54.5 83.8 0 10 20 30 40 50 60 70 80 90 Q2 '98 Q4 '98 Q3 '99
Percent of transactional Internet national banks with an online privacy statement
1st Qt r2nd Qtr3r d Q tr4t h Qt r
Portfolio composition, income, and expenses
Table 7 shows major lending and funding characteristics for Internet and non-Internet banks.21 Overall, on the asset side, Internet banks have a relatively greater focus on business lending (C&I loans) and credit card lending. On the liability side, Internet banks generally rely less on deposits for funding and make greater use of purchased funds relative to deposits. For small banks, this result is consistent with recent business press reports that they are concerned about traditional sources of funding, and have begun to view the addition of Internet banking as a way to offer products that reduce their dependence on core deposits.22
Differences in business strategies between Internet and non-Internet banks are also evident in Table 7. The first column in Table 7 shows the ratio of noninterest income to net operating revenue. This ratio is a rough proxy for the amount of revenue being generated by “nontraditional” activities. Internet banks generated a substantially higher proportion of their income from nontraditional activities than did non-Internet banks. Roughly speaking, Internet banks received about 50 percent more of their revenue from noninterest income than do
21
In the tables throughout the remainder of the paper comparing structure and performance characteristics of Internet to non-Internet banks, we calculated a difference of means test to ascertain the likelihood that Internet banks and non-Internet banks were different with respect to a given characteristic. For each pair of observations in a table, we provide a probability value (p-value) for the hypothesis that the means in the Internet and non-Internet samples are the same. A lower p-value indicates a greater likelihood that the two figures being compared represent real differences between categories of banks (i.e., Internet vs. non-Internet, etc.). A common practice in empirical economics is to consider p-values at or below 0.05 as indicating a statistically significant difference, while some studies (particularly ones with small samples) use a cut-off point of 0.10 for asserting statistical significance. 22 See, e.g., Winig (2000), who reports that 85 percent of community bank CEOs who participated in a recent Grant Thornton survey agreed with the statement that “Funding with core deposits will be more difficult in three years,” because consumers continue to look for higher yielding alternatives to bank accounts. Correspondingly, the same survey reveals a surge in community banker interest in offering Internet banking.
Table 7. Internet and non-Internet national banks: selected balance sheet ratios a, b (Q3 1999) Loan composition (ratios in percent) Funding (ratios in percent) Asset size category C&I loans/ loans Credit card
loans/ loans
Deposits/ assets Fed funds purchased/
deposits Less than $100 million:
Internet banks Non-Internet banks 20.4 16.9 (0.001)*** 0.5 0.4 (0.691) 82.1 85.1 (0.000)*** 2.1 1.5 (0.276) $100 million to $1 billion: Internet banks Non-Internet banks 17.9 18.1 (0.209) 1.7 0.9 (0.000)*** 78.9 82.3 (0.000)*** 7.4 3.9 (0.000)*** $1 billion to $10 billion: Internet banks Non-Internet banks 24.5 17.8 (0.003)*** 4.2 0.9 (0.011)** 68.6 71.8 (0.299) 20.4 12.1 (0.023)** $10 billion and over:
Internet banks 34.1 2.8 66.1 11.7
Source: Office of the Comptroller of the Currency a
Numbers in parentheses are p-values for the difference of means test for Internet and non-Internet values in each cell. *** = significant at the 1% or better level; **=significant at the 5% level; *=significant at the 10% level. b Non-Internet banks include banks with non-transactional Web sites.
Internet banks. That pattern is consistent with a business strategy of using the Internet to target businesses and more affluent consumers, in the belief that these customers will be interested not only in loans but in other services that yield fee income.23
In addition to revenue enhancement, Internet banking could enable banks to reduce costs of operation. In particular, greater reliance on Internet banking might allow banks to reduce expenditures on “brick and mortar.” To the extent this is so, Internet banking would be considered a causal factor in generating lower expenses related to maintaining physical
23 See Gold (2000) for example. Bank Technology News (1999d) sites a Forrester Research Inc. study showing that higher income individuals are more likely to be active Internet banking users.
branches. On the other hand, one might expect that banks maintaining expensive branch
networks might have the greatest incentive to adopt Internet banking. From this perspective, the adoption of Internet banking would be the effect of existing characteristics of banks. The data in Table 8 show that, consistent with the first hypothesis, Internet banks over $100 million in assets had lower expenses on building and equipment relative to net operating revenue. However, among the smallest Internet banks — the majority of which adopted Internet banking after the second quarter of 1998 — building and equipment expenditures were higher than for non-Internet banks. This might indicate that smaller banks with high costs of maintaining a branch network are motivated to adopt Internet banking by the prospect of future cost savings. This result might also be due to small banks’ high initial costs of equipment (the call report aggregates expenditures on buildings and equipment) when establishing an online presence. Further
research is necessary to establish whether Internet banking will reduce costs associated with physical branch networks, and whether relatively high branch-related expenses is motivating banks to adopt Internet banking.
Table 8. Income and expenses: Internet and non-Internet national banksa, b (Q3 1999)
Asset size category “Non-traditional” income:
Noninterest income/ net operating revenueb
(percent)
Expenses: Premises & fixed assets/
net operating revenueb
(percent)
Less than $100 million:
Internet banks Non-Internet banks 22.0 14.6 (0.000)*** 11.7 9.3 (0.000)*** $100 million to $1 billion: Internet banks Non-Internet banks 23.1 16.8 (0.000)*** 8.2 9.1 (0.000)*** $1 billion to $10 billion: Internet banks Non-Internet banks 36.8 23.0 (0.000)*** 7.2 8.0 (0.111)
$10 billion and over:
Internet banks 40.1 8.1
Source: Office of the Comptroller of the Currency
a
Numbers in parentheses are p-values for the difference of means test for Internet and non-Internet values in each cell. *** = significant at the 1% or better level; **=significant at the 5% level; *=significant at the 10% level.
b
Non-Internet banks include banks with non-transactional Web sites.
c
Net operating revenue = net interest income plus noninterest income.
Performance measures
Even the banks most successful at offering Internet banking currently serve a relatively small share of their customer base with this delivery channel.24 As a result, it has been difficult for banks and industry analysts to determine yet whether Internet banking has had a significant
24
impact on bank performance.25 For example, in their comparison of Internet and non-Internet banks in mid-1998, Egland, Furst, Nolle, and Robertson (1998) observed that they did not find significant differences in profitability, efficiency, or credit quality. But, as our new information shows, by Q3 1999, differences in performance between Internet and non-Internet banks had emerged.
Table 9 compares the profitability, efficiency, and credit quality of Internet banks with those of non-Internet banks, by asset size category, in Q3 1999. What stands out most distinctly in this table are the performance differences between the Internet banks and non-Internet banks in the smallest size category compared to larger banks. For example, while Internet banks holding assets of more than $100 million were more profitable than non-Internet banks, the smallest Internet banks were significantly less profitable than the smallest non-Internet banks. 26 The smallest banks were also less efficient than non-Internet banks, as measured by the ratio of noninterest expense to net operating revenue (“accounting efficiency”), a commonly used measure of cost efficiency.27 There was no statistically significant difference between the
accounting efficiency of large Internet banks and large non-Internet banks. The smallest Internet banks had better credit quality than the smallest non-Internet banks; for large banks the pattern is less distinct. As discussed below, the differences for small banks were likely due to the relative performance of de novo banks that offered Internet banking.
25 See, for example, Azarchs (2000) and Jordan and Katz (1999). In a recent study, Moody’s Investors Service (2000a) says that “Moody’s does not foresee much impact from the Internet on large U.S. banks’ core profitability or competitive position — at least in the intermediate term.” Somewhat in contrast, Azarchs (2000) cites a Booz Allen & Hamilton Inc. study arguing that “a mature Internet bank could operate at a 15% - 20% expense-to-revenue ratio” compared with a ratio of about 60 percent for most banks. Hitt, Frei, and Harker (1999) found that banks’ investment in Internet banking had not resulted in “new, profitable customers to the firm, as many banks had hoped. Rather, it seems to be to retain high-value customers” (p. 132), a result echoed in Hitt and Frei (1999).
26 We also used return on assets as a measure of profitability and found very similar results. 27
Table 9. Internet banks and non-Internet national banks: performance comparisonsa, b (Q3 1999)
Asset size category
Profitability: Return on equity
(percent)
Accounting efficiency: Noninterest expense to net operating revenuec
(percent)
Credit Quality: Noncurrent loans to
total loansd (percent) Less than $100 million:
Internet banks ... Non-Internet banks ... 6.34 10.13 (0.000)*** 77.90 65.52 (0.000)*** 0.52 0.87 (0.002)*** $100 million to $1 billion: Internet banks ... Non-Internet banks ... 14.15 13.03 (0.000)*** 59.59 60.57 (0.282) 0.68 0.73 (0.249) $1 billion to $10 billion: Internet banks ... Non-Internet banks ... 18.26 15.68 (0.003)*** 56.26 54.74 (0.256) 0.81 0.56 (0.003)*** $10 billion and over:
Internet banks ... 15.35 57.84 0.82
Source: Office of the Comptroller of the Currency.
a Numbers in parentheses are p-values for the difference of means test for Internet and non-Internet values in each cell. *** = significant at the 1% or better level; **=significant at the 5% level; *=significant at the 10% level. b
Non-Internet banks include those with non-transactional Web sites. c
A higher ratio indicates lower efficiency. d A higher ratio indicates lower credit quality.
Interestingly, nonperforming loans were significantly higher for Internet banks in the $1 billion to $10 billion assets size category. This is consistent with the results in Table 7 that showed these banks more heavily concentrated in credit card and business lending than similarly sized non-Internet bank. The smallest Internet banks had fewer nonperforming loans than their non-Internet peers. This suggests that these banks’ poorer profitability and accounting efficiency ratios are not related to credit losses.
De novo banks
To investigate further the performance differences of small banks, we focused on two different groups of Internet banks: de novo Internet banks (in operation a year or less as of Q3 1999) and “mature” Internet banks (have offered Internet banking at least since Q2 1998
according to Egland, Furst, Nolle, and Robertson (1998)). Segmenting our data this way allowed us to investigate two possible reasons small Internet banks performed more poorly than small non-Internet banks: “newness” of banks and “newness” of Internet banking.
De novo banks as a rule perform more poorly than established banks, a pattern that generally holds for at least their first three years.28 Because most de novos are small (i.e., have less than $100 million in assets), we reasoned that their performance could have affected the measures of performance for the entire group of small banks.29 That suspicion was heightened by our discovery that, among small banks, de novo banks as a group were three times more likely to offer Internet banking than mature small banks30 In addition, it is reasonable to conjecture that the performance of a de novo bank might be significantly affected by its choice to offer Internet banking. On the cost side, there will be start-up expenses as well as advertising and operating expenses.31 On the revenue side, de novo banks offering Internet banking may have a strategy that relies heavily on their ability to attract customers using the Internet, and such a strategy may not produce strong revenues given the relatively slow pace of customer adoption of
28
See DeYoung (1999) for a recent analysis of the performance of de novo banks.
29 Fifty-six of the 59 (one year or younger) de novo national banks in Q3 1999 were in the under $100 million asset size category.
30 As the memorandum item in Table 10 shows, 19.2 percent of small de novo banks offered Internet banking, while only 6.1 percent of “mature” small banks offered Internet banking.
31 This may be true even if much of the set-up and operation of the bank’s Internet banking is outsourced to third party vendors.
Internet banking. In light of this, we separated de novo national banks from the rest of the small national banks.
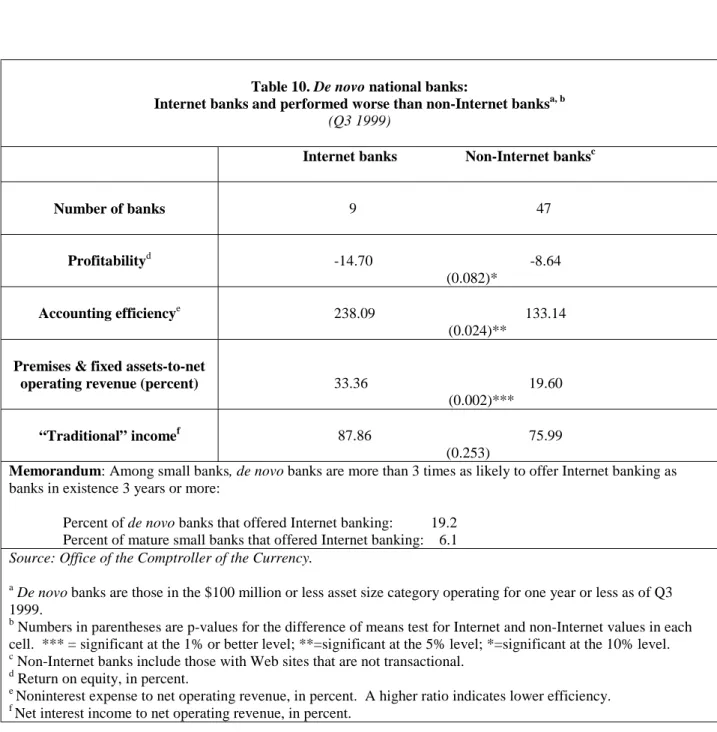
Table 10 compares the nine de novo Internet national banks and forty-seven de novo non-Internet national banks in Q3 1999 across key performance characteristics. The de novo Internet banks were much less profitable and less efficient than de novo non-Internet banks. In a
Table 10. De novo national banks:
Internet banks and performed worse than non-Internet banksa, b (Q3 1999)
Internet banks Non-Internet banksc
Number of banks 9 47
Profitabilityd -14.70 -8.64 (0.082)*
Accounting efficiencye 238.09 133.14 (0.024)**
Premises & fixed assets-to-net
operating revenue (percent) 33.36 19.60 (0.002)*** “Traditional” incomef 87.86 75.99
(0.253)
Memorandum: Among small banks, de novo banks are more than 3 times as likely to offer Internet banking as banks in existence 3 years or more:
Percent of de novo banks that offered Internet banking: 19.2 Percent of mature small banks that offered Internet banking: 6.1 Source: Office of the Comptroller of the Currency.
a De novo banks are those in the $100 million or less asset size category operating for one year or less as of Q3 1999.
b Numbers in parentheses are p-values for the difference of means test for Internet and non-Internet values in each cell. *** = significant at the 1% or better level; **=significant at the 5% level; *=significant at the 10% level. c Non-Internet banks include those with Web sites that are not transactional.
d Return on equity, in percent.
e Noninterest expense to net operating revenue, in percent. A higher ratio indicates lower efficiency. f
proximate sense, contributing considerably to these results was that de novo Internet banks exhibited a much higher expense ratio than did non-Internet de novo banks. As discussed
previously, the data do not allow us to ascertain the composition of the expenditures for premises and fixed assets. Nevertheless, it is possible that expense ratios were higher for de novo Internet banks in part because of costs incurred to set up Internet banking.32
Internet experience and bank performance
Clearly, the combination of being a new bank and of offering Internet banking results in relatively poor performance. But it is also possible that the poor performance of small Internet banks versus non-Internet banks is the result of short run costs of making an investment in Internet banking, one that could be expected to yield substantial gains in the longer run. Few banks have had Internet banking for more than several years, so it is difficult to ascertain what the “long run” is with respect to Internet banking. Nevertheless, our data allow us to explore whether, among mature small banks offering Internet banking, those that have offered it for a relatively long time outperformed those that only recently began to offer it.33 Making such a comparison separates “newness of bank” from “newness of Internet banking.”
The results of subtracting de novos and then segmenting mature small Internet banks by “Internet experience” are presented in Tables 11 and 12. Table 11 shows that the less profitable non-Internet banks in Table 9 are just as profitable as Internet banks when de novo banks are
32
Table 10 also shows that de novo Internet banks received a higher proportion of their revenue from traditional interest income than did non-Internet de novos. While the statistical significance of this result is weak, it stands in marked contrast to the significantly lower reliance on traditional income by Internet banks in other size categories. That outcome could reflect difficulties for de novo Internet banks in successfully developing customer and business relationships via the Internet.
33 We define “mature” banks as those in operation for more than three years as of Q3 1999. We compared the performance of “Internet-experienced” banks (i.e., those offering Internet banking since at least Q2 1998) to that of banks that began offering Internet banking after Q2 1998, for all size categories. We found no statistically
excluded. However, small Internet banks are still less efficient than small non-Internet banks, despite the exclusion of de novo banks. Hence, it is not the newness of the bank that explains this aspect of worse performance for small Internet banks.
Table 11—Mature small national banks: Internet banks are less efficient, but not less profitablea,b (Q3 1999)
Non-Internet banks Internet banks
Number of banks 1,009 61 Profitabilityc p-value 11.13 10.36 (0.232) Accounting efficiencyd p-value 64.50 70.50 (0.000)***
Premises and fixed assets-to-net operating revenue p-value 9.02 10.41 (0.000)*** “Traditional” incomee p-value 85.51 78.24 (0.000)***
Source: Office of the Comptroller of the Currency.
a “Mature” small banks are those in the $100 million or less asset size category in operation for more than three years as of the third quarter of 1999. Non-Internet banks include those with Web sites that are not transactional.
b Numbers in parentheses are probability values (p-values) for a statistical test of the hypothesis that the mean values in each cell are equal. Thus, a smaller p-value indicates a greater likelihood that the true mean value of the Internet sample differs from the non-Internet sample. Asterisks indicate the statistical significance of the difference of means test with:
*** = significant at the 1% level ** = significant at the 5% level * = significant at the 10% level c Return on equity, in percent.
d Noninterest expense to net operating revenue, in percent. A higher ratio indicates lower efficiency. e
Net interest income to net operating revenue, in percent.
significant difference in performance between those two “vintages” of Internet banks in the banks over $100 million in assets. Hence, our discussion in the text is confined to the smallest banks.
To investigate whether “newness of offering Internet banking” might explain the poorer efficiency results for small Internet banks, we divided the 61 small Internet banks into two groups. “Internet-experienced” banks are those that offered Internet banking no later than the second quarter of 1998, and “Internet-inexperienced” banks are those that began to offer Internet banking sometime between the beginning of the third quarter of 1998 and the end of the third quarter of 1999.34 We then compared both the small experienced and the Internet-inexperienced banks to small non-Internet banks.
The results, summarized in Table 12, show that there is no statistical difference between the accounting efficiency of Internet-experienced banks and that of non-Internet banks.
However, the accounting efficiency of small banks only recently offering Internet banking was poorer by a statistically significant margin than that of non-Internet banks. Hence, the lower efficiency of small Internet banks as a group is attributable to those small Internet banks just recently beginning to offer Internet banking; i.e., it appears that Internet experience does matter for small banks.
Table 12 also shows that, for a key measure of “input” costs—the ratio of premises and fixed assets to net operating revenue—Internet-inexperienced banks were significantly worse than non-Internet banks. This fact helps explain the greater inefficiency of small banks for which Internet is relatively new. Their expense and efficiency disadvantages may be a
temporary consequence of investing in Internet banking.35 It is interesting to note that, although
34 As indicated previously, we have no record of the exact date banks began offering Internet banking to their customers.
35
The statistical results do not allow us to say for certain that “newness of Internet” for small banks causes poorer efficiency. It is possible that another set of factors explains both why some small banks chose not to be in the vanguard of banks offering Internet banking, and why they had poorer accounting efficiency ratios than did the 11 Internet-experienced banks that were among the “early adopters” of Internet banking.
Table 12—Mature small national banks: Does Internet experience matter?a, b (Q3 1999) Non-Internet banks Internet-experienced banks Internet-inexperienced banks Number of banks 1,009 11 50 Profitabilityc p-values 11.13 9.95 10.58 (0.400) (0.434) Accounting efficiencyd p-values 64.50 63.10 71.61 (0.641) (0.000)*** Premises and fixed
assets-to-net operating revenue p-values 9.02 7.99 10.85 (0.233) (0.000)*** “Traditional” incomee p-values 85.51 75.94 75.25 (0.000)*** (0.000)*** Source: Office of the Comptroller of the Currency.
a “Mature” small banks are those in the $100 million or less asset size category in operation for more than three years as of the third quarter of 1999. Non-Internet banks include those with Web sites that are not transactional. experienced” banks are those that have offered Internet banking since at least the second quarter of 1998. “Internet-inexperienced” banks are those that began to offer Internet banking after the second quarter of 1998.
b Numbers in parentheses are p-values for the difference of means tests for Internet-experienced banks compared to non-Internet banks, and for Internet-inexperienced banks compared to non-Internet banks, respectively. The p-values are probability values for a statistical test of the hypothesis that the mean values in each cell are equal. Thus, a smaller p-value indicates a greater likelihood that the true mean value of the Internet sample differs from the non-Internet sample. Asterisks indicate the statistical significance of the difference of means test with:
*** = significant at the 1% level ** = significant at the 5% level * = significant at the 10% level c Return on equity, in percent.
d
Noninterest expense to net operating revenue, in percent. A higher ratio indicates lower efficiency. e Net interest income to net operating revenue, in percent.
neither the Internet-experienced nor the Internet-inexperienced banks exhibited statistically different profitability than non-Internet banks, both groups of Internet banks relied less on traditional interest-yielding activities than non-Internet banks. These results suggest that while
small banks that have only recently begun to offer Internet banking have relatively high expenses, growth in revenues are sufficient to maintain overall profitability.
Safety, soundness, and information technology
When federal bank regulators regularly examine for safety and soundness, they issue CAMELS ratings to each bank. CAMELS range from “1” (best rating) to “5” (worst rating). Separate examinations evaluate banks’ risk management of the information technology (IT), using the Uniform Rating System for Information Technology (URSIT). Like CAMELS ratings, IT exam scores range from 1 to 5.36
Table 13 compares the composite and management components of the CAMELS and IT ratings for Internet and non-Internet banks by size. (See Table 13 at the end of the document.) Because relatively few banks offered Internet banking, one might expect the “early adopters” to be more forward-looking and astute with respect to technology than non-Internet banks, and that this astuteness would be reflected in examiner ratings. The figures displayed in Table 13 provide weak support for this conjecture, inasmuch as Internet banks generally had better IT and
CAMELS ratings than non-Internet banks, although the p-values generally are above 10
percent.37 There is one exception to the general rule that Internet banks receive better supervisory
36 CAMELS ratings cover six aspects of bank safety and soundness: capital adequacy (C), asset quality (A), management (M), earnings (E), liquidity (L), and sensitivity to market risk (S). See the Federal Register: January 20, 1999 (volume 64, number 12, pp. 3109-3116) for a detailed description of the URSIT, which is “an internal supervisory examination rating system used by federal and state regulators to assess uniformly financial institution and service provider risks introduced by information technology and for identifying those institutions and service providers requiring special supervisory attention.” Note, therefore, that URSIT exams are given to service providers over which regulators have supervisory authority, as well as to banks.
37
The relative weakness of these results might be due to the overall strength of national banks during this period, and the resultant relatively strong supervisory ratings. See Office of the Comptroller of the Currency (1999b) for an analysis of national banking industry performance during the third quarter of 1999. There is evidence showing that banks that effectively manage IT realize greater stock prices. See Bank Technology News (1999a), which cites a Barents study comparing stock prices of “well-run IT banks” with the banking industry average, 1992-1998. See also O’Sullivan (1998), who summarizes research suggesting that IT spending on technology staff boosts
ratings: Internet banks in the $1 billion to $10 billion size category on average received worse IT ratings, though these same banks on average received better CAMELS ratings.
V. The determinants of Internet banking
Drawing on the preceding analysis, this section estimates a multivariate logistic model to determine the factors explaining which banks are most likely to choose to offer Internet banking. Moving to a multivariate framework allows us to see whether the univariate relationships
described above continue to hold after controlling for relevant factors. In addition to estimating the factors determining adoption, we also estimate a model to determine why some banks offer a wide range of Internet banking services.
Explaining the decision to offer Internet banking: A multivariate analysis
To test for the factors explaining which banks choose to offer Internet banking, we limit our sample to national banks that did not offer transactional Internet banking at the end of Q2 1998. By limiting our sample in this way, we can ensure that the independent variables used in the regressions measure bank characteristics prior to the adoption of Internet banking. We then estimate a logistic regression with the dependent variable INTNEW which takes on a value of one if a bank adopted Internet banking by the end of Q3 1999 and zero otherwise. The
explanatory variables in the model are characteristics of the bank as of Q2 1998, before any of the banks in our sample adopted Internet banking. Since a bank in our sample had to be in existence as of Q2 1998, de novo banks that are less than five quarters old as of Q3 1999 are excluded from our sample.
Explanatory variables include the following:
! ASSETS is the size of a bank, measured by assets in Q2 1998. Our previous analysis leads us to expect that, controlling for other factors, the larger the bank the more likely it will be to choose to offer Internet banking; i.e., we expect the coefficient on this variable to be positive. ! YOUNG takes on a value of one if the bank is less than three years old as of Q3 1999. Since
we are using Q2 1998 data as our regressors, banks that are a year or less old as of Q3 1999 are not in our sample. This variable controls for “newness” of a bank. We expect this coefficient to be positive as it is likely that some new banks were formed based on a belief that new technology created new business opportunities.
! BHC takes on a value of one if a bank is a member of a bank holding company, zero otherwise. Our expectation is that, other things equal, a bank that is a member of a bank holding company is more likely to offer Internet banking, because a bank holding company can use a single Web site to provide Internet banking access to customers of multiple banks in the holding company.
! URBAN takes on a value of one if a bank is located in an urban area, and zero if it is not.38 The univariate analysis indicated that banks in urban areas are more likely to offer Internet banking to their customers than banks in nonurban areas (see Table 2, above). Our
conjecture is that banks in more densely populated areas are likely responding to greater customer demand for Internet banking and to more intense competitive pressures from rival banks in the same market. Hence, we expect a positive coefficient for this variable.
! DEPOSITS is the ratio of deposits to assets on a bank’s balance sheet in Q2 1998. Banks that are less reliant on traditional sources of funding may tend to pursue a more aggressive overall business strategy, including the adoption of Internet banking. Our sign expectation for this variable is negative.
!
EXPENSES is the ratio of expenses for premises and fixed assets to net operating revenue in Q2 1998. The direction of this effect is ambiguous. On the one hand, banks with relatively high expenses on premises and fixed assets may view adoption of Internet banking as a way to reduce expenditures devoted to maintaining a branch network.39 On the other hand, some analysts have argued that banks without a large branch network will seize on offering Internet banking as an inexpensive means to expand their customer base.! NIINCOME is the ratio of noninterest income to net operating revenue in Q2 1998. One measure of the “aggressiveness” of a bank’s business strategy is how much of its income comes from fees. We hypothesize that banks with a greater reliance on nontraditional revenue are more likely to view Internet banking as a way to market fee-generating services,
38 As noted in Table 2, an urban area is defined as a Standard Metropolitan Statistical Area.
39 But note that because we are not able to decompose such expenditures into those associated solely with physical offices, one has to use caution in interpreting this variable.
and are more likely to be institutions that adopt innovative services as part of an overall aggressive business strategy.
! ROE is return on equity in Q2 1998. We include this measure of bank profitability in our empirical model to test whether it has an independent effect on the decision to offer Internet banking.40 The direction of the effect of ROE is ambiguous. It is possible that more
profitable banks could choose to incur the costs of offering Internet banking both because they are financially more able to do so, and because they believe doing so will help them maintain their competitive position. However, less profitable banks might be more willing to invest in Internet banking to improve their performance.
! INEFFICIENCY is the ratio of noninterest expense to net operating revenue (i.e., our
“accounting efficiency” measure) in Q2 1998. The higher the value of this variable, the more inefficient is the bank. Our sign expectation for this variable, like ROE, is ambiguous. The estimated coefficient for the variable could be positive if inefficient banks viewed Internet banking as a means to become more efficient. Alternatively, the coefficient could be negative if relatively efficient banks are more innovative and better able to incorporate new technology and new services.
! CAMELS is the composite safety and soundness rating given by examiners to a bank as of Q2 1998. A higher CAMELS number indicates a poorer exam rating. We include it in the model to test whether there is an independent influence for the overall safety and soundness character of a bank on its decision to offer Internet banking. The sign for this variable is ambiguous.
To summarize, our model is:
(+) (+) (+) (+) (-) (?)
INTNEW = f (ASSETS, YOUNG, BHC, URBAN, DEPOSITS, EXPENSES, (+) (?) (?) (?)
NIINCOME, ROE, INEFFICIENCY, CAMELS)
where the sign in parentheses above the variable name indicates the expected sign of the regression coefficient (and a “?” indicates that we have no a priori sign expectation for the variable).
40
We speculated in the previous section that profitability is positively correlated with Internet banking. In the recent past, banks giving greater emphasis to fee-generating activities have tended to be more profitable than other banks; we reasoned above that such banks are also more likely than other banks to choose to offer Internet banking. In our multivariate model we wish to test whether, taking account of how much a bank relies on noninterest income, differences in profitability partly explain why banks offer Internet banking.