CH-8057 Zurich www.zora.uzh.ch Year: 2017
Evolution of density-dependent movement during experimental range
expansions
Fronhofer, Emanuel A ; Gut, Sereina ; Altermatt, Florian
Abstract: Range expansions and biological invasions are prime examples of transient processes that are likely impacted by rapid evolutionary changes. As a spa- tial process, range expansions are driven by dispersal and movement beha- viour. Although it is widely accepted that dispersal and movement may be context-dependent, for instance density-dependent, and best represented by reaction norms, the evolution of density-dependent movement during range expansions has received little experimental attention. We therefore tested current theory predicting the evolution of increased movement at low den- sities at range margins using highly replicated and controlled range expan- sion experiments across multiple genotypes of the protist model system Tetrahymena thermophila. Although rare, we found evolutionary changes dur- ing range expansions even in the absence of initial standing genetic varia- tion. Range expansions led to the evolution of negatively density-dependent movement at range margins. In addition, we report the evolution of increased intrastrain competitive ability and concurrently decreased popula- tion growth rates in range cores. Our findings highlight the importance of understanding movement and dispersal as evolving reaction norms and plas- tic life-history traits of central relevance for range expansions, biological invasions and the dynamics of spatially structured systems in general.
DOI: https://doi.org/10.1111/jeb.13182
Posted at the Zurich Open Repository and Archive, University of Zurich ZORA URL: https://doi.org/10.5167/uzh-144410
Journal Article Accepted Version
The following work is licensed under a Creative Commons: Attribution 4.0 International (CC BY 4.0) License.
Originally published at:
Fronhofer, Emanuel A; Gut, Sereina; Altermatt, Florian (2017). Evolution of density-dependent move-ment during experimove-mental range expansions. Journal of Evolutionary Biology, 30(12):2165-2176.
Evolution of density-dependent movement
during replicated experimental range
expansions
Emanuel A. Fronhofer
1,2,∗, Sereina Gut
1and Florian Altermatt
1,21 Eawag: Swiss Federal Institute of Aquatic Science and Technology, Department of Aquatic Ecology, ¨
Uberlandstrasse 133, CH-8600 D¨ubendorf, Switzerland
2 Department of Evolutionary Biology and Environmental Studies, University of Zurich, Winterthur-erstrasse 190, CH-8057 Z¨urich, Switzerland
* Orcid ID: 0000-0002-2219-784X
Running title: Evolution during range expansions
Keywords: Dispersal evolution, context-dependent dispersal, movement, experimental evolution, pro-tist microcosm, biological invasion,Tetrahymena thermophila
Data accessibility: The data will be made available at Dryad (http://dx.doi.org/xxxxx). Video analysis scripts can be found on GitHub (https://github.com/efronhofer/analysis script bemovi).
Correspondence Details
Emanuel A. Fronhofer Eawag: Swiss Federal Institute of Aquatic Science and Technology Department of Aquatic Ecology
¨
Uberlandstrasse 133 CH-8600 D¨ubendorf phone: +41 58 765 5143 email: [email protected]
Abstract
Range expansions and biological invasions are prime examples of non-equilibrium systems that are likely impacted by rapid evolutionary changes. As a spatial process, range expansions are driven by dispersal and movement behaviour. While it is widely accepted that dispersal and movement may be context-dependent, for instance density-context-dependent, and best represented by reaction norms, the evolution of density-dependent movement during range expansions has received little experimental attention. We therefore tested current theory predicting the evolution of increased movement at low densities at range margins using highly replicated and controlled range expansion experiments across multiple genotypes of the protist model system Tetrahymena thermophila. Although rare, we found evolutionary changes during range expansions even in the absence of initial standing genetic variation. Range expansions led to the evolution of negatively density-dependent movement at range margins. In addition, we report the evolution of increased competitive ability and concurrently decreased population growth rates in range cores. Our findings highlight the importance of understanding movement and dispersal as evolving reaction norms and plastic life-history traits of central relevance for range expansions, biological invasions and the dynamics of spatially structured systems in general.
Introduction
Species’ ranges and the distribution of taxa on earth have long been studied only from an ecological point of view and put in the context of local climatic and environmental conditions. Recent theoretical work and empirical case examples however, have expanded upon this work by including an evolutionary perspective. Such an approach is needed because rapid evolutionary changes are thought to be especially relevant under transient and non-equilibrium conditions inherent to species range dynamics and population spread (Excoffieret al., 2009; Hanski, 2012; Kubischet al., 2014).
The importance of an evolutionary and eco-evolutionary perspective for understanding the dynamics of species ranges becomes evident when considering the main drivers of range dynamics: dispersal and reproduction. These life-history traits not only have a genetic basis (Bonte & Dahirel, 2017; Saastamoinen
et al., submitted) and can be subject to evolutionary change, but ample theoretical evidence suggests that the evolution of dispersal and reproduction may also have important effects on the dynamics of species ranges (e.g. reviewed in Kubischet al., 2014). For instance, dispersal during range expansions is predicted to evolve to higher rates at range margins, a phenomenon called ‘spatial selection’ (Phillipset al., 2010). Spatial selection relies on a simple ecological filter effect: if there is variation in dispersal ability, fast individuals will automatically be spreading more towards the range margin and colonize previously empty patches (see also Haag et al., 2005). As a consequence, populations at the range margin have a higher proportion of more dispersive individuals that will mate with each other. In combination with fitness advantages due to low intraspecific competition at the range margin, this spatial assortment can lead to the evolution of increased dispersal and movement abilities. These evolutionary changes have important consequences for (macro)ecological patterns: range expansions and biological invasions are predicted to proceed faster if dispersal evolves (Perkinset al., 2013). Theoretical predictions regarding the evolution of reproduction have also been made, especially in the context of life-history trade-offs between dispersal, reproduction and competitive ability (Burtonet al., 2010; Fronhofer & Altermatt, 2015; Fronhoferet al., 2017). Since dispersal is costly (Bonteet al., 2012), models generally assume that either reproduction or competitive ability have to decrease if dispersal increases.
While there is accumulating comparative empirical evidence linked to spatial selection (e.g. Thomas
et al., 2001; Phillipset al., 2006; Lombaertet al., 2014), experimental confirmation is more scare. This scarcity is mainly due to the obvious challenges associated with studying how evolution impacts macroe-cological patterns experimentally. However, a recently increasing use of (small) model organisms has been spurring the study of experimental range expansions and population spread dynamics. As a consequence, range expansions are currently under intense scrutiny from an experimental ecological (e.g. Melbourne & Hastings, 2009; Giomettoet al., 2014, in press) and evolutionary point of view (e.g. Hallatscheket al.,
2007; Fronhofer & Altermatt, 2015; Gralkaet al., 2016; Williamset al., 2016; Wagneret al., 2017; Ochocki & Miller, 2017; Weiss-Lehman et al., 2017; Fronhoferet al., 2017). A result of these concerted efforts is the experimental demonstration that range expansions indeed may select for increased dispersal rates and distances at the rage margin (in protists: Fronhofer & Altermatt 2015; Fronhoferet al.2017; in insects: Ochocki & Miller 2017; Weiss-Lehmanet al.2017 and in plants: Williamset al.2016), which can lead to increased range expansion speeds.
We build on these studies and address in more detail two aspects that have received less attention so far: Firstly, we explore evolutionary change during range expansions of populations initially harbouring no standing genetic variation. Understanding the consequences of depleted genetic variation may be especially relevant in the context of biological invasions, since genetic variation may be lost due to bottlenecks associated to the invasion process itself, which potentially constrains the success of invasions and evolutionary dynamics (for a critical discussion, see Roman & Darling, 2007; Dlugosch & Parker, 2008). The literature on biological invasions also suggests that successful range expansions should be overall rare, regardless of whether evolutionary changes occur or not. For example, the classic, empirically derived ‘tens rule’ discussed by Williamson & Fitter (1996) states that one tenth of imported species become introduced, one tenth of these species will become established and again only one tenth will successfully spread.
Secondly, we highlight that movement is context-dependent (Clobert et al., 2009; Fronhofer et al., 2017; Weiss-Lehman et al., 2017), that is, a reaction norm. The most well-known dispersal reaction norm captures dispersal as a function of conspecific density (e.g. Pennekamp et al., 2014; Fronhofer
et al., 2015b), as the spatio-temporal distribution of densities is an important proximate and ultimate factor determining dispersal strategies (Bowler & Benton, 2005; Ronce, 2007). Current theory predicts that range expansions do not only select on the mean dispersal trait, but rather on the shape of the reaction norm (Traviset al., 2009). Dispersal is predicted to increase even at low densities which makes the reaction norm less positively density-dependent at the range margin (Travis et al., 2009). While density-dependent dispersal will optimize fitness in (quasi)equilibrium environments, such as the range core (Bowler & Benton, 2005), local conspecific density does not provide relevant information at the range margin: spatial selection makes dispersal highly advantageous even if local densities at the range margin are low. The evolution of increased dispersal at low densities at the range margin may have important consequences for range expansion dynamics: theory shows that density-dependent dispersal may slow down range expansions (Bestet al., 2007) but can ultimately lead to wider ranges (Kubischet al., 2011), to name but two examples.
Here, we experimentally tested whether and how range expansions impact the evolution of density-dependent movement (as a proxy of dispersal) and potentially change the shape of the density-density-dependent
movement reaction norm. We predicted movement to evolve towards higher values at low densities making the reaction less positively or even negatively density-dependent at the range margin (Travis
et al., 2009; Weiss-Lehman et al., 2017). We tested this prediction using experimental evolution and a total of 48 replicate range expansions of 14 clonally reproducing Tetrahymena thermophila strains, as well as the mix of these strains. Due to the lack of initial standing genetic variation in the replicates with single clonal strains and the low population densities characteristic of expanding range margins, we predicted consistent evolutionary differentiation between range core and margin populations to be rare and emerge only in a minority of our replicates. In addition, successful range expansions, whether including evolutionary change or not, can be expected to be rare overall, as suggested by comparative empirical evidence of biological invasions (Williamson & Fitter, 1996). We recorded movement behaviour and changes in life-history traits, namely population growth rate and competitive ability, to investigate potential concurrent evolutionary changes (Bonte & Dahirel, 2017).
Material and Methods
Model organism
We used the freshwater ciliateTetrahymena thermophila (Cassidy-Hanley, 2012) as our model organism. It is, together with its sister species (Tetrahymena pyriformis), commonly and successfully employed in both ecological (e.g., Giometto et al., 2014; Fronhofer et al., 2015b) and evolutionary contexts (e.g., Fjerdingstadet al., 2007; Frimanet al., 2011; Pennekampet al., 2014; Hiltunen & Becks, 2014; Fronhofer & Altermatt, 2015) and is known to show density-dependent movement and dispersal (Pennekampet al., 2014; Fronhofer et al., 2015b). Tetrahymena thermophila can reproduce both sexually (if a cell from another mating type is present and mating is induced, e.g. by starvation, which was not the case in our experiments) and clonally (Cassidy-Hanley, 2012). We used a total of 14 clonally reproducing strains that were isolated as single cells shortly prior to the experiment from 7 mating types originally obtained from Cornell University’s Tetrahymena Stock Center (Stock ID: MTP01). The 14 clonally reproducing strains used here differ in attributes ranging from population growth rates and equilibrium densities (Tab. S1) to morphology and movement characteristics (Tab. S2).
Tetrahymena thermophila was kept in filtered (cellulose paper filters, 4–7 µm; Whatman) and auto-claved protist pellet medium (0.46gL−1
; Protozoan pellets, Carolina Biological Supply) under constant temperature (20◦C) and light conditions (Osram Biolux 30W). Initially, we supplemented the medium
with a mix of three bacterial species (Serratia fonticola, Bacillus subtilis and Brevibacillus brevis; ob-tained from Carolina Biological Supply) at approx. 5% of their equilibrium density as a food source. During the experiment we replaced 2 mL out of 15 mL medium in each microcosm with bacterial
cul-tures at equilibrium density (approx. 1 week old) in order to prevent adaptation of the bacteria and co-evolutionary dynamics from occurring. For further methodological details see Altermattet al.(2015).
Experimental setup and microcosm landscapes
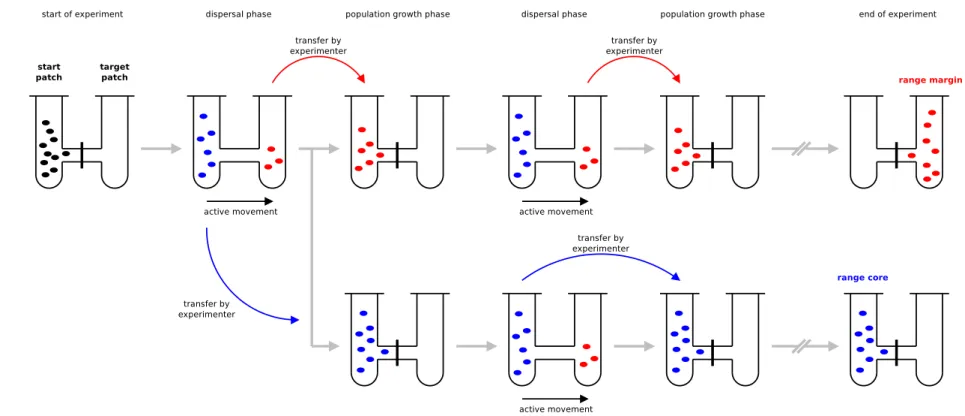
We set up microcosm landscapes to study range expansions into initially uninhabited habitat by prop-agating range core and range margin populations as described by Fronhofer & Altermatt (2015). The microcosms landscapes consisted of two vials (20 mL conical vials, Sarstedt) connect by silicone tubing (inside diameter: 4 mm, VWR) and a stopcock (Discofix, B.Braun) to control for dispersal (total length: 6 cm). For a graphical overview of the experimental procedure see Fig. S1.
The first patch (start) was initially filled with the respective T. thermophila strain at equilibrium density and dispersal into the empty target patch (filled with 15 mL protist pellet medium with bacteria) was allowed for 4 h. Thereafter, the populations in the start and target patches were propagated to start patches in respectively new 2-patch systems. The population from the original start patch was subsequently taken as the range core. Dispersal was allowed for 4 h and only the individuals remaining in the start patch were further propagated. By contrast, the population from the original target patch represented the range margin. Dispersal was also allowed for 4 h. Thereafter, the population in the target patch was propagated to a new 2-patch system. This procedure, effectively tracking range core and expanding range margin populations, was repeated 3 times per week for 1 month.
During transfer to new 2-patch systems only 13 of the 15 mL of the range core were transferred and the remaining 2 mL were filled with bacterial cultures at equilibrium (approx. 1 week old) to avoid evolutionary changes in the bacterial populations. This procedure was not necessary for the range margin, as the individuals of the range margin had always just dispersed into medium with bacteria from the stock population.
We chose this experimental approach that tracks only range core and range margin for convenience and feasibility. Firstly, we can easily control resource levels and avoid loss of control and contaminations due to aging medium in long landscapes. Secondly, we have shown that, although the experimental procedure obviously prevents feedbacks between core and margin populations, our results are not altered if we indeed use long interconnected linear landscapes (Fronhoferet al., 2017).
We followed a total of 48 range expansions, that is, pairs of range cores and margins. We replicated the range expansion of each of the 14 strain three times and additionally included six replicates of a mix (in equal proportions) of all strains. The latter range expansions using the mix of strains thus differs from the range expansions of the single clones in that they were started with standing genetic variation.
Recording of population densities and movement data
During the experiment all microcosms were sampled at every transfer, that is three times per week. Data on population densities as well as movement metrics (e.g., velocity of the cells) were collected by video recording and automated analysis.
Using a Leica M205C stereomicroscope at a 16-fold magnification and an Orca Flash 4 camera (Hama-matsu) we recorded 20 s videos (25 frames per second) of an effective volume of 34.4µL(sample height: 0.5 mm). Videos were subsequently analysed using the R environment for statistical computing (version 3.2.3)
and a customized version of the ‘BEMOVI’ package (available on GitHub: https://github.com/efronhofer/bemovi) originally developed by Pennekamp et al. (2015). The ‘BEMOVI’ package uses the image
process-ing software ImageJ to locate movprocess-ing particles in the videos and to calculate population densities as well as movement metrics. Data are automatically filtered to exclude artifacts such as debris that are outside the size or movement range of the study species (detailed settings available on GitHub: https://github.com/efronhofer/analysis script bemovi). As movement velocity has been shown to corre-late well with dispersal rates in this system (Fronhofer & Altermatt, 2015; Fronhofer et al., 2015a) we will focus on velocity as a proxy for dispersal.
Common garden experiments
In order to separate evolutionary from potential plastic intergenerational and environmental effects, movement behaviour of individuals from range core and range margin populations was measured not only during the evolution experiment, but also after the end of the experiment and a three-day common garden phase (doubling time for the strains of T. thermophila used here: approx. 3–12 h; see Tab. S1). The common garden was initiated with 1.5 mL samples obtained from the respective core and margin populations from the last day of the evolution experiment that were added to 13.5 mL medium with bacteria from the stock population to homogenize environmental conditions.
In addition, we kept a subset of the individuals analysed in this first common garden for an extended period in a common environment (total of 38 days). This allowed us to explore the long-term stability of potential evolutionary changes. Resources were not refreshed in order to create strong competition similar to stable range core populations.
Estimating population growth rates and competition coefficients
Both, at the beginning of the experiment and after the common garden we used population growth experiments to estimate population growth rates (r0) as well as competition coefficients (αii). These
the common garden for the end) and 14 mL medium with bacteria from the stock population. We then followed population densities and movement over the course of 9 days, measuring twice in the first two days and then once on days 2, 3, 4, 7 and 9.
Population growth rates (r0) and competition coefficients (αii) were estimated by fitting the logistic
growth model according to Verhulst (1838)
dN
dt = (r0−αiiN)N (1)
where N is the population size, to the data obtained from the growth experiments. The equilibrium density is obtained as ˆN = r0
αii. We used the R environment for statistical computing (version 3.3.2) to
solve (function ‘ode’; ‘deSolve’ package) and subsequently fit the model by minimizing residuals using the Levenberg-Marquardt algorithm (function ‘nls.lm’; ‘minpack.lm’).
Density-dependent movement
The data obtained from the growth experiments were also used to assess potential evolutionary changes in density-dependent movement (see also Fronhofer et al., 2015b), that is, velocity as a function of relative population density (N
ˆ
N). Correlating population densities and movement may be challenging:
for instance, low densities due to declining or growing populations may lead to very different movement decisions, as protists likely base movement decisions on chemical cues (Fronhofer et al., 2015b). We therefore determined whether there was an indication for a decay phase towards the end of the growth experiments by additionally fitting a logistic model that allows for decaying population densities. This growth model follows Eq. 1, however it assumes thatαii=α0(1 +β(t−tcrit)) ift > tcrit whereα0 is a
baseline competitive ability,β the rate at which competition increases over time (t) andtcritthe critical
time point from which on the increase in competition (respectively decrease in equilibrium density) occurs. Based on these analyses, we excluded all movement data of day 7 of the growth experiment onwards as both mean and median values oftcritestimates were approx. 7 days.
Statistical analyses
All data were analysed statistically using the R environment for statistical computing (version 3.3.2) and linear mixed models (function ‘lme’; ‘nlme’ package). Response variables were appropriately transformed to satisfy model assumptions. Statistical analyses were performed across all strains simultaneously as the different genetic backgrounds represent the biologically relevant replicates in contrast to the technical replicates within each strain. This nested replication structure was accounted for in the random effects. The data are available at Dryad (http://dx.doi.org/xxxxx).
More specifically, movement velocity (log transformed) change during the experiment was analysed using individual based velocity data with ‘time’ within ‘replicate’ and ‘strain ID’ as a random effect structure to account for the non-independence of individuals measured in one sample as well as the temporal non-independence of the repeated measures through time. Following Crawley (2013), we started with the full model including an interaction between the two explanatory variables ‘time’ and ‘range position’ and subsequently simplified the model by removing explanatory variables to obtain the minimal adequate model. We used the ‘anova’ function and maximum likelihood (ML) estimates obtained with the ‘optim’ optimizer for model simplification. Subsequently, the minimal adequate model was refit using REML to obtain model estimates.
For the analysis of movement velocity (non-transformed) after the common garden phase the full model included ‘time’ (end of evolution experiment, common garden 1, common garden 2) and ‘range border position’ as interacting fixed effects as well as ‘time’ within ‘replicate’ within ‘strain ID’ as random effects. Model simplification was carried out as described above.
Density-dependent movement (log transformed) was analysed analogously using ‘population density’ and ‘population history’ (range border position and starting populations) as interacting fixed effects in the full model and ‘population density’ within ‘replicate’ within ‘strain ID’ as random effects. The analysis of population growth rates (r0; log transformed) and competition coefficients (αii; inverse transformed)
included only ‘population history’ (range border position and starting populations) as a fixed effect as well as ‘strain ID’ as a random effect.
Finally, potential differences between failed and successful range expansions, that is, experimental replicates in which the range margin failed to expand and went extinct versus those that kept up with our experimental treatment, were explored by correlating growth rates (r0; inverse transformed), competition
coefficients (αii; inverse transformed) as well as median and standard deviation of movement velocity of
the starting populations (respectively log and inverse transformed) with invasion success (yes/ no). As a random effect we included ‘strain ID’.
Results
Range expansion success
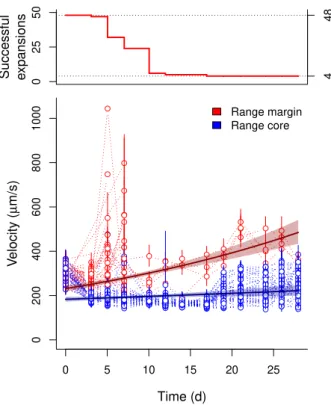
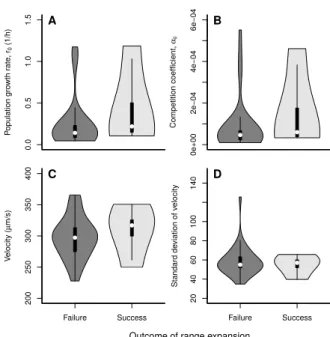
As expected, successful range expansions were rare: out of 48 replicated range expansions only 4 replicates belonging to three clonal strains (Fig. 1; upper panel) successfully tracked our experimental treatment and expanded their range over the entire duration of the experiment. All other replicates of both clonal strains and the genetically mixed population only tracked the range expansion over part of the experimental duration and subsequently went extinct at the range margin. The four successfully expanding replicates
did, at the start of the experiment, not statistically differ from all other stains based on their initial properties (Fig. S2). 0 25 50 4 48 0 200 400 600 800 1000 Range margin Range core 0 5 10 15 20 25 Time (d) V elocity ( µ m/s) Successful expansions ● ● ● ● ● ● ● ● ● ● ● ● ● ● ● ● ● ● ● ● ● ● ● ● ● ● ● ● ● ● ● ● ● ● ● ● ● ● ● ● ● ● ● ● ● ● ● ● ● ● ● ● ● ● ● ● ● ● ● ● ● ● ● ● ● ● ● ● ● ● ● ● ● ● ● ● ● ● ● ● ● ● ● ● ● ● ● ● ● ● ● ● ● ● ● ● ● ● ● ● ● ● ● ● ● ● ● ● ● ● ● ● ● ● ● ● ● ● ● ● ● ● ● ● ● ● ● ● ● ● ● ● ● ● ● ● ● ● ● ● ● ● ● ● ● ● ● ● ● ● ● ● ● ● ● ● ● ● ● ● ● ● ● ● ● ● ● ● ● ● ● ● ● ● ● ● ● ● ● ● ● ● ● ● ● ● ● ● ● ● ● ● ● ● ● ● ● ● ● ● ● ● ● ● ● ● ● ● ● ● ● ● ● ● ● ● ● ● ● ● ● ● ● ● ● ● ● ● ● ● ● ● ● ● ● ● ● ● ● ● ● ● ● ● ● ● ● ● ● ● ● ● ● ● ● ● ● ● ● ● ● ● ● ● ● ● ● ● ● ● ● ● ● ● ● ● ● ● ● ● ● ● ● ● ● ● ● ● ● ● ● ● ● ● ● ● ● ● ● ● ● ● ● ● ● ● ● ● ● ● ● ● ● ● ● ● ● ● ● ● ● ● ● ● ● ● ● ● ● ● ● ● ● ● ● ● ● ● ● ● ● ● ● ● ● ● ● ● ● ● ● ● ● ● ● ● ● ● ● ● ● ● ● ● ● ● ● ● ● ● ● ● ● ● ● ● ● ● ● ● ● ● ● ● ● ● ● ● ● ● ● ● ● ● ● ● ● ● ● ● ● ● ● ● ● ● ● ● ● ● ● ● ● ● ● ● ● ● ● ● ● ● ● ● ● ● ● ● ● ● ● ● ● ● ● ● ● ● ● ● ● ● ● ● ● ● ● ● ● ● ● ● ● ● ● ● ● ● ● ● ● ● ● ● ● ● ● ● ● ● ● ● ● ● ● ● ● ● ● ● ● ● ● ● ● ● ● ● ● ● ● ● ● ● ● ● ● ● ● ● ● ● ● ● ● ● ● ● ● ● ● ● ● ● ● ● ● ● ● ● ● ● ● ● ● ● ● ● ● ● ● ● ● ● ● ● ● ● ● ● ● ● ● ● ● ● ● ● ● ● ● ● ● ● ● ● ● ● ● ● ● ● ● ● ● ● ● ● ● ● ● ● ● ● ● ● ● ● ● ● ● ● ● ● ● ● ● ● ● ● ● ● ● ● ● ● ● ● ● ● ● ● ● ● ● ● ● ● ● ● ● ● ● ● ● ● ● ● ● ● ● ● ● ● ● ● ● ● ● ● ● ● ● ● ● ● ● ● ● ● ● ● ● ● ● ● ● ● ● ● ● ● ● ● ● ● ● ● ● ● ● ● ● ● ● ● ● ● ● ● ● ● ● ● ● ● ● ● ● ● ● ● ● ● ● ● ● ● ● ● ● ● ● ● ● ● ● ● ● ● ● ● ● ● ● ● ● ● ● ● ● ● ● ● ● ● ● ● ● ● ● ● ● ● ● ● ● ● ● ● ● ● ● ● ● ● ● ● ● ● ● ●
Figure 1: Temporal dynamics of movement velocity during range expansions. While most replicates did not expand their range and went extinct (upper panel), four replicates belonging to three different strains successfully expanded and increased in movement velocity (lower panel). Points and error lines show medians and interquartile ranges of the individual-based velocity data for each replicate separately. We additionally show estimates (solid lines) and confidence intervals (shaded area) obtained from the minimal adequate models correlating velocity and time for range cores (blue) and margins (red).
Evolution of movement
All four successfully expanding replicates showed increased movement velocity during the experimental evolution phase at the range margin (Fig. 1; LMM; minimal adequate model: time x position; intercept difference core - margin: t=−63.65,d.f.= 199403,p <0.001; slope margin: t= 183.11,d.f.= 199403,
p <0.001; slope difference core-margin: t=−72.38,d.f.= 199403,p <0.001). Individuals in populations
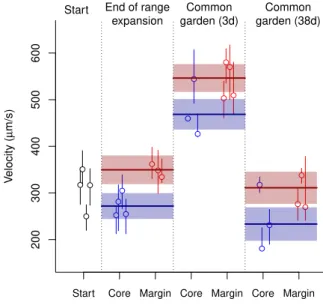
at the range margin were on average 1.29 times faster than individuals in the range core (comparison of estimates; Fig. 2). Overall, these differences could be shown to be stable both after a three day common garden (approx. 10 to 20 doubling time periods based on the estimates of r0 in Tab. S1) as well as
after an additional month of selection for competitive ability in a common garden setting, thus indicating evolutionary change (Fig. 2; LMM; minimal adequate model: time + position; difference margin - core:
d.f.= 6,p <0.001; difference common garden 1 - common garden 2: t=−14.54,d.f.= 6, p <0.001). 200 300 400 500 600
Start Core Margin Core Margin Core Margin
Range position
V
elocity (
µ
m/s)
Start End of range expansion Common garden (3d) Common garden (38d) ● ● ● ● ● ● ● ● ● ● ● ● ● ● ● ● ● ● ● ● ● ● ● ●
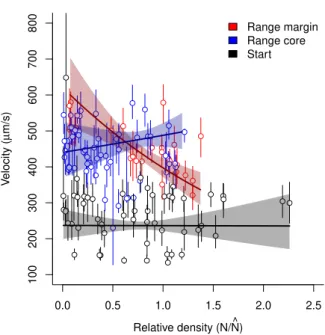
Figure 2: Evolutionary differences in movement velocity between range cores and range margins for the replicates that successfully expanded their range. The increased movement velocity at the range margin at the end of the range expansion (see also Fig. 1) was stable after both the 3-day common garden and the 1-month common garden. Points and error lines show medians and interquartile ranges of the individual-based velocity data for each replicate separately. We additionally show estimates (solid lines) and confidence intervals (shaded area) obtained from the minimal adequate model comparing velocity in rage cores and margins at the three represented time points. Note that velocity at the start of the experiment (black points) is only shown as a visual reference and not included in the statistical analysis. The successfully expanding replicates did not only show differences in movement after the two common garden periods, which captures evolutionary change only under one specific environmental condition (low densities). In line with our predictions, we also found differences in movement between range core and range margin populations across a large spectrum of population densities (up to two-fold equilibrium den-sity; Fig. 3). The slope of the density-dependent movement reaction norm for range margin populations was negative in comparison to the density-dependent movement reaction norm for range core popula-tions which tended to be slightly positively density-dependent (Fig. 3; LMM on log-transformed data; minimal adequate model: density x history; intercept difference core - margin: t=−16.39,d.f.= 29608,
p < 0.001; intercept difference start - margin: t = −66.96, d.f. = 29608, p < 0.001; slope margin:
t = −4.07, d.f. = 29608, p < 0.001; slope difference core-margin: t = 24.09, d.f. = 29608, p <0.001;
slope difference start-margin: t= 32.67,d.f.= 29608,p <0.001).
While the differences in intercept observed here recapture the results depicted in Fig. 2, the estimated slopes suggest that density-dependence of movement only evolved at the range margin and did not change in the range core in comparison to the ancestral populations. The estimated slopes for range core and start populations both have confidence intervals that strongly overlap with zero (slope range core: 0.10
0.0 0.5 1.0 1.5 2.0 2.5 100 200 300 400 500 600 700 800 ●● ● ● ● ● ● ● ● ● ● ● ● ● ● ● ● ● ● ● ● ● ● ● ● ● ● ● ● ● ● ● ● ● ● ● ● ● ● ● ● ● ● ●● ● ● ● ● ● ● ● ● ● ● ● ● ● ● ● ●●● ● ● ● ● ● ● ● ● ● ● ● ● ● ● ● ● ● ● ● ● ● ● ● ● ● ● ● ● ● ● ● ● ● ● ● ● ● ● ● ● ● ● ● ● ● ● ● ● ● ● ● ● ● ● ● ● ● ● ● ● ● ● ● ● ● ● ● ● ● ● ● ● ● ● ● Relative density (N/N^) V elocity ( µ m/s) Range margin Range core Start
Figure 3: Evolution of density-dependent movement in range cores and at range margins for the replicates that successfully expanded their range. While the shifts in intercept, that is, movement at low densities, recapture the results depicted in Fig. 2, the slope of the density-dependent movement reaction norm is clearly negative at the range margin while it is not significantly different from zero for both range core and starting populations. Points and error lines show medians and interquartile ranges of the individual-based velocity data recorded after the 3-day common garden phase. We additionally show estimates (solid lines) and confidence intervals (shaded area) obtained from the minimal adequate model of the density-dependent movement reaction norm. The x-axis captures the relative density, that is, population size (N) divided by the equilibrium population size ( ˆN) estimated by fitting Eq. 1.
(-0.12, 0.32); slope start population: -0.0028 (-0.2166, 0.2113); values represent estimates as well as lower and upper CI for log-transformed data extracted from the minimal adequate model), suggesting no density-dependence. By contrast, the slope of the density-dependent movement reaction norm for the range margin populations is clearly negative (slope range margin: -0.45 (-0.47, -0.42)).
Evolution of population growth rate and competitive ability
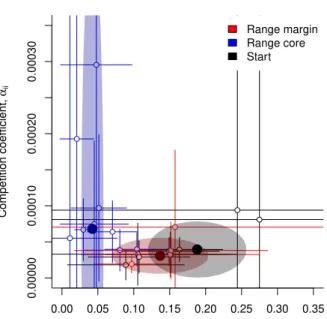
Besides evolutionary changes in density-dependent movement, we could find clear differences in population growth rates after the common garden phase between range core and range margin (Fig. 4). Range margin populations exhibited population growth rates that were on average 3.2 times higher than range core populations (Tukey Post-Hoc test after LMM on log transformed data; core - margin: z=−2.82,
N = 22, p = 0.013). Interestingly, while the difference between population growth rates at the range margin and in the starting populations was not significant (Tukey Post-Hoc test after LMM on log transformed data; core - margin: z = 0.77, N = 22, p= 0.72) the difference between range core and start was (Tukey Post-Hoc test after LMM on log transformed data; core - margin: z=−2.82, N = 22,
0.00 0.05 0.10 0.15 0.20 0.25 0.30 0.35
0.00000
0.00010
0.00020
0.00030
Population growth rate, r0 (1/h)
Competition coefficient, αii ● ● ● ● ● ● ● ● ● ● ● ● ● ● ● ● ● ● ● ● ● Range margin Range core Start ● ● ●
Figure 4: Concurrent evolution of population growth rates (r0) and competition coefficients (αii) in
range cores and at range margins for the replicates that successfully expanded their range. Range core population showed increased competitive abilities and concurrently decreased population growth rate in comparison to range margins and the starting population. Points and error lines show estimates and confidence intervals of growth rates (r0) and competition coefficients (αii) obtained from fitting the
logistic growth model (Eq. 1) to data of population growth experiments performed after the 3-day common garden phase. We additionally show estimates (large filled points) and confidence intervals (shaded area) obtained from the minimal adequate model comparing population growth rate and competition coefficient between range cores, margins and the starting populations.
Conversely to population growth rate patterns, range core populations showed a tendency for increased competitive ability in comparison to range margin populations (average increase of 2.2 fold, however with strongly overlapping confidence intervals; Tukey Post-Hoc test after LMM on inverse transformed data; core - margin: z = −2.98, N = 22, p = 0.008). Again, range core populations tended to differ from
the starting populations (Tukey Post-Hoc test after LMM on inverse transformed data; core - margin:
z= 2.28,N = 22,p= 0.058), while range margin populations did clearly not (Tukey Post-Hoc test after LMM on inverse transformed data; start - margin: z=−1.20,N = 22,p= 0.45).
Discussion
We investigated evolutionary differentiation between range core and range margin populations using highly controlled and replicated range expansions of both clonalTetrahymena thermophilastrains without initial standing genetic variation as well as a mix of all strains. Our experimental results provide evidence of rapidly emerging evolutionary differences in movement reaction norms, population growth rates and competitive ability during range expansions.
As expected, successful range expansions (Fig. 1) occurred relatively rarely (4 out of 48 replicates). All other range margin populations went extinct at some point during the temporally advancing range propagation and ultimately failed to expand their range (Fig. 1). It is interesting to note that we did not observe successful range expansions in the replicates that harboured initial standing genetic variation. Furthermore, we could not identify any common attributes of the strains that successfully expanded their range, which is in good accordance with previous findings highlighting the intrinsically stochastic and variable nature of range expansions, both in an ecological (Melbourne & Hastings, 2009; Giomettoet al., 2013) and evolutionary context (Ochocki & Miller, 2017; Weiss-Lehmanet al., 2017).
Range expansions can lead to trait evolution even in the absence of initial
standing genetic variation.
Evolution of increased dispersal at range margins due to spatial selection (Phillipset al., 2010) and po-tentially kin competition (Kubischet al., 2013) has been recognized to impact range expansion dynamics theoretically (Kubischet al., 2014) as well as in empirical studies (Fronhofer & Altermatt, 2015; Williams
et al., 2016; Wagner et al., 2017; Ochocki & Miller, 2017; Weiss-Lehman et al., 2017; Fronhofer et al., 2017). We here explored the relevance of spatial selection for systems that do not initially harbour high amounts of standing genetic variation. Our results may therefore be relevant in the context of invasions of non-native organisms, which, in contrast to expansions of a species’ ranges starting from a large and potentially diverse core habitat, may often start with a colonization event involving one or very few individuals and therefore may exhibit very little standing genetic variation (e.g., Tsutsuiet al.2000; but see also Roman & Darling 2007 and Dlugosch & Parker 2008). Given the ecological and economical rel-evance of invasive species (Pimentelet al., 2000), a better understanding of the underlying evolutionary dynamics is highly valuable.
We show that differentiation between range cores and range margins in movement and other life-history traits (population growth rate and competitive ability) is possible in a relatively short time (13 discrete dispersal and population growth phases; the growth phases correspond to approx. 10 to 20 doubling time periods based on the estimates of r0 in Tab. S1) even without initial standing genetic
variation (Figs. 2 – 4). In our study system rapid evolution in asexually reproducing lines does not seem fundamentally surprising, as mutation rates are relatively high in T. thermophila: Brito et al. (2010) performed mutation accumulation experiments and report that the observed extinction rate is two to three orders of magnitude higher than in comparable experiments with yeast and bacteria. These high rates are likely due to gain and loss of chromosomes that typically occur during the amitotic division of the macronucleus (Britoet al., 2010).
More generally, our findings fit well into the current invasion literature: For instance, Dlugosch & Parker (2008) discuss the invasive plant Hypericum canariense which shows evidence for the evolution of increased growth rates (survival and reproduction) and local adaptation in flowering time in invasive populations despite bottleneck events. Furthermore, genetic diversity does not seem to consistently predict invasion success in nature (Roman & Darling, 2007; Dlugosch & Parker, 2008), which is also consistent with our findings, especially with the failure to expand in the replicates that exhibited standing genetic variation. More generally, that only 4 out of a total of 48 replicates managed to successfully expand their range, fits well with the idea that only a small fraction of introduced and established species, likely orders of magnitude less (the ‘tens rule’; Williamson & Fitter, 1996), become invasive. As Roman & Darling (2007) note, those that do become invasive may not exhibit a general loss of diversity, which is well captured by our results, as those replicates that did expand their range overall showed diversification in life-history traits between core and margin (Fig. 2 and 4).
Besides being applicable to biological invasions, our results and conclusions are potentially relevant to climate- or generally environmental change-driven range expansions. Our experimental procedure basically simulates a shifting window of suitable habitat for the range margin as is often done in theoret-ical studies (e.g. Henryet al., 2013). Figure 1 highlights that, despite most often leading to extinction, evolutionary change (Fig. 2) can potentially prevent these marginal populations from going extinct (evo-lutionary rescue; Bell & Gonzalez, 2011; Low-D´ecarie et al., 2015). Such an interpretation is of course speculative, as we cannot determine whether evolutionary change happened because of the range expan-sions (spatial selection) or if evolutionary change allowed for the range expansion to happen in the first place.
Evolution during range expansions changes the density-dependent movement
reaction norm.
Our work shows that movement and dispersal evolution at expanding range margins does not only impact average movement and dispersal probabilities, but changes the shape of the density-dependent movement reaction norm (Fig. 3). Theory predicts that dispersal should increase even at low densities at expanding range margins, that is, become less positively density-dependent (Traviset al., 2009) because conspecific density looses its value as a cue for context-dependent dispersal. Since potential target patches for range margin populations tend to be empty, dispersal is advantageous already at low densities and an unconditional dispersal strategy will be less costly (Bonte et al., 2012) as energy and time do not have to be invested in information collection and processing.
Sub-sequently, individuals in the range core conserved this density-independent movement strategy, while individuals at the range margin clearly evolved increased movement at low densities (Fig. 3) thereby changing the slope from lightly positive or neutral to negative. Our experimental results therefore sub-stantiate the theoretical predictions of Traviset al. (2009) and are in accordance with recent empirical work that suggested a weakening of the slope of density-dependent dispersal function in an insect sys-tem (Weiss-Lehmanet al., 2017). We can only speculate what led to the overall increase in movement (intercepts) when comparing starting populations and populations after the first common garden (Fig. 2 and 3). Due to the high rates of resource replenishment we chose to avoid evolution in the resources, this shift, which is reversed in the second common garden (Fig. 2), may be due to increased resource availability during the experimental evolution phase.
Range expansions lead to the evolution of increased competitive ability and
decreased population growth rates in range cores.
While dispersal is a central and potentially independent life-history trait of major importance for spatial dynamics (Bonte & Dahirel, 2017), other life-history traits, such as reproduction may evolve concurrently or even trade-off with dispersal (e.g. Burton et al., 2010; Fronhofer et al., 2011; Stevens et al., 2014; Fronhofer & Altermatt, 2015). Our results show that not only movement capacities but also reproductive rates and competitive abilities can evolve during range expansions and biological invasions (Fig. 4). Substantiating theoretical predictions (e.g. Burtonet al., 2010), we experimentally find higher population growth rates at the range margin in comparison to range core populations. While the slope of the movement reaction norm showed evolutionary change in comparison to the starting population only at the range margin, it is populations in the range core that exhibited lower population growth rates in comparison to populations at the range margin and the starting population and not vice versa. At the same time, we observe higher competitive abilities in range core populations, which hints at a trade-off between competitive ability and population growth rates.
Our results regarding the evolution of population growth and competitive ability, as well as previous findings in a similar system (Fronhofer et al., 2017), are opposed to some recent experimental investi-gations reporting lower reproduction, respectively investment in population growth at the range margin (Fronhofer & Altermatt, 2015; Weiss-Lehmanet al., 2017) or no effect on reproduction (Ochocki & Miller, 2017). While this heterogeneity in results may be linked to differences in resource dynamics in the exper-iments (Fronhofer & Altermatt, 2015; Fronhoferet al., 2017), it also hints at the potential evolutionary independence of dispersal from other life-history traits (Bonte & Dahirel, 2017). Clearly, more conceptual and experimental research is needed to provide synthesis on these questions.
Conclusions
We present experimental evidence showing that range expansions lead to the evolution of increased move-ment at low densities at range margins in comparison to range cores due to evolutionary changes in the density-dependent movement reaction norm. Movement evolved to be negatively density-dependent at the range margin. Additionally, we observed concurrent changes in life-history traits towards lower pop-ulation growth rates and higher competitive abilities in the range core. Importantly, these evolutionary changes emerged de novo in our experiments and did not require initial standing genetic variation. Our results suggest that evolution of increased movement at range margins may allow individuals to track their climatic niche by adapted dispersal and growth strategies. Furthermore, although rare, evolution can favour the spread of invasive species, even if standing genetic variation is initially low.
Author contributions
E.A.F. and F.A. designed the research; E.A.F. and S.G. performed the experiments; E.A.F. analysed the data and outlined the manuscript; all authors contributed to writing.
Acknowledgements
E.A.F. and F.A. thank Eawag and the Swiss National Science Foundation (grant no. PP00P3 150698 to FA) for funding. We are grateful to Felix Moerman for comments on a previous version of the manuscript.
References
Altermatt, F., Fronhofer, E.A., Garnier, A., Giometto, A., Hammes, F., Klecka, J., Legrand, D., M¨achler, E., Massie, T.M., Plebani, M., Pennekamp, F., Pontarp, M., Schtickzelle, N., Thuillier, V. & Petchey, O.L. 2015. Big answers from small worlds: a user’s guide for protist microcosms as a model system in ecology and evolution. Methods Ecol. Evol.6: 218–231.
Bell, G. & Gonzalez, A. 2011. Adaptation and evolutionary rescue in metapopulations experiencing environmental deterioration. Science 332: 1327–1330.
Best, A.S., Johst, K., Munkemuller, T. & Travis, J.M.J. 2007. Which species will succesfully track climate change? the influence of intraspecific competition and density dependent dispersal on range shifting dynamics. Oikos 116: 1531–1539.
Bonte, D. & Dahirel, M. 2017. Dispersal: a central and independent trait in life history. Oikos 126: 472–479.
Bonte, D., Van Dyck, H., Bullock, J.M., Coulon, A., Delgado, M., Gibbs, M., Lehouck, V., Matthysen, E., Mustin, K., Saastamoinen, M., Schtickzelle, N., Stevens, V.M., Vandewoestijne, S., Baguette, M., Barto´n, K., Benton, T.G., Chaput-Bardy, A., Clobert, J., Dytham, C., Hovestadt, T., Meier, C.M., Palmer, S.C.F., Turlure, C. & Travis, J.M.J. 2012. Costs of dispersal. Biol. Rev.87: 290–312. Bowler, D.E. & Benton, T.G. 2005. Causes and consequences of animal dispersal strategies: relating
individual behaviour to spatial dynamics. Biol. Rev.80: 205–225.
Brito, P., Guilherme, E., Soares, H. & Gordo, I. 2010. Mutation accumulation in Tetrahymena. BMC Evol. Biol.10: 354.
Burton, O.J., Pillips, B.L. & Travis, J.M.J. 2010. Trade-offs and the evolution of life-histories during range expansion. Ecol. Lett.13: 1210–1220.
Cassidy-Hanley, D.M. 2012. Tetrahymena in the laboratory: Strain resources, methods for culture, maintenance, and storage. Methods Cell Biol.109: 237–276.
Clobert, J., Le Galliard, J.F., Cote, J., Meylan, S. & Massot, M. 2009. Informed dispersal, heterogeneity in animal dispersal syndromes and the dynamics of spatially structured populations. Ecol. Lett. 12: 197–209.
Crawley, M.J. 2013. The R Book. John Wiley & Sons Inc, Southern Gate, Chichester, UK.
Dlugosch, K. & Parker, I. 2008. Founding events in species invasions: genetic variation, adaptive evolution, and the role of multiple introductions. Mol. Ecol.17: 431–449.
Excoffier, L., Foll, M. & Petit, R.J. 2009. Genetic consequences of range expansions. Annu. Rev. Ecol. Evol. Syst.40: 481–501.
Fjerdingstad, E., Schtickzelle, N., Manhes, P., Gutierrez, A. & Clobert, J. 2007. Evolution of dispersal and life history strategies — Tetrahymenaciliates. BMC Evol. Biol. 7: 133.
Friman, V.P., Laakso, J., Koivu-Orava, M. & Hiltunen, T. 2011. Pulsed-resource dynamics increase the asymmetry of antagonistic coevolution between a predatory protist and a prey bacterium. J. Evol. Biol.24: 2563–2573.
Fronhofer, E.A. & Altermatt, F. 2015. Eco-evolutionary feedbacks during experimental range expansions.
Fronhofer, E.A., Klecka, J., Meli´an, C. & Altermatt, F. 2015a. Condition-dependent movement and dispersal in experimental metacommunities. Ecol. Lett.18: 954–963.
Fronhofer, E.A., Kropf, T. & Altermatt, F. 2015b. Density-dependent movement and the consequences of the allee effect in the model organismTetrahymena. J. Anim. Ecol.84: 712–722.
Fronhofer, E.A., Kubisch, A., Hovestadt, T. & Poethke, H.J. 2011. Assortative mating counteracts the evolution of dispersal polymorphisms. Evolution 65: 2461–2469.
Fronhofer, E.A., Nitsche, N. & Altermatt, F. 2017. Information use shapes the dynamics of range expansions into environmental gradients. Glob. Ecol. Biogeogr.26: 400–411.
Giometto, A., Altermatt, F., Carrara, F., Maritan, A. & Rinaldo, A. 2013. Scaling body size fluctuations.
Proc. Natl. Acad. Sci. U. S. A. 110: 4646–4650.
Giometto, A., Altermatt, F. & Rinaldo, A. in press. Demographic stochasticity and resource autocorre-lation control biological invasions in heterogeneous landscapes. Oikos.
Giometto, A., Rinaldo, A., Carrara, F. & Altermatt, F. 2014. Emerging predictable features of replicated biological invasion fronts. Proc. Natl. Acad. Sci. U. S. A. 111: 297–301.
Gralka, M., Stiewe, F., Farrell, F., Mbius, W., Waclaw, B. & Hallatschek, O. 2016. Allele surfing promotes microbial adaptation from standing variation. Ecol. Lett.19: 889–898.
Haag, C.R., Saastamoinen, M., Marden, J.H. & Hanski, I. 2005. A candidate locus for variation in dispersal rate in a butterfly metapopulation. Proc. R. Soc. B-Biol. Sci.272: 2449–2456.
Hallatschek, O., Hersen, P., Ramanathan, S. & Nelson, D.R. 2007. Genetic drift at expanding frontiers promotes gene segregation. Proc. Natl. Acad. Sci. U. S. A.104: 19926–19930.
Hanski, I. 2012. Eco-evolutionary dynamics in a changing world. Ann. N. Y. Acad. Sci.1249: 1–17. Henry, R.C., Bocedi, G. & Travis, J.M. 2013. Eco-evolutionary dynamics of range shifts: Elastic margins
and critical thresholds. J. Theor. Biol.321: 1–7.
Hiltunen, T. & Becks, L. 2014. Consumer co-evolution as an important component of the eco-evolutionary feedback. Nat. Commun.5: 5226.
Kubisch, A., Fronhofer, E.A., Poethke, H.J. & Hovestadt, T. 2013. Kin competition as a major driving force for invasions. Am. Nat.181: 700–706.
Kubisch, A., Holt, R.D., Poethke, H.J. & Fronhofer, E.A. 2014. Where am I and why? Synthesising range biology and the eco-evolutionary dynamics of dispersal. Oikos 123: 5–22.
Kubisch, A., Poethke, H.J. & Hovestadt, T. 2011. Density-dependent dispersal and the formation of range borders. Ecography 34: 1002–1008.
Lombaert, E., Estoup, A., Facon, B., Joubard, B., Grgoire, J.C., Jannin, A., Blin, A. & Guillemaud, T. 2014. Rapid increase in dispersal during range expansion in the invasive ladybirdHarmonia axyridis.
J. Evol. Biol. 27: 508–517.
Low-D´ecarie, E., Kolber, M., Homme, P., Lofano, A., Dumbrell, A., Gonzalez, A. & Bell, G. 2015. Community rescue in experimental metacommunities. Proc. Natl. Acad. Sci. U. S. A. 112: 14307– 14312.
Melbourne, B.A. & Hastings, A. 2009. Highly variable spread rates in replicated biological invasions: fundamental limits to predictability. Science 325: 1536–1539.
Ochocki, B.M. & Miller, T.E.X. 2017. Rapid evolution of dispersal ability makes biological invasions faster and more variable. Nat. Commun.8: 14315.
Pennekamp, F., Mitchell, K.A., Chaine, A.S. & Schtickzelle, N. 2014. Dispersal propensity inTetrahymena thermophila ciliates — a reaction norm perspective. Evolution 68: 2319–2330.
Pennekamp, F., Schtickzelle, N. & Petchey, O.L. 2015. Bemovi, software for extracting behavior and morphology from videos, illustrated with analyses of microbes. Ecol. Evol.5: 2584–2595.
Perkins, A.T., Phillips, B.L., Baskett, M.L. & Hastings, A. 2013. Evolution of dispersal and life history interact to drive accelerating spread of an invasive species. Ecol. Lett.16: 1079–1087.
Phillips, B.L., Brown, G.P. & Shine, R. 2010. Life-history evolution in range-shifting populations.Ecology
91: 1617–1627.
Phillips, B.L., Brown, G.P., Webb, J.K. & Shine, R. 2006. Invasion and the evolution of speed in toads.
Nature 439: 803–803.
Pimentel, D., Lach, L., Zuniga, R. & Morrison, D. 2000. Environmental and economic costs of nonindige-nous species in the united states. BioScience 50: 53–65.
Roman, J. & Darling, J.A. 2007. Paradox lost: genetic diversity and the success of aquatic invasions.
Trends Ecol. Evol.22: 454–464.
Ronce, O. 2007. How does it feel to be like a rolling stone? Ten questions about dispersal evolution.
Saastamoinen, M., Bocedi, G., Cote, J., Legrand, D., Guillaume, F., Wheat, C., Fronhofer, E.A., Garcia, C., Henry, R., Husby, A., Baguette, M., Bonte, D., Coulon, A., Kokko, H., Matthysen, E., Niitepld, K., Nonaka, E., Stevens, V., Travis, J.M.J., Donohue, K., Bullock, J. & del Mar Delgado, M. submitted. Genetics of dispersal. Biol. Rev.
Stevens, V.M., Whitmee, S., Le Galliard, J.F., Clobert, J., B¨ohning-Gaese, K., Bonte, D., Br¨andle, M., Matthias Dehling, D., Hof, C., Trochet, A. & Baguette, M. 2014. A comparative analysis of dispersal syndromes in terrestrial and semi-terrestrial animals. Ecol. Lett.17: 1039–1052.
Thomas, C.D., Bodsworth, E.J., Wilson, R.J., Simmons, A.D., Davies, Z.G., Musche, M. & Conradt, L. 2001. Ecological and evolutionary processes at expanding range margins. Nature 411: 577–581. Travis, J.M.J., Mustin, K., Benton, T.G. & Dytham, C. 2009. Accelerating invasion rates result from the
evolution of density-dependent dispersal. J. Theor. Biol.259: 151–158.
Tsutsui, N.D., Suarez, A.V., Holway, D.A. & Case, T.J. 2000. Reduced genetic variation and the success of an invasive species. Proc. Natl. Acad. Sci. U. S. A.97: 5948–5953.
Verhulst, P.F. 1838. Notice sur la loi que la population suit dans son accroissement. Correspondance Math´ematique et Physique 10: 113–121.
Wagner, N.K., Ochocki, B.M., Crawford, K.M., Compagnoni, A. & Miller, T.E. 2017. Genetic mixture of multiple source populations accelerates invasive range expansion. J. Anim. Ecol.86: 21–34. Weiss-Lehman, C., Hufbauer, R.A. & Melbourne, B.A. 2017. Rapid trait evolution drives increased speed
and variance in experimental range expansions. Nat. Commun. 8: 14303.
Williams, J.L., Kendall, B.E. & Levine, J.M. 2016. Rapid evolution accelerates plant population spread in fragmented experimental landscapes. Science 353: 482–485.
Supporting Information
E.A. Fronhofer, S. Gut and F. Altermatt:
Evolution of density-dependent movement during
replicated experimental range expansions
Figure S1: Experimental setup as used here and in Fronhofer & Altermatt (2015). As described in the main text, we effectively tracked range cores (represented in blue) and range margins (represented in red) in a constantly moving time window. While we have chosen this approach for convenience and feasibility and the experimental procedure obviously prevents feedbacks between core and margin populations, our results are not altered if we indeed use long interconnected linear landscapes (Fronhoferet al., 2017). Note that the colors (black for the starting population, blue for the range core and red for the range margin) do not represent any information on genetic background or trait differences. The colors should simply be seen as labels for the spatial location of the populations and are the same as used in the main text.
2
.
CC-BY 4.0 International license The copyright holder for this preprint (which was.
http://dx.doi.org/10.1101/114330
0.0 0.5 1.0 1.5 P opulation gro wth r ate , r0 (1/h) ● ● A 0e+00 2e − 04 4e − 04 6e − 04 Competition coefficient, αii ● ● B 200 250 300 350 400 V elocity ( µ m/s) ● ● Failure Success C 20 40 60 80 100 140 Standard de viation of v elocity ● ● Failure Success D
Outcome of range expansion
Figure S2: Differences between successful and failed range expansions. The statistical analysis (r0: LMM on inverse transformed data; t =−1.073305, d.f. = 25, p= 0.2934; αii: LMM on inverse transformed
data; t =−1.052423, d.f.= 25, p= 0.3027; median start velocity: LMM on inverse transformed data; t=−0.7424,d.f.= 25,p= 0.4648; s.d. start velocity: LMM on inverse transformed data; t= 1.608692, d.f.= 25,p= 0.1202) did not detect any differences in strain properties at the start of the experiment between failed an successful range expansions. The violin plots show medians (white dot), the 25th and 75th percentile (box) and the kernel density.
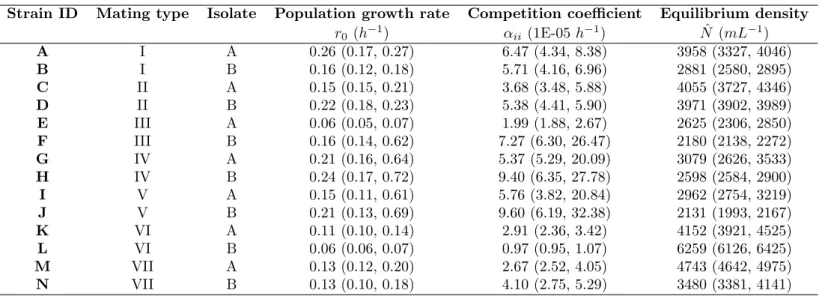
Table S1: Strain characteristics: population dynamics. We report median and quartiles of 3 replicates.
Strain ID Mating type Isolate Population growth rate Competition coefficient Equilibrium density
r0(h−1) αii (1E-05h−1) Nˆ (mL−1) A I A 0.26 (0.17, 0.27) 6.47 (4.34, 8.38) 3958 (3327, 4046) B I B 0.16 (0.12, 0.18) 5.71 (4.16, 6.96) 2881 (2580, 2895) C II A 0.15 (0.15, 0.21) 3.68 (3.48, 5.88) 4055 (3727, 4346) D II B 0.22 (0.18, 0.23) 5.38 (4.41, 5.90) 3971 (3902, 3989) E III A 0.06 (0.05, 0.07) 1.99 (1.88, 2.67) 2625 (2306, 2850) F III B 0.16 (0.14, 0.62) 7.27 (6.30, 26.47) 2180 (2138, 2272) G IV A 0.21 (0.16, 0.64) 5.37 (5.29, 20.09) 3079 (2626, 3533) H IV B 0.24 (0.17, 0.72) 9.40 (6.35, 27.78) 2598 (2584, 2900) I V A 0.15 (0.11, 0.61) 5.76 (3.82, 20.84) 2962 (2754, 3219) J V B 0.21 (0.13, 0.69) 9.60 (6.19, 32.38) 2131 (1993, 2167) K VI A 0.11 (0.10, 0.14) 2.91 (2.36, 3.42) 4152 (3921, 4525) L VI B 0.06 (0.06, 0.07) 0.97 (0.95, 1.07) 6259 (6126, 6425) M VII A 0.13 (0.12, 0.20) 2.67 (2.52, 4.05) 4743 (4642, 4975) N VII B 0.13 (0.10, 0.18) 4.10 (2.75, 5.29) 3480 (3381, 4141) 4 .
CC-BY 4.0 International license The copyright holder for this preprint (which was.
http://dx.doi.org/10.1101/114330
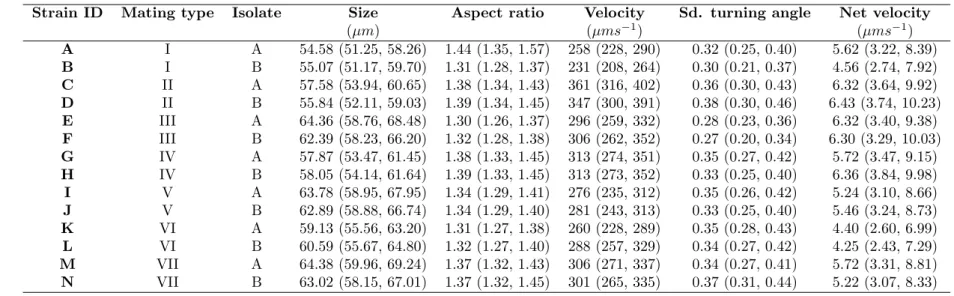
Table S2: Strain characteristics: morphology and Movement. We report median and quartiles of 3 replicates.
Strain ID Mating type Isolate Size Aspect ratio Velocity Sd. turning angle Net velocity
(µm) (µms−1) (µms−1) A I A 54.58 (51.25, 58.26) 1.44 (1.35, 1.57) 258 (228, 290) 0.32 (0.25, 0.40) 5.62 (3.22, 8.39) B I B 55.07 (51.17, 59.70) 1.31 (1.28, 1.37) 231 (208, 264) 0.30 (0.21, 0.37) 4.56 (2.74, 7.92) C II A 57.58 (53.94, 60.65) 1.38 (1.34, 1.43) 361 (316, 402) 0.36 (0.30, 0.43) 6.32 (3.64, 9.92) D II B 55.84 (52.11, 59.03) 1.39 (1.34, 1.45) 347 (300, 391) 0.38 (0.30, 0.46) 6.43 (3.74, 10.23) E III A 64.36 (58.76, 68.48) 1.30 (1.26, 1.37) 296 (259, 332) 0.28 (0.23, 0.36) 6.32 (3.40, 9.38) F III B 62.39 (58.23, 66.20) 1.32 (1.28, 1.38) 306 (262, 352) 0.27 (0.20, 0.34) 6.30 (3.29, 10.03) G IV A 57.87 (53.47, 61.45) 1.38 (1.33, 1.45) 313 (274, 351) 0.35 (0.27, 0.42) 5.72 (3.47, 9.15) H IV B 58.05 (54.14, 61.64) 1.39 (1.33, 1.45) 313 (273, 352) 0.33 (0.25, 0.40) 6.36 (3.84, 9.98) I V A 63.78 (58.95, 67.95) 1.34 (1.29, 1.41) 276 (235, 312) 0.35 (0.26, 0.42) 5.24 (3.10, 8.66) J V B 62.89 (58.88, 66.74) 1.34 (1.29, 1.40) 281 (243, 313) 0.33 (0.25, 0.40) 5.46 (3.24, 8.73) K VI A 59.13 (55.56, 63.20) 1.31 (1.27, 1.38) 260 (228, 289) 0.35 (0.28, 0.43) 4.40 (2.60, 6.99) L VI B 60.59 (55.67, 64.80) 1.32 (1.27, 1.40) 288 (257, 329) 0.34 (0.27, 0.42) 4.25 (2.43, 7.29) M VII A 64.38 (59.96, 69.24) 1.37 (1.32, 1.43) 306 (271, 337) 0.34 (0.27, 0.41) 5.72 (3.31, 8.81) N VII B 63.02 (58.15, 67.01) 1.37 (1.32, 1.45) 301 (265, 335) 0.37 (0.31, 0.44) 5.22 (3.07, 8.33) 5 .
CC-BY 4.0 International license The copyright holder for this preprint (which was.
http://dx.doi.org/10.1101/114330
References
Fronhofer, E.A. & Altermatt, F. 2015. Eco-evolutionary feedbacks during experimental range expansions.
Nat. Commun. 6: 6844.
Fronhofer, E.A., Nitsche, N. & Altermatt, F. 2017. Information use shapes the dynamics of range expansions into environmental gradients. Glob. Ecol. Biogeogr.26: 400–411.