
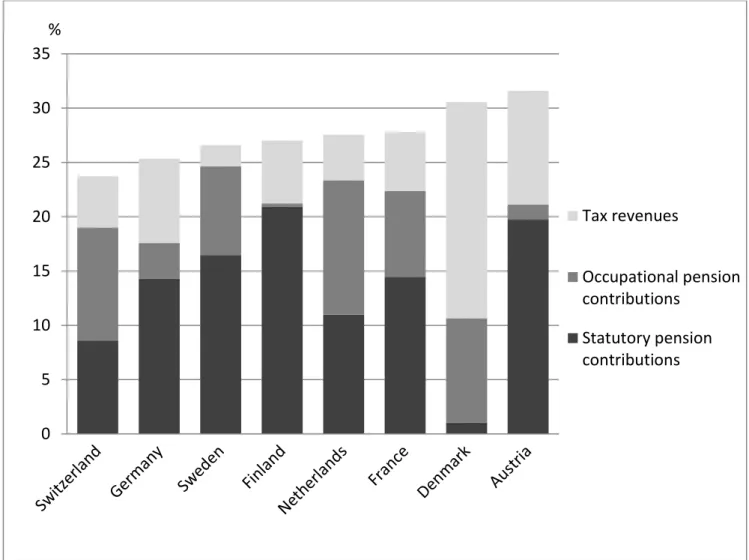
Pension system design and intergenerational redistribution : applying the Musgrave’s rule in a comparative setting
Full text
Figure
Related documents
Effect of Shared Managers, Board Members, Analysts, and Institutional Investors This table reports the results from linear probability models relating the likelihood that a
After looking at the plasmid map and also the lambda phage map, can you determine how many PstI restriction sites were added to the plasmid because of the inserted lambda phage
We find a pay- performance sensitivity in banks of $4.7 per $1,000 increase in shareholder value for the broader incentive-related measure of compensation; most of the sensitivity
Continuing the analysis using the concept of β− convergence, to which we add the appropriate spatial effects, it appears that all regions converge to the same steady-state in the
P9 l.8: The time horizon of the cost analysis is not clear: is the end of the cost calculation at the discharge of the index case and/or at the discharge of the last secondary
The discussion below draws out elements of the cross country comparison in relation to five areas, gender equality in access, progression and attainment at school, girls’ empowerment
respective nodes or edges are adapted during the execution of Algorithm 2, context nodes and edges will be re-evaluated as well, etc. By means of Algorithm 1 and 2, the
T cells expressed as a % of total lymphocytes are shown for lung (granuloma as well as non-granuloma) samples on the Y -axis for BCG-vaccinated (red) and sham- vaccinated (blue) NHPs
