SCADA Intrusion Detection System Test Framework
By: Henrik Waagsnes
Supervisor: Nils Ulltveit-Moe, Associate Professor Ph.D
IKT 590 - Master’s thesis Spring 2017
Department of Information and Communication Technology Faculty of Engineering and Science
University of Agder Grimstad, 21 May 2017
2
Abstract
Supervisory control and data acquisition (SCADA) systems play an important role in our critical infrastructure (CI). Several of the protocols used in SCADA communication are old and lack of security mechanisms. This master thesis presents a SCADA Intrusion Detection System Test Framework that can be used to simulate SCADA traffic and detect malicious network activity. The framework uses a signature-based approach and utilize two different IDS engines, Suricata and Snort. The IDS engines include rule-sets for the IEC 60870-5-104, DNP3 and Modbus protocols. The IDS engines ships detected events to a distributed cluster and visualize them using a web interface.
The experiments carried out in this project show that there generally is little difference between Suricata and Snort's ability to detect malicious traffic. Suricata is compatible with signatures written in snort lightweight rules description language. I did however, discover some compatibility issues.
The purposed framework applies additional latency to the analysis of IDS events. The perceived latency was generally higher for Snort events than for Suricata events. The reason for this is probably the additional processing time applied by the implemented log conversion tool.
3
Preface
This report is the result of the master thesis IKT 590 (30 ECTS) which is part of my fourth semester MSc study at the Faculty of Engineering and Science, University of Agder (UiA) in Grimstad, Norway. The work on this project started from 1 January 2017 and ended on 21 May 2017. In this project, I have designed, implemented and demonstrate a "SCADA Intrusion Detection System Test Framework".
I would like to express my gratitude to my supervisor Nils Ulltveit-Moe for making this Master Thesis possible and giving me guidance and feedback throughout this project. I would also like to thank NC-Spectrum AS for good support and for inviting me to a conference in Kviteseid themed securing SCADA systems. This conference helped me kick start my master thesis and gave me many new ideas.
Grimstad May 2017
4
List of figures
Figure 1: Defense-in-depth security layers [3] ... 12
Figure 2: Activity framework for Design Science Research [5] ... 14
Figure 3: Relationships between kernel theory, mid-range-theory and design theory, and the design process [5] ... 14
Figure 4: Reasoning in the Design Research Cycle [5] ... 15
Figure 5: Hierarchy of the five levels of distribution automation (DA)[1] ... 16
Figure 6: DA level interconnection [1] ... 17
Figure 7: First generation SCADA Architecture [6] ... 18
Figure 8: Second generation SCADA Architecture [6] ... 19
Figure 9: Third generation SCADA Architecture [6] ... 19
Figure 10: Fourth generation SCADA Architecture [8] ... 20
Figure 11: IEC 60870-5-104 APDU [11] ... 21
Figure 12: Control Field Information Type Structure [10] ... 21
Figure 13: Code Type Groups [10] ... 21
Figure 14: DNP3 master/slave architecture [10] ... 22
Figure 15: DNP3 Data Link Frame [10] ... 22
Figure 16: Modbus Client/Server communication model [13] ... 23
Figure 17: Modbus TCP/IP communication architecture [13] ... 24
Figure 18: General Modbus frame [13] ... 24
Figure 19: Modbus TCP/IP frame [13] ... 24
Figure 20:Interrelations between the IEC TC57 standards and the IEC 62351 security standards [20] ... 27
Figure 21: Stuxnet first three stages[21] ... 28
Figure 22: Stuxnet last three stages[21] ... 28
Figure 23: Multilayer SCADA cyber-security framework with IDS [31] ... 34
Figure 24: SCADA-IDS security management system [31] ... 34
Figure 25: Hybrid SCADA-IDS process [31] ... 35
Figure 26: OCSVM classification [35] ... 38
Figure 27: Alert-ontology [40] ... 40
Figure 28: Architecture overview [41] ... 42
Figure 29: SCADA network topology [41] ... 43
Figure 30: SCADA Honeynet architecture [44] ... 44
Figure 31: GridLab District setup [45] ... 44
Figure 32: Implementation overview of SoftGrid testbed [46] ... 45
Figure 33: Placement of A*CMD system [46] ... 46
Figure 34: Framework Architecture ... 49
Figure 35: IEC Server panels ... 51
Figure 36: qtester104.ini configuration file ... 52
Figure 37: QTester104 GUI connected to IEC Server ... 52
Figure 38: Wireshark analysis of IEC 60870-5-104 communication ... 53
Figure 39: OSHMI KOR1 substation in simulation mode switch on ... 53
5
Figure 41: OSHMI KOR1 event viewer in simulation mode ... 54
Figure 42: OSHMI KOR1 substation trend viewer in simulation mode ... 54
Figure 43: OpenMUC j60870 Client Console default ... 55
Figure 44: Adding new commands and acionkeys ... 55
Figure 45: Configuring action for actionkey ... 56
Figure 46: Add new action for each command ... 56
Figure 47: OpenMUC j60870 Client Console after modification ... 56
Figure 48: ELK stack architecture... 62
Figure 49: Logstash configuration [51] ... 63
Figure 50: Three-node cluster ... 64
Figure 51:ELK stack successfully configured ... 65
Figure 52: Pie chart visualization in kibana ... 65
Figure 53: Monitoring dashboard provided by x-pack ... 66
Figure 54: Elasticsearch monitoring using x-pack ... 66
Figure 55: Functionality available in x-pack [53] ... 67
Figure 56: Network traffic monitoring dashboard ... 68
Figure 57: IDS alert monitoring dashboard ... 69
Figure 58: IDS comparison dashboard ... 69
Figure 59: Experimental dashboard ... 70
Figure 60: Calculating latency ... 70
Figure 61: Latency Dashboard ... 71
Figure 62: Snort IDS SystemD ... 72
Figure 63: BASH script used to archive and clear the snort log ... 73
Figure 64: Output of BASH script ... 73
Figure 65: Wireshark analysis of normal IEC 60870-5-104 traffic ... 75
Figure 66: Packet Sender client side ... 76
Figure 67: Packet Sender server side ... 76
Figure 68: Configured IEC Server to send single point information (M_SP_NA_1) messages every second ... 77
Figure 69: Sending read command (C_RD_NA_1) message from OpenMUC j60870 client ... 77
Figure 70: Sending interrogation command (C_IC_NA_1) message from OpenMUC j60870 client ... 77
Figure 71: Sending counter interrogation command (C_CI_NA_1) message from OpenMUC j60870 client ... 78
Figure 72: Sending a single command (C_SC_NA_1) message from an unauthorized client ... 78
Figure 73: Sending a “set point command, normalized value” (C_SE_NA_1) message from an unauthorized client ... 78
Figure 74: Sending reset process command (C_RP_NA_1) message from OpenMUC j60870 client ... 79
Figure 75: Broadcast request from an unauthorized client ... 79
Figure 76: Snort ARP Spoof Preprocessor ... 81
6
Figure 78: Ettercap-104-mitm plugin code and output ... 81
Figure 79: Editing the tcp port in the QTester104 configuration file ... 82
Figure 80: Using Packet Sender to connect a Client on a non-IEC104 port ... 83
Figure 81: Using plcscan to scan for modbus devices ... 85
Figure 82: Using metasploit to send read request to PLC ... 86
Figure 83: Using metasploit to send write request to PLC ... 86
Figure 84: NMAP scanning in version detection mode ... 86
Figure 85:Using SMOD to perform points list and function code scan... 87
Figure 86: Using PuTTy to connect via Telnet ... 88
Figure 87: Using dsniff to sniff username and password used in Telnet connection ... 88
Figure 88: Using ncrack to brute force telnet passwords ... 88
Figure 89: Traffic monitor dashboard ... 89
Figure 90: Using hping3 to perform SYN flood attack ... 89
Figure 91: Network monitoring on target ... 90
7
List of tables
Table 1: Modbus Public function types [13] ... 25
Table 2: Performance comparison of machine learning techniques [35] ... 39
Table 3: System specification ... 50
Table 4: Network specifications ... 50
Table 5: IEC 60870-5-104 message types supported by IEC Server [48] ... 51
Table 6: Example snort rule ... 57
Table 7: py-idstools u2eve configuration file ... 60
Table 8: Filebeat configuration on the Snort IDS machine ... 61
Table 9: IEC 60870-5-104 variables set in configuration files (normal communication) . 75 Table 10: Signature-based rules triggered by various methods ... 80
Table 11: Protocol-based rules triggered by Ettercap plugin ... 82
Table 12: Traffic-pattern-based rules triggered by various methods ... 83
Table 13: Regeneration DNP3 pcap-files using Bittwist ... 84
Table 14: DNP3 rules triggered by pcap regeneration ... 84
Table 15: Regeneration modbus pcap-files using Bittwist ... 85
8
List of acronyms
AMR – Automatic meter reading ANN – Artificial Neural Networks
API – Application Programming Interface CVE – Common Vulnerability Enumeration DDoS – Distributed Denial-of-Service DPI – Deep Packet Inspection
DSO – Distribution System Operator ELK – Elasticsearch, Logstash and Kibana HIDS – Host-Based Intrusion Detection System HMI – human-machine interface
HMM – Hidden Markov Model ICS – Industrial Control Systems
ICT – Information and Communication System
IDMEF – The Intrusion Detection Message Exchange Format IDS – Intrusion Detection System
IEC – International Electrotechnical Commission IED – Intelligent Electronic Device
IoT – Internet of things IP – Internet Protocol
JSON – JavaScript Object Notation LAN – Local Area Network
MAC – Medium Access Control NCC – Network Control Center
NIDS – Network-Based Intrusion Detection System
NVE – The Norwegian Water Resources and Energy Directorate OCC – One-Class Classification
OCSVM – One Class Support Vector Machines PDF – Portable Document Format
PLC – Programmable Logic Controller RTU – Remote Terminal Unit
SCADA – Supervisory control and data acquisition SDN – Software-Defined Networking
SIEM – Security Information and Event Management SSH – Secure Shell
SVDD – Support Vector Data Description SVM – Support Vector Machines
TDoS – Telephone Denial-of-Service UPS – Uninterruptible Power Supply USB – Universal Serial Bus
VPN – Virtual Private Network WAN – Wide Area Network
9
Table of Contents
Abstract ... 2 Preface ... 3 List of figures ... 4 List of tables ... 7 List of acronyms ... 8 1 Introduction ... 12 1.1 Problem statement ... 131.2 Limitations and Assumptions ... 13
1.3 Research Method... 13
1.4 Report outline ... 15
2 Theory ... 16
2.1 Technology used in power grids ... 16
2.2 SCADA Architecture ... 18
2.2.1 First generation – Monolithic SCADA Systems ... 18
2.2.2 Second generation – Distributed SCADA Systems ... 18
2.2.3 Third generation – Networked SCADA Systems ... 19
2.2.4 Fourth generation – “Internet of things (IoT)” SCADA Systems ... 19
2.3 SCADA communication protocols ... 20
2.3.1 IEC 60870-5-104 ... 20 2.3.2 DNP3 ... 22 2.3.3 Modbus ... 23 2.4 Security issues ... 25 2.4.1 IEC 60870-5-104 ... 26 2.4.2 DNP3 ... 26 2.4.3 Modbus TCP ... 26 2.4.4 IEC 62351 ... 27
2.5 Cyber-attacks on SCADA systems ... 27
2.5.1 Attack on Iran’s nuclear program ... 27
2.5.2 Attack on the Ukrainian Power Grid ... 29
2.6 Intrusion Detection ... 30
2.7 Honeypots ... 31
3 Prior Research ... 33
3.1 Signature and preprocessor based SCADA Intrusion Detection ... 33
3.2 Big Data based SCADA Intrusion Detection ... 35
3.3 Machine Learning based SCADA Intrusion detection ... 36
3.4 Ontology based SCADA Intrusion Detection ... 39
3.5 Intrusion detection in SDN-Based SCADA systems... 41
3.6 SCADA Honeypots ... 43
3.7 Power grid testbeds ... 44
4 Approach ... 47
4.1 Framework architecture ... 47
4.2 Implementation ... 50
10
4.2.1.1 IEC 60870-5-104 Server ... 50
4.2.1.2 IEC 60870-5-104 Client ... 51
4.2.1.3 Second IEC 60870-5-104 Client ... 54
4.2.1.4 Siemens SIAMATIC S7 -200 PLC ... 57
4.2.2 Intrusion Detection Systems (IDSs) ... 57
4.2.2.1 Suricata IDS ... 58
4.2.2.2 Snort IDS ... 59
4.2.2.3 Filebeat ... 61
4.2.3 Security information and event management (SIEM) ... 62
4.2.3.1 Logstash ... 62
4.2.3.2 Elasticsearch ... 64
4.2.3.3 Kibana ... 64
4.2.3.4 X-pack ... 65
4.2.4 Dashboards ... 67
4.2.4.1 Network traffic monitoring ... 68
4.2.4.2 IDS alert monitoring ... 68
4.2.4.3 IDS comparison ... 69
4.2.4.4 Experimental ... 70
4.2.4.5 Latency ... 70
4.2.5 Automation ... 71
4.2.5.1 System daemons ... 71
4.2.5.2 Log rotation and index cleaning ... 72
4.2.5.3 Time synchronization ... 74
5 Experiments and Results ... 75
5.1 IEC 60870-5-104 client/server communication ... 75
5.1.1 Normal communication ... 75
5.1.2 Signature-based rules ... 76
5.1.2.1 Non-IEC/104 communication on an IEC/104 port ... 76
5.1.2.2 Spontaneous messages storm ... 76
5.1.2.3 Unauthorized read command to an IEC/104 Server ... 77
5.1.2.4 Unauthorized interrogation command to an IEC/104 server ... 77
5.1.2.5 Unauthorized counter interrogation command to an IEC/104 Server 78 5.1.2.6 Remote command from unauthorized 104 client ... 78
5.1.2.7 Set point command from an unauthorized IEC/104 client ... 78
5.1.2.8 Reset process command from unauthorized client ... 78
5.1.2.9 Broadcast request from unauthorized client ... 79
5.1.2.10 Potential Butter Overflow ... 79
5.1.2.11 Results ... 79
5.1.3 Protocol-based rules... 80
5.1.3.1 Man-in-the-middle packet injection ... 80
5.1.3.2 Results ... 81
5.1.4 Traffic-pattern-based rules ... 82
11
5.1.4.2 Unauthorized connection attempt to a non-IEC/104 port of a server 82
5.1.4.3 Unauthorized traffic between IEC/104 server and client ... 83
5.1.4.4 Results ... 83
5.2 DNP3 communication ... 83
5.2.1 Captured DNP3 traffic ... 83
5.2.2 Results ... 84
5.3 Modbus communication ... 85
5.3.1 Captured Modbus traffic ... 85
5.3.2 Reconnaissance on the Simens SIMATIC S7-200 PCL ... 85
5.3.3 Unauthorized read and write requests to PLC ... 85
5.3.4 Non-Modbus communication on TCP port 502 ... 86
5.3.5 Points list scan and function code scan ... 86
5.3.6 Results ... 87
5.4 Other experiments ... 88
5.4.1 Remote access to RTU ... 88
5.4.1.1 Man-in-the-middle sniffing ... 88 5.4.1.2 Brute force ... 88 5.4.1.3 Results ... 89 5.4.2 Denial-of-service ... 89 5.4.2.1 SYN flood ... 89 5.4.2.2 Results ... 90 5.4.3 Latency ... 90
5.4.3.1 Normal traffic flow ... 91
5.4.3.2 Flooded traffic ... 91 5.4.3.3 Results ... 91 6 Discussion ... 93 7 Conclusion ... 97 8 Future Work ... 99 9 References ... 100 10 Appendices ... 104
12
1 Introduction
A Supervisory control and data acquisition (SCADA) system is an industrial control system (ICS), implemented between industrial processes and management systems. SCADA systems play an important role in our critical infrastructure (CI), and is used for example to control power plants and water supplies. The main functions of a SCADA system is event data management, management of network switch state, remote controlling, configuration, measuring and reporting [1].
Cyber-attacks have not been considered as a likely threat to SCADA systems in the past. Several of the most commonly used protocols in SCADA system today have therefore a lack of security, and make the systems vulnerable to cyber-attacks. An attack against SCADA systems may jeopardize the system operation, safety and stability. In the worst case, an attack could cause huge economic and human losses. Nation-states, criminals and hacktivists are specifically targeting critical infrastructure as a part of their cyberwarfare, to achieve economic and political benefits.
The defense-in-depth principle is an idea that layered security mechanisms will increase security of the whole system. If an attack causes one security mechanism to fail, other mechanisms may still provide the necessary security to protect the system [2]. This principle should be followed to improve the overall security level of SCADA systems. Several layers of security are illustrated in figure 1.
Figure 1: Defense-in-depth security layers [3]
Intrusion detections systems (IDS) and intrusion prevention systems (IPS) is a layer of security often implemented behind a firewall. An IDS/IPS is a software or hardware device that monitors the system, and looks for malicious activity. IDS allow administrators to detect cyber-attacks, stop the attack and design the system to be secure.
13 1.1 Problem statement
This master thesis aims at implementing and demonstrating an integrated intrusion detection system test framework for supervisory control and data acquisition (SCADA) networks in the electrical energy sector.
The main goal is to perform and study attacks on simulated SCADA networks, and demonstrate how an intrusion detection framework can detect the attacks.
1.2 Limitations and Assumptions
The lab environment implemented in this master thesis contains simulated SCADA systems. I assume that these are realistic simulations of SCADA protocols and hardware. This thesis focuses on network based intrusion detection systems (NIDS). NIDS solutions do not cause any performance penalty, when running in promiscuous mode. Host based intrusion detection systems (HIDS) could be an efficient way to detect malicious activities and modifications in SCADA systems. HIDS solutions however causes a significant performance penalty on the system, 4% to 50% depending on the workload [4]. For this reason, HIDS is not part of the implemented test framework. Both signature and anomaly based IDS solutions are discussed in this report. Signature based detection is however the focus in the implemented framework. The IEC 60870-5-104 protocol is the major focus in this master thesis. Nevertheless, other protocols like DNP3 and Modbus will also be discussed.
1.3 Research Method
Several research methodologies such as scrum, waterfall, spiral, Design Science Research in Information Systems (DSRIS) and Prince2 were considered as possible methodologies for this project. After examining all the research methodologies, the DSRIS was considered as a suited method for this project. The research in this master thesis follow the DSRIS methodology. The idea behind this methodology is to learn through the act of building. The aim of using DSRIS is to create a design theory through the process of developing and testing an information system artifact inextricably bound to the testing and refinement of its kernel theory. The relationship between DSRIS and theory is a frequently debated topic in research communities. I build my understanding of DSRIS on well-known research on the anatomy of research projects [5]. Figure 2 shows the overall activity framework utilized in this metrology. The activities are interconnected and ensures continuous development. The activities in the model applies to the following tasks in this project; Problem diagnostics involves detecting vulnerabilities and possible attacks on SCADA systems. Technology evaluation involves performing and simulate attacks. Theory Building involves developing theories of how the attacks can be performed and detected. Technology Invention/design involves implementing and design new elements (e.g. IDS rules, new target protocols, attack modules and analysis tools) in the framework [5].
14
Figure 2: Activity framework for Design Science Research [5]
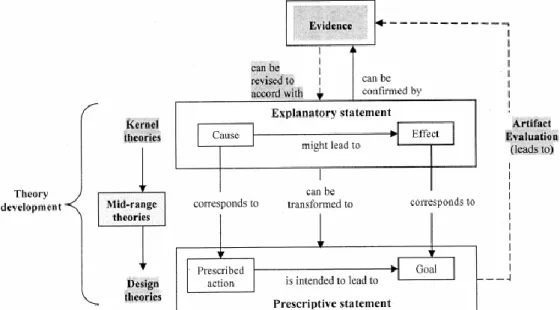
Figure 3 describes the relationship between theory development and the design process. Kernel theories provide theoretical grounding for the artifact. Design theory is considered as practical knowledge used to support design activities. An example kernel theory could describe that, using Telnet might lead to unauthorized access. The design theory could be designing a sniffing attack to get access to the plain text password. Using this password to gain unauthorized access might be evidence to confirm the initial kernel-theory [5].
15
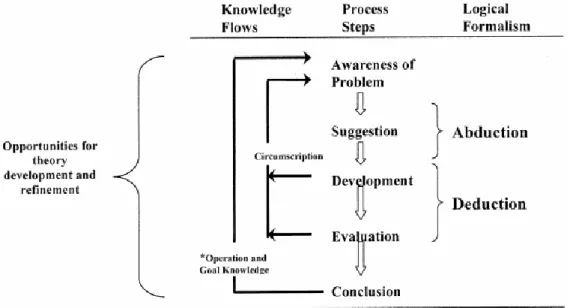
Figure 4 provides a more granular and directive description of the project phases, than figure 2. All research phases are potential opportunities for developing and refine kernel theories, mid-range theories and design theories [5].
Figure 4: Reasoning in the Design Research Cycle [5]
1.4 Report outline
Introduction: The first chapter contains, background, problem statement, limitations and assumptions for this project. As well as a research methodology used to perform experiments and design an approach.
Theory: The second chapter contains, a discussion of theory relevant for project. Including technology, security issues and past events.
Prior Research: The third chapter contains, a discussion of prior research related to this project.
Approach: The fourth chapter contains, a discussion about the architecture and implementation of the chosen approach.
Experiments and Results: The fifth chapter contains, performed experiments and a discussion around the results.
Discussion: The sixth chapter contains, a discussion of the whole project, evaluation of results, and other thoughts about the conducted research.
Conclusion: The seventh chapter contains, a conclusion of the presented approach and achieved results.
Future Work: The eighth chapter contains, a discussion around possible future work to improve performance.
16
2 Theory
This chapter discusses theory related to research conducted in this project. 2.1 Technology used in power grids
The electric distribution system main functionality is to transfer and distribute the generated electric power to customers. The power grid can be separated into different levels. The high-level network, is the national distribution network, connected to distribution networks in other countries. This distribution network consists of high-voltage lines connected to regional networks. The regional networks is again connected to local networks, operated by multiple Distribution System Operators (DSOs) [1].
To achieve Distribution Automation (DA) in the distribution network, multiple components and systems are used. With these components and systems, it is possible to plan, monitor, manage and operate the distribution network. According to [1], the DA can be divided to five different levels of automation.
Figure 5: Hierarchy of the five levels of distribution automation (DA)[1]
Utility: This level focuses on utilization of the information provided by different information systems such as Network Information System (NIS), Customer Information System (CIS), Distribution Management System (DMS) and Supervisory Control and Data Acquirement (SCADA) [1].
Network Control Center (NCC): This level allows DSOs to use DMS and SCADA systems, to monitor and control the state of the distribution network [1].
Substations: This level includes the operation of protection relays along with control of switching components. Substations may also have a possibility to use SCADA locally [1].
17
Feeder: This level covers the operation of remote controlled disconnectors, the voltage and current measurements that exist in the network. Also the operation and data transmission of fault indicators [1].
Customer: This level enables DSOs to read customer’s energy meter remotely and in real-time, via Automatic meter reading (AMR) [1].
The figure below shown how the different DA levels in the distribution process are interconnected.
Figure 6: DA level interconnection [1]
Small DSOs may not have automation at all these levels, and only follow the first-generation SCADA implementation [6]. The Norwegian Water Resources and Energy Directorate (NVE) requires that all Norwegian DSOs need to install AMR within 1. January 2019 [7]. This indirectly means that all DSOs must upgrade their control systems.
A Supervisory Control and Data Acquisition (SCADA) system is an information system widely used in industrial applications. It is an information system between the distribution primary process and the DMS, and is usually used in the NCC [1]. It connects the most critical parts of the system in real-time, via Remote Terminal Units (RTUs) or Programmable Logic Controllers (PLCs) located within the network. The main functions of a SCADA system is event data management, management of network switch state, remote controlling, configuration, measuring and reporting [1].
18 2.2 SCADA Architecture
The first SCADA systems where deployd in the 1960s, they have later evolved over the past decades. SCADA architectures can be divided into four generations [6].
2.2.1 First generation – Monolithic SCADA Systems
When SCADA systems first was developed, it was designed as a standalone system. The system was designed to communicate with RTU, via Wide Area Networks (WANs). Communication protocols used in SCADA networks were developed by vendors of RTU equipment and were often proprietary. Connectivity to the SCADA master were done at the bus level via a proprietary adapter [6].
Figure 7: First generation SCADA Architecture [6]
2.2.2 Second generation – Distributed SCADA Systems
The second generation of SCADA system was designed to distribute the processing across multiple systems, connected though a Local Area Network (LAN).
These distributed stations had different tasks. Some served as communication processors between field devices such as RTUs. Others served as an operator interface, providing the human-machine interface (HMI) for the system operators. There is even some stations performing calculations and database services.
Distribution of system functionality increased the processing power, improved the redundancy and reliability of the system. The system communicates with RTUs, via Wide Area Networks (WANs) like in the first generation [6].
19
Figure 8: Second generation SCADA Architecture [6]
2.2.3 Third generation – Networked SCADA Systems
The third generation of SCADA systems is closely related to the second generation, and is still widely utilized. This architecture is similar to the distributed architecture. The major difference is that the SCADA system now is spread across more than one LAN. This is a more complex architecture, where several systems run in parallel, connected to a SCADA master [6].
Figure 9: Third generation SCADA Architecture [6]
2.2.4 Fourth generation – “Internet of things (IoT)” SCADA Systems
The fourth generation of SCADA architecture have adopted IoT technologies and commercial cloud services. This makes SCADA systems easier to maintain and integrate. This architecture drastically increases data accessibility, cost efficiency, flexibility, optimization, availability and scalability. However, it introduces new security related issues [8].
20
Figure 10: Fourth generation SCADA Architecture [8]
2.3 SCADA communication protocols
SCADA systems used in the energy sector encompasses the collecting of the information via RTUs, transferring it back to the central site, carrying out necessary analysis and control, and then displaying that information in a HMI. A SCADA communication protocol is a standard for data representation and data transfer over a communication channel on a master/slave basis. IEC60870-5-104 and DNP3 are two of the most frequently used SCADA communication protocols in the energy industry [9]. IEC 60870-5 is widely used in Europe, while DNP3 is widely used in North America. Another widely used SCADA protocol is Modbus. Modbus is widely used in many industries, for example in water and sewage processing plants.
These protocols are implemented at the application layer, layer 5 in the TCP/IP model.
2.3.1 IEC 60870-5-104
IEC 60870 is a collection of open standards created by the International Electrotechnical Commission (IEC) for the transmission of SCADA telemetry control and data. IEC 60870 when discussed in context of SCADA normally referees to IEC 60870-5-101. This is a standard for power system monitoring, control and associated communications. When IEC 60870-5-101 was launched in 1995, the protocol was designed for serial communication. IEC 60870-5-104 is an extension of IEC 60870-5-101, that was released in 2004. It allows the serial frames to be transmitted over TCP/IP. Figure 11 shows the protocol frame structure, often referred to as Application Protocol Data Unit (APDU). The APDU consists of two parts, the Application Protocol Control Information (APCI) and Application Service Data Unit (ASDU) [10].
21
Figure 11: IEC 60870-5-104 APDU [11]
The APCI is comprised of the first 6 octets in the APDU, and contains a start character, 68H, a length field (containing the length of the APDU) and a control field. The APCI control field can be of the following types: Information, Supervisory or Unnumbered. The last two bits indicate the type; 10 for supervisory, 11 for unnumbered and 00 for information (shown in figure 12) [10].
Figure 12: Control Field Information Type Structure [10]
The ASDU (shown in figure 11) contains the data unit identifier and the data payload of one or more information objects. The Type Identification (TI) field defines the data types by referring to the 8-bit code types. Figure 13 show the TI groups that are currently defined by IEC. For example, refers TI number 9 to the reference code M_ME_NA_1 indicating “Measured value, Normalized value” [10].
22
The Variable Structure Qualifier indicates whether the payload contains multiple information objects or not (max 127). The field Cause of Transmission (CoT) indicates the cause of transmission. The CoT value “1” would indicate a periodic transmission, while the value “3” would indicate a spontaneous transmission. The common address is associated with all objects in an ASDU. All stations of a specific system broadcast address to the common address. The information object address is used as destination address in control direction and as source address in monitor direction. IEC 60870-5-104 is by default assigned the TCP port number 2404 [10] [12].
2.3.2 DNP3
The Distributed Network Protocol Version 3 (DNP3) is a protocol standard to define communications between RTUs and master stations. DNP3 was originally a proprietary protocol developed by Harris Controls Division, and has later been adopted by IEEE as an open standard. DNP3 is a master/slave control system protocol typically configured with one master station and multiple outstation devices [10].
Figure 14: DNP3 master/slave architecture [10]
DNP3 is a four-layer subset of the OSI model. The layers are the application, data link, physical, and pseudo-transport layers. The pseudo-transport layer includes routing, flow control of data packets, and transport functions such as error-correction and assembly/disassembly of packet. Figure 15 shows the structure of the DNP3 data link frame. The header contains two bytes indicating where the frame begins. The Length field specifies number of bytes of the frame excluding the Cyclic Redundancy Check (CRC) section. The link control field is used for the sending and receiving link layers for coordination. The destination address and which source address are 2-byte addresses that identifies the DNP3 device receiver and sender. Every DNP3 device is required to have a unique address for sending and receiving messages to and from each other. The data payload is divided into blocks with each block containing a pair of CRC bytes for every 16 data bytes except for the last block [10].
23
The pseudo-transport layer has the responsibility of breaking long application layer messages into smaller packets sized for the link layer to transmit, and, when receiving, to reassemble frames into longer application layer message. The application layer fragments a message depending on the receiver’s buffer size (2048 to 4096 bytes). A fragment of size 2048 must be broken into 9 frames by the transport layer before passing on to the data link layer. DNP3 is by default assigned the TCP port number 20000 [10].
2.3.3 Modbus
Modbus is an open source serial communication protocol developed by Modicon (now Schneider Electric) in 1979. It is used to establish master-slave/client-server communication between a supervisory computer and a remote terminal unit (RTU) in a supervisory control and data acquisition (SCADA) system. There are several versions of the Modbus protocols. Including Modbus RTU and Modbus ASCII for serial lines and Modbus TCP for Ethernet communication. This thesis focuses on Modbus over TCP. The modbus protocol provides four message types used in client/server communication, request, confirmation, indication and response [13].
Figure 16: Modbus Client/Server communication model [13]
The request message is send by a client to initiate a transaction.
The initiation message is send by the server, when a request message is received.
The response message is send the server to a client.
The confirmation message is send by the client, when a response message is received.
A communication system over Modbus TCP may include different type of devices. Most devices are devices directly connected to the Ethernet. Interconnected devices like bridges, routers and gateways may be used connect serial line devices to the modbus network [13].
24
Figure 17: Modbus TCP/IP communication architecture [13]
The Modbus frame is composed of an Application Data Unit (ADU), which encloses a Protocol Data Unit (PDU). The ADU includes an address field, the PDU and an error check mechanism. The PDU includes a function code field and a data field. The function code indicates what kind of action to perform [13].
Figure 18: General Modbus frame [13]
The Modbus frame used in Modbus TCP is different from the general frame. The main difference is that a new 7-byte header called MBAP header (Modbus Application Header) is added at the start of the message. The CRC (cyclic redundancy check) for error checking is removed from the message. Error checking is now performed by the TCP protocol at the transport layer (layer 4) [13], [14] .
Figure 19: Modbus TCP/IP frame [13]
The Transaction Identifier field in the MBAP header is 2 bytes set by the client to uniquely identify each request. The protocol Identifier field is 2 bytes set by the client to identify the protocol, always 00 00 for Modbus. The length field is 2 bytes used to identify the number of bytes in the Modbus message. The SlaveID field is removed and replaced with a unit identifier. The unit Identifier field is 1 byte used to communicate via devices such as
25
bridges, routers and gateways that use a single IP address to support multiple independent MODBUS end units [13].
Modbus specifies several function codes. These function codes are numbered in a range from 1 to 127 in decimal. The function codes are categorized in three categories; public, user-defines and reserved. The public codes are guaranteed to be unique and specify public documented functions. The user-defined functions are non-unique codes defined by the network administrators. The reserved codes are used by companies for legacy products and return values. The basic public functions have been developed for exchanging data, and can be categorised in four groups [13], [15].
Table 1: Modbus Public function types [13]
Modbus communication are by default initiated on TCP port 502 [13].
2.4 Security issues
SCADA systems are often a part of critical infrastructure (CI). The security in SCADA systems and the communication protocols used to exchange data is important, to prevent cyber-attacks. Many system lacks monitoring functionality. Without network monitoring, it is impossible to detect suspicious activity and identify potential threats. Another problem is that some systems are rarely or never updated. This means that some systems might contain vulnerabilities in firmware or software, that can be exploited by attackers. Some vendors even allow SCADA devices to communicate remotely over unencrypted communication. Authentication solutions are often configured with poor passwords or even with default passwords. The default passwords used in many SCADA systems are available on the internet, and leave the system completely open for attackers [16], [17]. The next the sections discuss security issues found in SCADA protocols, IEC 60870-5-104, DNP3 and Modbus TCP. Many SCADA protocols are designed to be open, robust and reliable and easy to operate, and not necessarily to provide secure communication.
26
2.4.1 IEC 60870-5-104
The IEC 60870-5-104 protocol do not perform any checksum calculation. This was included in the in the IEC 60870-5-101 frame used for asynchronous communication. Checksum calculation is now not performed at the application layer (layer 5), and is now handed over to the transport layer (layer 4).
Lack of Confidentiality: All IEC 60870-5-104 messages are transmitted in clear text across the network.
Lack of Integrity: There are no integrity checks built into the IEC 60870-5-104 protocol.
Lack of Authentication: There is no authentication in the IEC 60870-5-104 protocol.
2.4.2 DNP3
The DNP protocols transmits any data in clear text across the network. A difference from IEC 60870-5-104 and Modbus is that DNP3 performs a Cyclic Redundancy Check (CRC) by divide the data into blocks, with each block containing a pair of CRC bytes for every 16 data bytes except for the last block.
Lack of Confidentiality: All DNP3 messages are transmitted in clear text across the network.
Lack of Integrity: CRC only detects random faults. If someone intentionally change the contents of a DNP3 frame, the CRC field can be recalculated [18].
Lack of Authentication: There is no authentication in the DNP3 protocol.
2.4.3 Modbus TCP
The Modbus TCP protocol contains multiple vulnerabilities that could allow an attacker to perform reconnaissance activity or issue arbitrary commands [19].
Lack of Confidentiality: All Modbus messages are transmitted in clear text across the network [19].
Lack of Integrity: There are no integrity checks built into the Modbus protocol [19].
Lack of Authentication: There is no authentication at any level of the Modbus protocol [19].
Simplistic Framing: The Modbus protocol frames are sent over established TCP connections. While such connections are usually reliable, they have a significant drawback since TCP does not preserve record boundaries [19].
Lack of Session Structure: The Modbus TCP protocol consists of short transactions where the client initiates a request to the server that results in a single action. When combined with the lack of authentication and poor TCP initial sequence number (ISN) generation in many embedded devices, it becomes
27
possible for attackers to inject commands with no knowledge of the existing session [19].
2.4.4 IEC 62351
IEC 62351 is a connection of standards created by the International Electrotechnical Commission (IEC) to handle security issues in SCADA communication protocols, including the IEC 60870-5-104 protocol and the DNP3 protocol. The different security objectives include authentication and encryption of data. Authentication of entities through digital signatures, ensures only authorized access. Prevention of eavesdropping through TLS encryption. Prevention man-in-the-middle attack trough authentication. Prevention of spoofing through security certificates and replay attacks through TLS encryption. However, TLS does not protect against denial of service. Figure 20 shows the relation between IEC communication standards and the IEC security standards [20].
Figure 20:Interrelations between the IEC TC57 standards and the IEC 62351 security standards [20]
2.5 Cyber-attacks on SCADA systems
Although cyber-security should be one of the highest priority tasks in SCADA systems, there is still much work to be done to increase security in this area. There are many examples from the past, where unauthorized users have exploited vulnerabilities in SCADA systems, to gain access to the system. If unauthorized users can control SCADA systems, it can lead to catastrophes. Some well-known attacks on SCADA systems, are mentioned in this chapter.
2.5.1 Attack on Iran’s nuclear program
A 500-kilobyte malicious computer worm called Stuxnet, was in 2010 targeting industrial control systems. Stuxnet infected at least 14 industrial sites in Iran, causing damage to Iran's nuclear program [21].
The Stuxnet worm operates in six stages. In the first stage; the worms targeting and infecting Microsoft computers, via an infected USB stick and replicate itself to the network.
28
Second stage; the worm specifically seeks Siemens Step7 software installed on the computers. Third stage; If the computer is the target, the worm tries to connect to the Internet and update the worm. Otherwise, Stuxnet does nothing and does not continue to stage four [21].
Figure 21: Stuxnet first three stages[21]
Fourth stage; the worm compromises the Programmable Logic Controllers (PLCs), by exploiting vulnerabilities in the system. Fifth stage; Stuxnet gathers information about the running system. Then it uses this information to modify the code running in Programmable Logic Controllers (PLCs). The goal of the attack was to force the system to deviate from expected behaviour. In order to hide from intrusion detection systems, the deviation is small and over a long period of time [22]. Sixth stage; at the same time as the modified code runs, Stuxnet provides false feedback to monitoring systems. This way the operators would think that everything runs as normal. Stuxnet was programmed to automatically erase itself on the date 24.06.2012 [23].
Figure 22: Stuxnet last three stages[21]
Stuxnet was discovered in 2010, by a Belarusian malware-detection company. They found the malware located in a client’s computer. The malware was signed by a digital certificate, making it appear to come from a reputable company. The company shared their findings with other security companies. Some of the world’s largest security firms immediately began reverse engineering the malware code. It soon became clear that the malware had been specifically designed to damage Siemens systems running centrifuges in Iran’s nuclear program. Although the authors of Stuxnet never have been officially identified, the size and sophistication of the worm indicates that it could have been created only by a nation-state [21]. Stuxnet was according the Washington post, the work of United States
29
and Israeli intelligence agencies. The goal was to delay Iran’s apparent progress toward building an atomic bomb [23].
Large quantities of uranium are needed to build an atomic bomb. The Iranian nuclear program had at that time nearly 6,000 centrifuges. Centrifuges are fast-spinning machines that extract uranium. The Stuxnet attack destroyed nearly 1,000 of Iran’s 6,000 centrifuges [23].
Multiple malicious worms related to the Stuxnet worm has been detected over the past years. Hungarian researchers found in 2011, a malware called Duqu. This malware had been designed to steal information about industrial control systems. In 2012 Kaspersky Lab detected a malware called Flame. This malware had supposedly destroyed files from oil-company computers in Iran. They realized that Flame was a precursor of Stuxnet, that somehow had gone undetected. The same year Kaspersky Lab found a worm called Gauss. The Gauss worm infected computers via USB sticks. The Gauss worm would for unknown reasons steal files and gather passwords, targeting Lebanese bank credentials [21].
2.5.2 Attack on the Ukrainian Power Grid
In 2015, three regional electricity distribution companies in Ukraine, experience power outages due coordinated cyber-attacks. These cyber-attacks are the first publicly acknowledged incidents to result in power outages [24].
The attacks began with a spear-phishing campaign, targeting IT staff and system administrators. The campaign sent an email to workers of the companies with a malicious Word document attached. When they opened the attached document, a popup window appears asking them to enable macros for the document. If the clicked “enable”, a malware called BlackEnergy3 would infect the computer and open a backdoor. Now the attackers have access to the corporate network. Over many months, the attackers conducted reconnaissance in the network. They managed to get access to the Windows Domain Controllers and harvested the worker’s credentials: Some of these credentials were used to get VPN access, and remotely log in to the SCADA network. The first thing they did, was to reconfigure the uninterruptible power supply (UPS) procedures. They managed to do this in two of the three companies systems. Each of the three companies were running different management systems. In each case, the attackers wrote malicious firmware for the specific system, replacing the legitimate firmware [25].
In December 2015 the attackers launched the attack by accessing a hijacked VPN and disabled the UPS. A worker from one of these companies, explains that the cursor on his computer suddenly moved across the screen of its own accord. The worker watched while the attackers took the substations offline, without being able to stop their action. The attackers logged him out of the control panel. When he tried to log back in, they had changed his password. At the same time, they launched a telephone denial-of-service (TDoS) attack, to prevent customers from calling in to report the outage. They also
30
overwrote the firmware with the malicious firmware, preventing the operators from sending remote commands. After all this, they used a malware called KillDisk to wipe all the data from the operator computers. KillDisk also wipes the master boot record, meaning that the operator computers not would be able to reboot [25].
The attack lasted several hours and forced operators to switch to manual mode. Approximately 225,000 customers in different areas, lost power due to this attack. Ukrainian government claimed that the Russian security services were responsible for this attack [24].
2.6 Intrusion Detection
Most DSO’s already have some sort of firewall protecting their system, by denying specific actions. Compared to physical security; a firewall can be compared with a protecting wall, while intrusion detection system (IDS) can be compared with cameras and sensors monitoring the system. IDS’s usually consists of a management console and sensors. The management console manages and reports intrusions. The sensors are agents that monitor hosts or networks activity on a real-time basis [26].
The main task of IDS, is to detect system intrusions that attempt to compromise integrity, confidentiality or availability. Unlike in an intrusion prevention system (IPS), an IDS does not block network traffic. The role of a network IDS is passive, only gathering, identifying, logging and alerting [26].
IDS have two different techniques to categorize and detect intrusions; Misuse intrusion are defined attacks on known weak points within a system. The sensors can detect intrusions by watching for certain actions be performed, and match them to signatures in a database [26].
Anomaly intrusion are based on observations of deviations from normal system usage patterns. They can be detected by building up a profile of the system under concern, and detecting significant deviations from this profile. Some IDS systems use a hybrid
anomaly/misuse detection model. This hybrid combines the best of both worlds. The solution can analyse data and determine if the observations are suspicious and if it corresponds to a known intrusion profile, and if either the sequence of observations or the attack profile are statistically significant [26].
There are three types of IDS implementations; Network based IDS (NIDS) monitors the traffic over connections, by capturing network packets. NIDS intercept packets traveling along communication links and protocols. When a packet is captured, it is analysed by using one of the intrusion detection techniques. Host based IDS (HIDS) identifies unauthorized behaviour on a specific device. HIDS includes an agent installed on the reporting host, and a server agent on the IDS side. The agents monitors and alerts on local OS and application activity. Another possible approach is a hybrid of both HIDS and NIDS [26].
31
There are some well-known issues with today’s IDS solutions. An IDS might incorrectly identify intrusions. A false positive occurs when the IDS classifies an event as a possible intrusion when it actually is legitimate. A false negative occurs when an actual intrusion happens but the IDS allows it to pass. A subversion error can happen when an intruder is able edit the intrusion detector procedures, to force false negatives to occur. False positives will then, be classified as legitimate events by the administrators of the system [26].
2.7 Honeypots
A honeypot is a security resource whose value lies in being probed, attacked, or compromised. Unlike firewalls and IDS technologies, honeypots are something we want the attackers to interact with. Honeypots can provide additional information about attacks directed towards specific systems, by collecting information about the attacker. The honeypots can be divided into two categories, low-interaction and high-interaction honeypots [27].
Low-interaction honeypots have limited interaction. They normally work by emulating services and operating systems. Attacker activity is limited to the level of emulation by the honeypot. The low-interaction honeypot’s main task is to identify hostile activity, generate an alert and capture a minimum of data. Normally these honeypots take a minimum amount of work. The main disadvantages with low interaction honeypots is that they log only limited information and are designed to capture known activity [27].
High-interaction honeypots are totally different. They are usually complex solutions as they involve real operating systems and applications. Nothing is emulated and attackers are presented to a real environment. The main advantages with high-interaction honeypots is that they can capture extensive amounts of information. By giving attackers real systems to interact with, we are able to learn the full extent of the attacker’s behaviour [27].
A Honeynet is a special kind of high-interaction honeypot, containing entire networks of computers designed to be attacked. The purpose is building a highly contained network, where all inbound and outbound traffic is both controlled and captured. Intended victims, containing computers running real applications are placed within the network. Honeynets can be divided into three generations [27]:
The first generation (Gen I) honeynet was implemented in an isolated network. A firewall and a router were used as access control devices. Data Control was implemented at the routing firewall. Gen I Honeynet has high risk of intruders exploiting its data control mechanism, and take advantage of initiate a stream of attacks on other systems [27]. The second generation (Gen II) honeynet consist of more advanced technologies, designed to ensure that compromised nodes of the Honeynet not can be used to attack
32
machines outside the Honeynet. It is a layer two bridge that can count connections, and block/modify outbound attacks. The honeynet is placed in the production network and separated from it by means of a gateway device. Since all the traffic passes through the gateway, the sensor can capture data traveling in and out of the Honeynet. Advanced data capture techniques like key loggers can be implemented. The third generation (Gen III) have the same architecture as the second generation (Gen II). The only difference is improvements in deployment and management [27].
Honeypots can also be categorized by their purposes; production and research honeypots. Production honeypots are placed within an organization’s production network with the purpose of detection. They extend the capabilities of intrusion detection systems. Research honeypots are deployed by researchers in an isolated environment, with the purpose of studying the attacker’s tactics and discover new zero day exploits, worms, trojans and viruses [28].
33
3 Prior Research
Intrusion detection systems for SCADA networks is a relatively new concept. This chapter, will discuss prior research on topics related to SCADA intrusion detection. The research topics is divided into subchapters, although some research fits in several categories.
3.1 Signature and preprocessor based SCADA Intrusion Detection
Digital Bond has performed research on SCADA Security for the US Department of Homeland Security, US Department of Energy, UK, Japanese and other governments. The Digital Bond project Quickdraw has released SCADA IDS signature rules and preprocessor plugins for DNP3, EtherNet/IP and Modbus TCP protocols. These rules and plugins can be used to identify unauthorized requests, malformed protocol requests and responses, rarely used and dangerous commands, and other situations that are likely or possible attacks. The signature rules and preprocessor plugins are written to support Snort IDS. The signatures can easily be converted to other IDS formats. However, it is not easy to convert preprocessors to support other IDS formats [29].
Researchers at the Queen’s University Belfast has published a paper, presenting a rule-based intrusion detection system for IEC 60870-5-104 SCADA networks [30]. They used a Deep Packet Inspection (DPI) method, which included signature-based and model-based approaches. The paper presents a set of Snort IDS signatures. These signatures can not only detect several known malicious attacks and suspicious threats, but also identify the sources of the attacks and therefore potentially prevent future intrusions. A specific anomaly based approach, known as model-based is proposed as a complement to the signature-based approach. By monitoring the behaviors of devices using the IEC/104 protocol, unknown zeroday attacks may be detected. The researchers conclude that the latency introduced by the IDS not will compromise the normal operations in the SCADA system [30].
The same researchers published a paper, presenting a next-generation multi-attribute SCADA-specific IDS [31]. The paper claims that current security countermeasures in SCADA systems mainly focus on external threats, and ignores interior detection within a substation network. An engineer can for instance enter a substation and connect his laptop to the LAN. This laptop may be infected by malware, providing attackers unauthorized access to the substation. In a worst-case scenario, this could lead to an attack on the substation, causing power outages. In order, to address this issue, they proposed a SCADA cyber-security framework based on IDS [31].
34
Figure 23: Multilayer SCADA cyber-security framework with IDS [31]
This framework focused on perimeter defense against attacks from outside enclaves and inside detection of malicious behavior. The IDS sensors are deployed in the enclave boundaries for the perimeter defense, as well as inside the enclave for interior detection. The proposed solution contains a Security Information and Event Management (SIEM) platform that supports log management, real-time monitoring and security event management from a broad range of systems. It establishes an early warning system to detect threats based on log events and flow information from both the enterprise level and the SCADA level [31].
Figure 24: SCADA-IDS security management system [31]
The proposed multi-attribute SCADA-specific IDS is an effective hybrid intrusion detection system that can identify both external malicious attacks and internal misuse [31].
The detection process consists of three attribute methods: 1) Access control whitelists
35 3) Behavior-based rules.
Figure 25: Hybrid SCADA-IDS process [31]
The access control whitelist approach contains detectors in three layers. 1) source and destination Medium Access Control (MAC) addresses in the data link layer. 2) source and destination Internet Protocol (IP) addresses in the network layer and 3) source and destination ports in the transport layer. If any of the addresses or ports are not in the corresponding whitelist, the detector will take a predefined action [31].
The protocol-based whitelist method is related to the application layer and deals with various SCADA protocols such as Modbus, DNP3, IEC 60870-5 series and IEC 61850. The IDS can be set to inspect network traffic between two control centers. In this case the protocol-based detector only allows communication traffic complying with specific protocols, otherwise it will generate an alert message [31].
The behavior-based detection approach finds and defines normal and correct behaviors by Deep Packet Inspection (DPI). This may include analysis of a single-packet or multiple-packets together. The detector generates an alert if the inspected package deviates from the normal behavior [31].
3.2 Big Data based SCADA Intrusion Detection
Big Data is an expression used to describe a massive volume of both structured and unstructured data, that is difficult to process using traditional databases and software. Big data is a hot topic related to security and intrusion detection.
Packetpig is one of the first big data signature based network intrusion detection systems. This system is based on Snort and operates in a full capture mode, using Apache Hadoop as a distributed MapReduce based filesystem. The data can be stored across multiple
36
nodes, allowing distributed parallel processing. This provides powerful analysis of terabytes of network packet data, running queries [32].
Researchers at the Austrian Institute of Technology has published a paper, they presents a big data anomaly based network intrusion detection system used in Smart Grid ICT networks [33]. This approach heavily relies on statistical analysis of system behavior reflected in system log files to detect anomalies [34]. Almost every modern ICT component and service produces logging data to report events, internal state changes, and committed actions. The data is a valuable source to establish situational awareness about the current state of ICT networks and is utilized by this approach. The approach uses the Graylog2 software to collect distributed log files and maintain the temporal order of log messages. The solution use a self-learning approach that continuously creates hypotheses about correlated events and test them at run-time. It operates in a learning phase (to capture a stable system model) and an operational phase (to trigger alerts in case of deviations from the system model). Both phases are executed in parallel, which means the system continuously learns and can adapt to changing situations [33].
3.3 Machine Learning based SCADA Intrusion detection
Researchers at the University of Surrey has published a paper, presenting how machine learning methods can be utilized in intrusion detection systems protecting SCADA systems [35]. This subchapter sums up the methods discussed in this paper.
Intrusion detection is the process of observing and analyzing the events taking place in an information system to discover signs of security related issues. Intrusion detection systems (IDS) are traditionally analyzed by human security analysts. When the amount of data increases, this process will be time consuming and expensive. Machine learning has the capability to gather new data and make predictions based on the previous data. Machine learning methods in intrusion detection systems could detect more attacks, reduce the number of false positives and analyze more efficient than humans [35].
Rule-based Approach
This approach uses rules that describe the correlation between attribute conditions and class labels. When applied to intrusion detection, the rules becomes descriptive normal profiles of users, programs and other resources. The intrusion detection mechanism identifies a potential attack if users or programs act inconsistently with the established rules. The rules can be written in the form of if-then. If there are too many rules, the system can become difficult to maintain and can suffer from poor performance [35] , [36].
Artificial Neural Networks
This approach uses an artificial neural network (ANN), which involves a network of simple processing neurons, which make up the layers of “hidden” units, and can predict complex behavior, determined by the connections between the processing elements and element parameters. When applied to intrusion detection systems, an ANN could provide the capability of analyzing the data even if it is incomplete. Due this capability an ANN can
37
learn abnormal behaviors and identify potential attacks, even if the attacks are similar to prior attacks but do not match the previous malicious behaviors exactly. ANN provides fast speed and nonlinear data analysis. The main difficulty of an ANN is that it needs a large amount of training data to ensure accurate predictions [35].
Hidden Markov Model (HMM)
This approachs use the Hidden Markov Model (HMM), where the observed examples, , ∈ {1, … , }, have an unobserved state at time t. Each node in HMM represent a random variable with hidden state and observed value at time t. In HMM it is assumed that state has a probability distribution over the observed samples and that the sequence of observed samples embeds information about the sequence of states. Statistically, HMM is based on the Markov property that the current true state is conditioned only on the value of the hidden variable 1 but is independent of the past and future states. Similarly, the observation only depends on the hidden state . The famous solution to HMM is the Baum-Welch algorithm, which derives the maximum likelihood estimate of the parameters of the output given the data set of output sequences. When applied to intrusion detection systems, HMMs can effectively model variations in system behavior. To apply HMM for anomaly intrusion detection, we need a set of normal activity states = { , … . , } and a set of normal observations = { , … . , } [35] , [37].
Given an observation sequence = { , … . , }, the HMM searches for a normal state sequence of = { , … . , } which has a predicted observation sequence most similar to Y with a probability for examination. If this probability is less than a predefined threshold, we declare that this observation indicates an anomaly state [35].
Support Vector Machines (SVM)
This approach use Support Vector Machines (SVM), which are one of the leading machine learning tools, mostly used as a classifier. SVM is a family of learning algorithms for classification of data into two classes. It uses a function to map data into a space where it is linearly separable. The space where the data is mapped may be of higher dimension than the initial space. The SVM allows finding a hyperplane which optimally separates the classes of data: the hyper-plane is such that its distance to the nearest training data points is maximal [35].
The SVM has shown superior performance in the classification problem and has been used successfully in many real-world problems. However, the weakness of SVM is that it needs prior labelled data and is very sensitive to noise [35] , [38].
When applied to intrusion detection systems, patterns in the data that are normal or abnormal may not be obvious to operators and all above techniques rely on this prior information. Although these techniques proved to be a powerful classification tool, it is difficult without labelled data for tuning the algorithm [35].
38
One Case SVM (OCSVM): CockpitCI Approach
This approach aims to overcome the issue described above. The OCSVM separates attack data from the normal data, and can be considered as a regular two-class SVM where all the data lies in the first class and the origin is the only member of the second class. The basic idea of the OCSVM is to map the input data into a high dimensional space and construct an optimal separating hyper plane, which is defined as the one with the maximum spreading between the two classes. This optimal hyper-plane can be solved easily using a dual formulation. The solution is sparse and only support vectors are used to specify the separating hyper-plane. The number of support vectors can be very small compared to the size of the training set and only support vectors are important for prediction of future points. A function can be used to compute the separating hyper-plane without explicitly carrying out the mapping operations into the feature space and all necessary computations are performed directly in the input space [35] , [39].
Figure 26: OCSVM classification [35]
When applied to intrusion detection systems,OCSVM is used to train the offline data and generate a detection model. This model is used for intrusion detection. If the decision model returns a negative value, it implies an abnormal event. Unlike other classification methods, OCSVM does not need any labelled data (no signatures required) for training or any information about the kind of intrusion [35].
The researchers also provide a performance comparison of the described machine learning techniques, show in table 2.
39
Table 2: Performance comparison of machine learning techniques [35]
3.4 Ontology based SCADA Intrusion Detection
Researchers at the Fraunhofer IOSB in Germany has published a paper, where they propose an ontology-based intrusion detection framework for SCADA-systems [40]. The ontology-framework focuses on modeling alerts, attacks, vulnerabilities and systems, combining these with reasoning. The ontologies are used to map uniformly and normalize the different security reports created from existing security components of a SCADA system [40].
The alert ontology maps alerts from Snort and OSSEC in the Intrusion Detection Message Exchange Format (IDMEF). The base element of an IDMEF alert is the alert element that describes an alert and its properties [40].
40
Figure 27: Alert-ontology [40]
The attack ontology describes attacks to systems inferred by the reasoning component. An attack has a reference to a describing it, the attacker and a trigger identified by its IP address or name. It may contain references to the addresses of the involved targets or specific alerts, concluding that it was an attack [40].
The system ontology is derived from the topology information and describes networks, its components and connections between these. Snort provides lists of all recognized systems and software running on them. OpenVAS produces a report for every scanned system, containing information about the software, hardware, operating systems, hostnames, IP addresses, port numbers, running services, version numbers and more [40].
The vulnerability ontology provides information about vulnerabilities and security gaps, found by OpenVAS and general ones from the Common Vulnerability Enumeration (CVE) online database. The elements of the vulnerability ontology are a description of the vulnerability, countermeasures, a reference to a source containing this vulnerability, origin and where the entry originates from CVE or OpenVAS [40].
The inferred ontology serves as an interface to the functions of the reasoning component. This component registers rules, starts the reasoning process and reports the results. After constructing the data structures, the initialized reasoning component may draw conclusions and produce an output. Relationships between the different ontologies may be elaborated and complex conclusions inferred [40].
![Figure 5: Hierarchy of the five levels of distribution automation (DA)[1]](https://thumb-us.123doks.com/thumbv2/123dok_us/9896436.2483204/16.892.84.596.513.739/figure-hierarchy-levels-distribution-automation-da.webp)
![Figure 6: DA level interconnection [1]](https://thumb-us.123doks.com/thumbv2/123dok_us/9896436.2483204/17.892.82.469.318.665/figure-da-level-interconnection.webp)
![Figure 8: Second generation SCADA Architecture [6]](https://thumb-us.123doks.com/thumbv2/123dok_us/9896436.2483204/19.892.82.489.102.371/figure-second-generation-scada-architecture.webp)
![Figure 10: Fourth generation SCADA Architecture [8]](https://thumb-us.123doks.com/thumbv2/123dok_us/9896436.2483204/20.892.77.532.109.406/figure-fourth-generation-scada-architecture.webp)
![Figure 11: IEC 60870-5-104 APDU [11]](https://thumb-us.123doks.com/thumbv2/123dok_us/9896436.2483204/21.892.82.555.117.381/figure-iec-apdu.webp)
![Figure 17: Modbus TCP/IP communication architecture [13]](https://thumb-us.123doks.com/thumbv2/123dok_us/9896436.2483204/24.892.78.579.105.330/figure-modbus-tcp-ip-communication-architecture.webp)
![Figure 20:Interrelations between the IEC TC57 standards and the IEC 62351 security standards [20]](https://thumb-us.123doks.com/thumbv2/123dok_us/9896436.2483204/27.892.80.625.444.708/figure-interrelations-iec-tc-standards-iec-security-standards.webp)
![Figure 23: Multilayer SCADA cyber-security framework with IDS [31]](https://thumb-us.123doks.com/thumbv2/123dok_us/9896436.2483204/34.892.79.424.97.532/figure-multilayer-scada-cyber-security-framework-ids.webp)
