Temporal Interpretation for Land Use/Land Cover Changes
Using Multispectral Images: Irbid as a Case Study
Majed Ibrahim
Geographic Information system and Remote Sensing Department – Al albayt University - Jordan
Abstract
Understanding changes patterns for the land use/land cover (LULC)are important aspects of manage planning in order to give interpretations for the relationship between natural recourses and human activities. Therefore, the temporal interpretation for LULC changes through the use of multi-spectral images performs an essential procedure to assess the driving forces of the changes as well as changes detection in LULC. The multi-techniques are widely used to study the impact of the urbanization on LULC. On the other hand ,Landsat satellite images for the two years 1990 and 2015 have been used for in this study. Computerized systems have also been incorporated to prepare data and get results of such studies. The classification of LULC was validated through the use of an accurate assessment method. This study concluded built up areas that are increased by approximately 391 Km2 (18.00 %).Most of vegetation have changed to arable land due to urbanization, where the vegetation area decreased to 15.16 % of the total area, and the overall accuracy of classificationswas80% and 82% for 1990 and 2015 respectively.
Keywords: Land use, Land cover, Satellite image, Landsat, Classification, Accuracy assessment,
I. Introduction
Through the past three decades, the world encounters many environmental challenges affecting the natural resources. Because of the lack of rainfall, increase of evaporation, and decrease in vegetation cover, the countries in arid and semi-arid regions are more influenced than other countries of the world. Therefore, LULC changes are important factors in global environmental changes, where other factors has the ability to determine and affect the LULC changes; most of which come out of human factors, such as: urbanization, economic and industrial growth, development science, technology revolution, growth in population, and natural phenomena (Sharma et al., 2013. Ahmad and Farooq, 2006). In the same context, the recent years have shown massive challenges that have been come to light for society, where environment resources come from the effect of the high growth of population, climate change and overconsumption of ecosystem that represents the greatest threat (Nagarajan and Poongothai, 2011. Sachs et al, 2009). Furthermore, human activities lead to noticeable changes in the most of ecosystem in the world (Alqurashi and Kumar, 2014. Giri, 2012. Ramankutty and Foley, 1998. Vitousek et al, 1997).
For the natural resources, the vegetation cover is not only affected by the surface and soil characteristics but also by the density of land use, types of the land use, surface hydrology (runoff). Hydrogeology is influenced by land use changes (Nagarajan and Poongothai, 2011. Lynn, 2009). Thus, it is important to recognize LULC changes in an attempt to get a suitable land planning, control on the land management activities, and sustainability. It also provides the adequate knowledge of land use changes that could provide interpretations for the relationship between the natural recourses and human activities through the last periods in specific areas; that is, we can get a better way to construct decision making.
The land cover reflects the physical state of the earth's surface; whereas, the land use is a criterion related to economic and social activities that use the land (Nagarajan and Poongothai, 2011. Konecny, 2003). Thus, comprehension of the spatial data and determining LULC information lead to the ideal use of land planning, management human activities, and selecting land use (Sharma et al., 2013). Remote sensing and Geographic Information System (GIS) are widely used as a technique that has new tools to monitor changes in the LULC (Alqurashi and Kumar, 2014), and have high quality methods to get accurate results according to the provided data acquisition.
During the past twenty years, Jordan has witnessed rapid growth in population (natural and coercive increasing), especially in the regions that are located in borders and this is one of the important factors for selecting Irbid, which is located on the northwest border, as a case study. The study area has been altered by human activities in specific agriculture lands.
2. Materials and Method I. Study Area
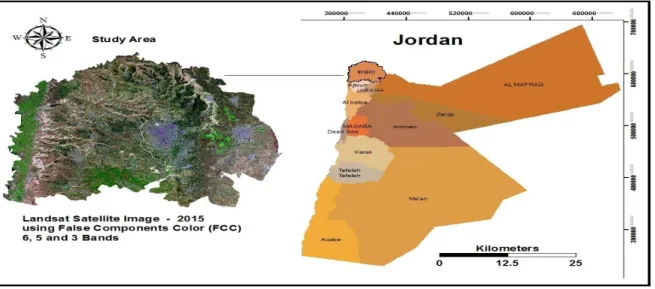
The study area is located in the northern west part of the Jordan, and covers about 2170 Km2, that is delimited between latitudes (739523 and 790050 UTM) and longitude (3585438 and 3627428 UTM). Figure 1. shows the location of the study area.. The climate of the selected area is Mediterranean; it is characterized by a cool, rainy winter from October until early April, and a hot, dry summer from April until early October. August is the hottest month with the average daily temperature rangingbetween24 to 28C.January is the coldest month with a daily
temperature of 8 to 10 C (Ibrahim, 2010).
II. Data Acquisition
Preparation of data for this study requires satellite archive usedLandsat 4-5 TM (Thematic Mapper ) and Landsat 8 OLI (Operational Land Imager) - TIRS (Thermal Infrared Sensor) that isused in this study in the same seasonal period. Which includepath 169 and row 45, where landsat 4-5 TM image taken in (May -1990)and landsat 8 OLI \TIRS taken in MAY 2015. Both images were obtained from the United States Geological Survey (USGS), Global Visualization (GloVis) site, and geometrically corrected and rectified to UTM zone 36.
Figure 1: Location Map of study area
III. The Used Applications
• ERDAS IMAGINE 2014 in this study ERDAS was applied for importing and classification.
• Arc GIS 10.2 for digitizing, preparation of LULC layer,accuracy assessment, Geo-referencing, and creation of database (such as Ground Control Points).
• Arc map for composition and generation of maps.
Methodology
Image processing and geometric rectification techniques were undertaken for processing the digital data, a subset of each landsat digital images acquired inof (May -1990\2015)covering area. The digital images were geometrically and radio-metrically calibrated to each other to facilitate their comparison. Geometric rectification is critical for production spatially corrected maps through time. Accurate per-pixel registration of multi-temporal remote sensing data is essential for change detection since the potential exists for registration errors to be interpreted as land-cover and land-use change, leading to an overestimation of actual change (Ibrahim, 2010, Barrett and Curtis, 1976).
Image processing
The goal of image enhancement is to improve the visual interpretability of an image by increasing the apparent distinction between the features. This process used in this study using false components color (FCC), where the FCC were visually interpreted using on screen digitizing in order to delineate land cover classes that could be easily interpreted (Ibrahim, 2010). FCC used in TM bands 2, 3 and 4 color combination for landsate 4-5 images in 1990 while in 2015 were used 4, 5 and 6 color combination in landsate 8 OLI to support visual interpretation and analysis purpose of earth's surface in the study area. Generally color bands were done in order to extract the information of three main spectral window of electromagnetic spectrum wavelength for the lands at imagery (visibale, near-infrared and thermal infrared sensor (TIRS)). In addition it was found the root mean square error (RMSE) in this process was less than 0.5 pixels.
Image classification
Classification approach, which is used to land use mapping, is supervised classification that has occurred between two different periods where it is the process of classifying the unknown-identity pixels by using samples of known identity. These are pixels located within training-set statistics used to classify image, maximum likelihood algorithm (MLA) providedin ERDAS software which had been used for the land use/land cover mapping. The MLA is based on comparisons of the upper and lower limits of data values for all candidate-unit pixels, and based on image spatial resolution and truth ground control points (GCPs), for interpretation of remote sensor data at various scales and it was used following three main land use classes:
category includes: agricultural land, cropland, pasture, forest and grassland.
3. Arable land category includes the lands that could be cultivated and use it to agriculture. 4. Water bodies includes: lakes, water pools and a small area of still water.
5. Soil Barren land has thin soil, sand, or rock, category includes: Bar Exposed Rock, transitional Area and Mixed Barren Land.
Accuracy assessment
Accuracy refers to the level compatibility between the signs (as assigned by the analyst) and locations of classes on the ground (truth points) in order to obtain valid conclusions about map's accuracy from samples of it, and this criteria is important to validation of results. Three standard criteria were used to assess the accuracy of the classifications (overall accuracy, producer's accuracy and user's accuracy) (lillesand and Kiefer, 2000):
Overall accuracy = total number correct / total reference or total classified * 100 Producer's accuracy = number correct / total reference
User's accuracy = number correct / total classified
IV. Result and Discussion IV.I Land use / land cover changes
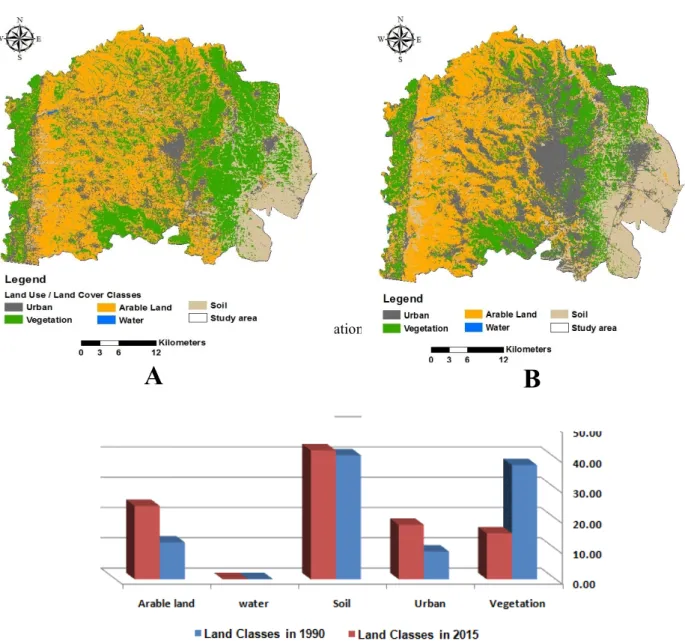
The area was chosen to present study whether it's multispectral is useful to change detection of land use/land cover and to detect effect the commercialization and industrialization, Spatial patterns of LULC changes in study area is shown in Figure 2. (A and B) for the 1990 and 2015 respectively, and different land use identified in the study area are displayed as follows:
Urban area (Built Up area)
It was observed that built up area was taken from vegetation and arable landsdue to urbanization and industrialization of the rapid growing. The built up area covered 9.17 of total area during1990,while it increased up to 18.00 in 2015.
Vegetation
It is observed that the changes in the vegetation area where was 37.69% in 1990 and reach up to 15.16% in 2015. most of these changes due to urbanization and changed to arable land, where Normally, increasing urban areas results in decreasing the vegetation cover.
Arable land
It was interesting to observe that arable land of study area cover40.92 % of total area during 1990 and increased to reach up to 42.55 % in 2015. Most of the arable land changed from vegetation area.
Water bodies
During the 1990 the water bodies covered about 1 km2 of total study area which increased to 2 km2 during 2015,and this increasing in the area of water bodies return to amount of rainfall in 2015 which leading to increase area of water bodies.
Soil
The soil cover mainly exists in the east part of study area. Spatial distribution of soil covered increased to 40.92% of total area during 2015 from 42.55% in 1990 for whole area.
Individual class area and change statistics for the two years for area is summarized in Table 1, and it indicates the area under different classes of land use / land cover between 1990 – 2015. Figure 3. shows the percentage of land use / land cover classes in study area between these periods.
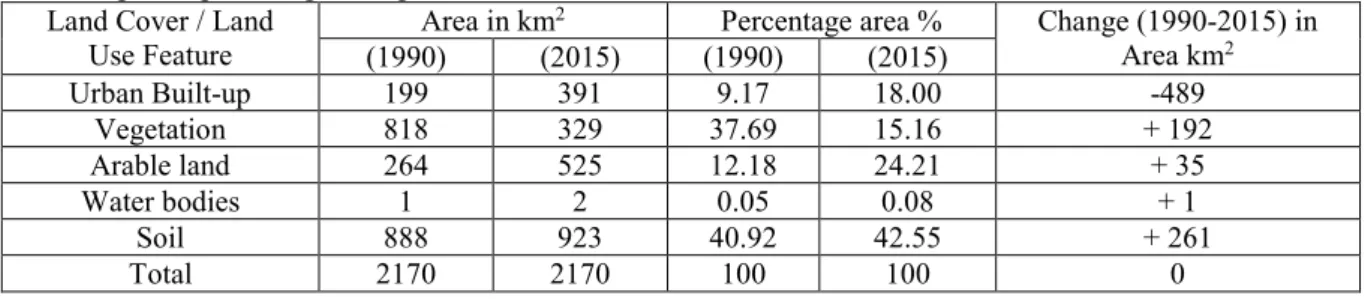
Table 1. Results of land use/land cover classification for 1990 and 2015 for study area showing area, area change and percentage change.
Land Cover / Land Use Feature
Area in km2 Percentage area % Change (1990-2015) in Area km2 (1990) (2015) (1990) (2015) Urban Built-up 199 391 9.17 18.00 -489 Vegetation 818 329 37.69 15.16 + 192 Arable land 264 525 12.18 24.21 + 35 Water bodies 1 2 0.05 0.08 + 1 Soil 888 923 40.92 42.55 + 261 Total 2170 2170 100 100 0
Figure 2. Land use/land cover classification of study area in: (a) 1990 and (b) 2015.
Figure 3. The area of land use / land cover classes in study area expressed as a percentage.
IV. II Accuracy assessment
Error matrices of maximum likelihood classification was used to assess classification accuracy and are summarized for all years in Table 2. 200 samples were randomly selected in order to examine the image classification accuracies. The producer’s and user’s accuracies of both pixel-based classification showed a high percentage in the vegetation class. This is because the vegetation is scattered and easily distinguished from satellite images. Additionally, vegetation gives a unique spectral reflectance in the thermal bands. The overall accuracies of maximum likelihood classification for 1990 and 2015 were 80 and 82 percent.
Table 2. overall accuracies of maximum likelihood classification for 1990 and 2015. Land Cover / Land
Use Feature
1990 2015
Producer’s User’s Producer’s User’s
Urban Built-up 89 92 91 93 Vegetation 95 96 97 94 Arable land 92 91 92 90 Water bodies 97 95 94 93 Soil 87 90 93 96 Overall accuracy 80 82
B
A
were found to have experienced rapid changes in land use types or land cover. The percent changes determined for the total area can be summarized as follows: (1) The urban areas increased by approximately 391 km2 about (18%) of total area which represent the size of the industrialization and population density. (2) The expansion of the urban areas in study area exhibited clear spatiotemporal differences. (3) The expansion of the soil is distributed to covered42.55 % of total area which increased throughout these years. (4) It was found that the accuracy of land use /land cover changes using remote sensing data about 80 and 82 for 1990 and 2015 respectively, which mean significant accurate.
This research summarizes the information provided by remote sensing data, along with ancillary data such as population density or population growing rate; it can play an important role to understand the relationship between population density, urbanization or industrial development and LULC changes. Generally, the of use multi-temporal data sets is necessary to develop methodologies that utilize information and is significant to understand the changes in the pattern of the long-term land use/land cover dynamics. The temporal interpretation using satellite data and GIS techniques were essential for further planning and development of urban growth in the future.
IV. Acknowledgement
The author is grateful to Al-al Byat University to provide software and I thank also to Eng. Bayan Nigresh to help in bibliography collection in this study..
References
Ahmad, S and Farooq, S. (2006). The techniques of remote Sensing and GIS techniques for urban development Aligarh. JISRS Vol 36.
Alqurashi, A, F. Kumar, L. (2014). Land Use and Land Cover Change Detection in the Saudi Arabian Desert Cities of Makkah and Al-Taif Using Satellite Data. Advances in Remote Sensing. Vol. 3. Page 106-119. Barrett, E. C., Curtis, L, F., (1976). Introduction to Environmental Remote Sensing. Department of Geography.
University of Bristol.
Giri, C.P. (2012) Remote Sensing of Land Use and Land Cover: Principles and Applications. CRC Press, Boca Raton.
Ibrahim, M. (2010) Environmental Assessment of Land Use Changes Using Remote Sensing and GIS Techniques in Irbid Area. Master Thesis unpublished, Al al-Bayt University, Al Mafraq.
Konecny, G. (2003). Geoinformation: Remote sensing, Photogrammetry and Geographic Information Systems, page 248.
Lillesand, T, M., and Kiefer, R, W., (2001) Remote Sensing and Image Interpretation, 4th ed, John Wiley and Sons, inc. USA, ISBN: 0471255157.
Lynn E. Johnson. (2009). Geographic Information systems in Water Resources Engineering, CRC Press, Taylor & Francis Group, New York. Page 82.
Nagarajan. N., Poongothai. S. (2011). Trend in Land Use/Land Cover Change Detection by RS and GIS Application. International Journal of Engineering and Technology. Vol. 3 ( 4). Page 263-269.
Ramankutty, N. and Foley, J.A. (1998) Characterizing Patterns of Global Land Use: An Analysis of Global Croplands Data. Global Biogeochemical Cycles. Vol. 12. Page 667-685. http://dx.doi.org/10.1029/98GB02512.
Sachs, J.D. et al. (2009). Biodiversity conservation and millennium development goals. Science, Vol 325 (5947). Page 1502 – 03.
Sharma. M. P., Yadav. K., Prawasi. R., Hooda R.S. (2013). Land use /Land cover change Detection Using GIS Technique : a case study of Bhiwani district. Journal of Environmental Science and Sustainability (JESS). Vol. 1 (4): 124 – 128, 2013.
Vitousek, P.M., Mooney, H.A., Lubchenco, J. and Melillo, J.M. (1997) Human Domination of Earth’s Ecosystems. Science. Vol. 277. Page 494-499. http://dx.doi.org/10.1126/science.277.5325.494.