Developing Accident-Speed Relationships
Using a New Modelling Approach
by
Maria-Ioanna Imprialou
A Doctoral Thesis
Submitted in partial fulfillment of the requirements for the award of
Doctor of Philosophy of Loughborough University
August, 2015
c
Abstract
Changing speed limit leads to proportional changes in average speeds which may affect the number of traffic accident occurrences. It is however critical and challenging to eval-uate the impact of a speed limit alteration on the number and severity of accidents due primarily to the unavailability of adequate data and the inherent limitations of exist-ing approaches. Although speed is regarded as one of the main contributory factors in traffic accident occurrences, research findings are inconsistent. Independent of the ro-bustness of their statistical approaches, accident frequency models typically use accident grouping concepts based on spatial criteria (e.g. accident counts by link termed as a link-based approach). In the link-link-based approach, the variability of accidents is explained by highly aggregated average measures of explanatory variables that may be inappropriate, especially for time-varying variables such as speed and volume. This thesis re-examines accident-speed relationships by developing a new accident data aggregation method that enables improved representation of the road conditions just before accident occurrences in order to evaluate the impact of a potential speed limit increase on the UK motorways (e.g. from 70 mph to 80 mph).
In this work, accidents are aggregated according to the similarity of their pre-accident traffic and geometric conditions, forming an alternative accident count dataset termed as the condition-based approach. Accident-speed relationships are separately developed and compared for both approaches (i.e. link-based and condition-based) by employing the reported annual accidents that occurred on the Strategic Road Network of England in 2012 along with traffic and geometric variables. Accident locations were refined using a fuzzy-logic-based algorithm designed for the study area with 98.9% estimated accuracy. The datasets were modelled by injury severity (i.e. fatal and serious or slight) and by number of vehicles involved (i.e. single-vehicle and multiple-vehicle) using the
multivari-ate Poisson lognormal regression, with spatial effects for the link-based model under a full Bayesian inference method.
The results of the condition-based models imply that single-vehicle accidents of all sever-ities and multiple-vehicle accidents with fatal or serious injuries increase at higher speed conditions, particularly when these are combined with lower volumes. Multiple-vehicle slight injury accidents were not found to be related with higher speeds, but instead with congested traffic. The outcomes of the link-based model were almost the opposite; sug-gesting that the speed-accident relationship is negative. The differences between the results reveal that data aggregation may be crucial, yet so far overlooked in the method-ological aspect of accident data analyses. By employing the speed elasticity of motorway accidents that was derived from the calibrated condition-based models it has been found that a 10 mph increase in UK motorway speed limit (i.e. from 70 mph to 80 mph) would result in a 6-12% increase in fatal and serious injury accidents and 1-3% increase in slight injury accidents.
Acknowledgements
Although only my name appears on the cover of this thesis, it would not be possible to complete this work without the contribution of many people. I would like to take this opportunity to thank all those who have supported me throughout the development of this project.
Foremost, I would like to express my gratitude to my supervisors, Professor Mohammed Quddus and Dr David Pitfield for their immense support and guidance during the last three years. Professor M. Quddus has been an excellent mentor to me who dedicated time and effort in helping me to develop my ideas and also motivated and guided my broader development as a researcher. Dr D. Pitfield has been always there to listen my concerns and provided me with sound advice and encouragement every time I needed it.
I would like to thank Dr. Dominique Lord for providing me with useful feedback during my two-week student visit in the Zachry Department of Civil Engineering of Texas A&M University, US. Moreover, I thank Professor Lin Zhao and his research team as well as Dr. Liang Li for hosting me as an exchange student in the School of Automation in Harbin Engineering University, China, where I developed a part of my research. I am also grateful to Professors Benjamin Heydecker and Mike Maher from University College London for their valuable comments on my project.
My sincere thanks also go to Mr Martin Lynch, Mr Stuart Lovatt, Ms Elizabeth Martin and Mr Roy Jones from Highways England, Ms Ann Hayes from Capita, Dr. Ramesh Perera and Mr Chris Page from AECOM for providing me with the necessary data for my analysis and their support during the course of this work.
Special thanks to my parents, my sister Martha and my partner (and proofreader of this thesis!) Anastasis for their patience, love and constant support. I also thank all my fellow researchers from the Research Hub and especially my good friends Dr Efi Spentzou, Elli Nikolaidou, Dr Ali Alsaygh, Nafsika Drossou, Vivi Vatougiou and Stavros Kassinos for making my PhD experience much more enjoyable and interesting.
Last but not least, I must acknowledge my former supervisor during my studies at the National Technical University of Athens, Matthew Karlaftis (1969-2014) who believed in my potential as a researcher, inspired me and truly encouraged me to pursue this doctoral degree. I dedicate this thesis to his memory.
Contents
Abstract i
Acknowledgements iii
Contents v
List of Figures ix
List of Tables xiii
1 Introduction 1
1.1 Background . . . 1
1.2 Problem Statement . . . 3
1.3 Research Importance . . . 4
1.4 Aim and Objectives . . . 5
1.5 Thesis Outline . . . 6
2 Literature Review of Findings and Methods of Accident Analyses 7 2.1 Motivation . . . 7
2.2 Speed and Accidents . . . 8
2.2.1 Speed limits and accidents . . . 9
2.2.1.1 Speed limit increases . . . 9
2.2.1.2 Meta-analyses . . . 12
2.2.2 Speed and speed variance . . . 16
2.3 Other Explanatory Variables . . . 19
2.3.1 Traffic characteristics and accidents . . . 20
2.3.2.1 Curvature . . . 22
2.3.2.2 Gradient . . . 23
2.3.2.3 Number of lanes . . . 24
2.4 Statistical Approaches in Accident Modelling . . . 25
2.4.1 Evolution of the statistical approaches . . . 25
2.4.2 Limitations . . . 28
2.5 Accident Mapping . . . 30
2.5.1 The role of accident mapping . . . 30
2.5.2 Review of accident mapping methods . . . 32
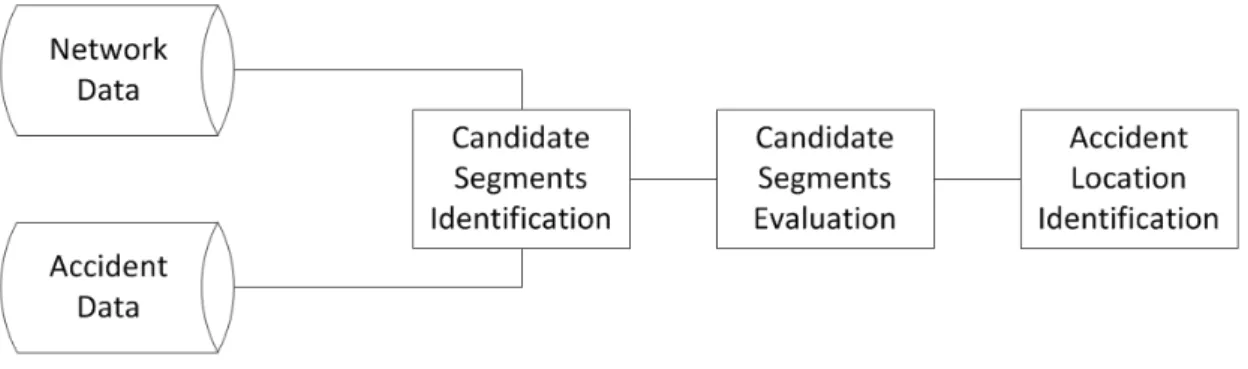
3 Methodology 39 3.1 Introduction . . . 39
3.2 Research Design . . . 40
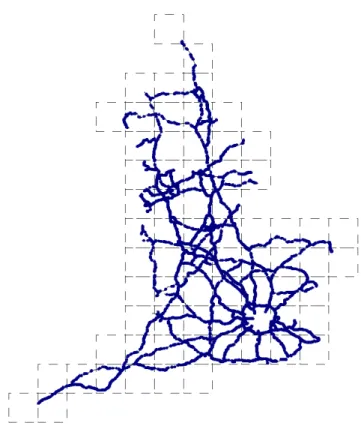
3.3 Accident Mapping Algorithm . . . 41
3.3.1 Introduction . . . 41
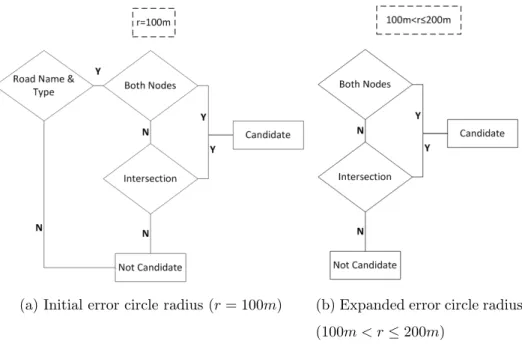
3.3.2 Candidate segment identification . . . 42
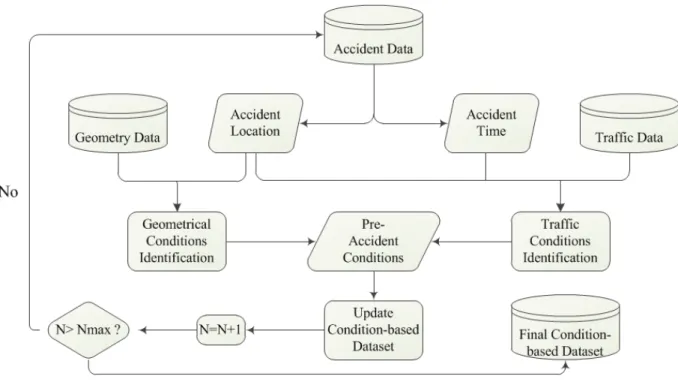
3.3.3 Segment selection . . . 45 3.3.4 Accident location . . . 49 3.3.5 Algorithm evaluation . . . 50 3.4 Link-Based Approach . . . 52 3.4.1 Exposure . . . 53 3.5 Condition-Based Approach . . . 54
3.5.1 Traffic conditions identification . . . 57
3.5.2 Geometry conditions identification . . . 58
3.5.3 Condition-based dataset formation . . . 59
3.5.4 Exposure . . . 61
3.6 Modelling Accident Counts . . . 61
3.6.1 Poisson regression . . . 62
3.6.2 Univariate Poisson lognormal regression . . . 63
3.6.3 Multivatiate Poisson lognormal regression . . . 64
3.6.4 Spatial correlation . . . 66
3.7 Modelling Strategy . . . 67
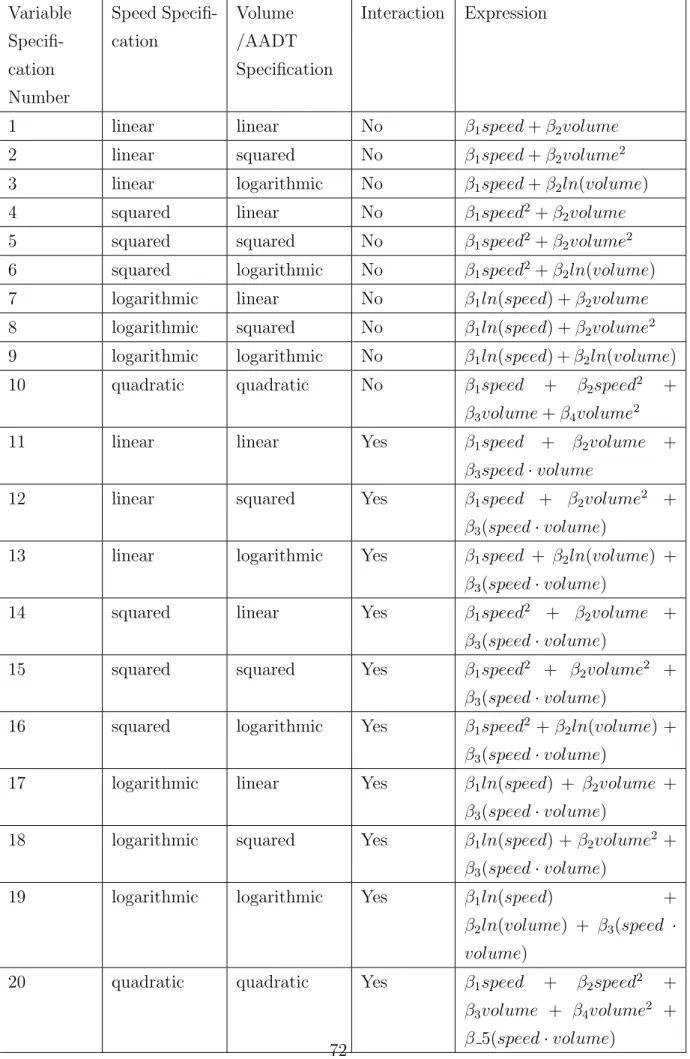
3.7.2 Independent variable expressions . . . 70
3.7.3 Deviance information criterion . . . 73
3.8 Summary . . . 74
4 Data Description and Pre-Processing 75 4.1 Introduction . . . 75
4.2 Data Description . . . 75
4.2.1 The study road network . . . 75
4.2.2 Accident data . . . 79
4.2.2.1 Accident data limitations . . . 81
4.2.3 Traffic Data . . . 83
4.2.3.1 Traffic data limitations . . . 85
4.2.4 Geometry data . . . 86
4.3 Data Refinement and Pre-processing . . . 86
4.3.1 Accident mapping algorithm results . . . 86
4.3.2 Link-based dataset . . . 91
4.3.3 Condition-based dataset . . . 95
4.4 Summary . . . 101
5 Modelling Results and Discussion 102 5.1 Introduction . . . 102
5.2 Link-Based Models . . . 103
5.2.1 All accidents . . . 104
5.2.2 Accidents by severity type . . . 107
5.2.3 Accidents by collision type . . . 111
5.2.4 Single-vehicle accidents by severity . . . 114
5.2.5 Multiple-vehicle accidents by severity . . . 117
5.3 Condition-Based Models . . . 120
5.3.1 All accidents . . . 121
5.3.2 Accidents by severity type . . . 123
5.3.3 Accidents by collision type . . . 128
5.3.4 Single-vehicle accidents by severity . . . 131
5.4 Comparison of the Link-Based and the condition-based Approaches . . . . 142
5.5 The Impact of Accident Location Accuracy in Accident Modelling . . . 145
5.6 Summary . . . 150
6 Impact Estimation and Policy Implications 152 6.1 Introduction . . . 152
6.2 The Impact of a Speed Limit Increase . . . 152
6.3 Recommendations for Accident Prevention Policies . . . 155
6.4 Summary . . . 158
7 Conclusions 159 7.1 Summary . . . 159
7.2 Contribution to Knowledge . . . 162
7.3 Study Limitations . . . 164
7.4 Extensions and Suggestions for Future Research . . . 166
Appendix A 187
Appendix B 195
List of Figures
2.1 Best estimates of exponents for different accident or injury severity groups
(source: Elvik et al., 2004) . . . 14
2.2 Best estimates of exponents for different accident or injury severity groups by road type (source: Elvik, 2009) . . . 15
2.3 Accident involvement rate as a function of driving speeds for day (solid line) and night (dashed line) (source: Solomon, 1964). . . 18
2.4 Examples of complex accident mapping cases (source:BingMaps) . . . 31
3.1 Flow chart of the main three steps of AMF . . . 42
3.2 Error circle and a candidate segment . . . 43
3.3 Candidate segment identification process in four steps . . . 45
3.4 The sequence of checks for each road segment of the network for the can-didate segment set formulation. . . 45
3.5 FIS input (a and b) and output (c) membership functions . . . 48
3.6 Map of the road network divided by the 70 equal and mutually exclusive clusters. . . 51
3.7 Example of a road network and the total accidents that occurred on it during a study period. . . 53
3.8 Example of the traffic conditions on a road network at subsequent time intervals (t1 −t16) and the total accidents that occurred during a study period. . . 55
3.9 Flow chart of the Condition-Based dataset development process. . . 57
3.10 Road length upstream and downstream of an accident location for defining the road geometry that is considered for each accident. . . 59
4.1 Map of the Strategic Road Network (SRN) of England. (source:(Highways Agency, 2015)) . . . 76 4.2 Representation of a road section of the A14 according to HATRIS (blue)
and HAPMS (red). . . 77 4.3 Road sections on the A500 (a) full and (b) divided into their shapepoints . 78 4.4 Accident distribution per minutes of the reported accident time (the
hori-zontal bar shows the expected percentage per minute group (1.67%) if the distribution of accidents was, as expected, uniform) . . . 82 4.5 (a) Annual distribution and (b) cumulative distribution of speed on the
SRN (∼Dagum(0.15,28.65,113.64)) . . . 83 4.6 (a) Annual distribution and (b) cumulative distribution of volume on the
SRN (∼W eibull(0.91,282.61,0.25)) . . . 84 4.7 (a) Annual distribution and (b) cumulative distribution of volume per lane
on the SRN (∼Kumaraswamy(0.91,5.97,0.25,1141.8)) . . . 84 4.8 (a) Annual distribution and (b) cumulative distribution of speed on
mo-torways (∼f our−parameterDagum(0.40,803.91,3639.4,−3527.2)) . . . . 84 4.9 (a) Annual distribution and (b) cumulative distribution of volume on
mo-torways (∼Beta(0.85,3.78)) . . . 85 4.10 (a) Annual distribution and (b) cumulative distribution of volume per lane
on motorways (∼Kumaraswamy(0.92,7.07,0.13,1653.2)) . . . 85 4.11 Accident locations at a segment of the M4 motorway . . . 89 4.12 Accident locations at the M25-A13 junction . . . 90 4.13 Frequency and cumulative distribution of the 15-minute speed at the time
and the location of the accident by the annual average of the speed on this link. . . 93 4.14 Frequency and cumulative distribution of the 15-minute volume at the time
and the location of the accident by the annual average of the speed on this link. . . 93 5.1 Contour plot of the predicted accidents per mile as a function of speed and
5.2 Contour plot of the predicted (a)fatal and serious (KS) and (b) slight (Sl) accidents per mile as a function of speed and AADT (model: Link-based KS-Sl AMF (3)). . . 110 5.3 Contour plot of the predicted (a)fatal and serious (KS) and (b) slight (Sl)
accidents per vehicle hours travelled per mile as a function of speed and AADT (model: Link-based SV-MV (3)). . . 113 5.4 Contour plot of the predicted single-vehicle (a)fatal and serious (SV KS)
and (b) slight (SV Sl) accidents per per mile as a function of speed and AADT (model: Link-based SV KS-Sl ()). . . 116 5.5 Contour plot of the predicted multiple-vehicle (a)fatal and serious (MV KS)
and (b) slight (MV Sl) accidents per per mile as a function of speed and AADT (model: Link-based MV KS-Sl (3)). . . 119 5.6 Contour plot of all the predicted accidents per vehicle hours travelled per
mile as a function of speed and volume per lane (model: Condition-based All (10)). . . 122 5.7 Contour plot of the predicted (a)fatal and serious (KS) and (b) slight (Sl)
accidents per vehicle hours travelled per mile as a function of speed and volume per lane (model: Condition-based KS-Sl AMF (20)). . . 126 5.8 Contour plot of the predicted (a) single-vehicle (SV) and (b)
multiple-vehicle (MV) accidents per multiple-vehicle hours travelled per mile as a function of speed and volume per lane (model: Condition-based SV-MV (10)). . . . 130 5.9 Contour plot of the predicted (a) fatal or serious (KS) and (b) slight (Sl)
single-vehicle (SV) accidents per vehicle hours travelled per mile as a func-tion of speed and volume per lane (model: Condition-based SV KS-Sl (9)). 133 5.10 Contour plot of the predicted (a) fatal or serious (KS) and (b) slight (Sl)
motorway single-vehicle (SV) accidents per vehicle hours travelled per mile as a function of speed and volume per lane (model: Condition-based SV KS-SL moto (3)). . . 135 5.11 Contour plot of the predicted (a) fatal or serious (KS) and (b) slight (Sl)
multiple-vehicle (MV) accidents per vehicle hours travelled per mile as a function of speed and volume per lane (model: Condition-based MV KS-Sl (18)). . . 139
5.12 Contour plot of the predicted (a) fatal or serious (KS) and (b) slight (Sl) motorway multiple-vehicle (MV) accidents per vehicle hours travelled per mile as a function of speed and volume per lane (model: Condition-based
MV KS-SL moto (12)). . . 141
6.1 Graphical representation of the speed spillover mechanism on the SRN. . . 153
A.1 Speed distribution of all accidents. . . 187
A.2 Speed distribution of fatal accidents. . . 187
A.3 Speed distribution of serious accidents. . . 188
A.4 Speed distribution of slight accidents. . . 188
A.5 Speed distribution of fatal single vehicle accidents. . . 188
A.6 Speed distribution of serious single vehicle accidents. . . 189
A.7 Speed distribution of slight single vehicle accidents. . . 189
A.8 Speed distribution of fatal multiple vehicle accidents. . . 189
A.9 Speed distribution of serious multiple vehicle accidents. . . 190
A.10 Speed distribution of slight multiple vehicle accidents. . . 190
A.11 Volume per lane distribution of all accidents. . . 191
A.12 Volume per lane distribution of fatal accidents. . . 191
A.13 Volume per lane distribution of serious accidents. . . 192
A.14 Volume per lane distribution of slight accidents. . . 192
A.15 Volume per lane distribution of fatal single vehicle accidents. . . 192
A.16 Volume per lane distribution of serious single vehicle accidents. . . 193
A.17 Volume per lane distribution of slight single vehicle accidents. . . 193
A.18 Volume per lane distribution of fatal multiple vehicle accidents. . . 193
A.19 Volume per lane distribution of serious multiple vehicle accidents. . . 194
List of Tables
2.1 Link-based accident analyses grouped by statistical approach employed. . . 26
2.2 Characteristics of existing accident mapping techniques . . . 34
3.1 Research objectives and methods. . . 40
3.2 Comparison of the proportion of accidents included to the reference set split according to the three main road types . . . 50
3.3 Example of the link-based accident dataset for the network of Figure 3.7 . 53 3.4 Example of the condition-based accident dataset for the network of Figure 3.8 . . . 55
3.5 Dependent variable combinations . . . 69
3.6 Independent variable specification combinations. . . 72
4.1 Percentage of accidents on the SRN by month. . . 80
4.2 Percentage of accidents by number of vehicles involved. . . 80
4.3 Percentage of accidents by severity. . . 81
4.4 Percentage of accidents by number of casualties. . . 81
4.5 Estimation of accuracy and average distance for the four examined accident mapping methods . . . 88
4.6 Definition of variables of the link-based dataset . . . 92
4.7 Descriptive statistics of the variables of the link-based dataset . . . 94
4.8 Descriptive statistics of the traffic conditions just before an accident split by accident type. . . 96
4.9 Percentages of the geometrical features of the segments upstream accidents split by accident type. . . 97
4.10 Definition of variables of the condition-based dataset . . . 99
5.1 Parameter estimates for the link-based univariate Poisson-lognormal model for all accidents (Link-based All (12)) . . . 105 5.2 Parameter estimates for the link-based multivariate Poisson-lognormal model
for fatal and serious (KS) and slight (Sl) accidents (Link-based KS-Sl AMF (3)) . . . 109 5.3 Combined Covariance-Correlation matrix of the (A) random effect and (B)
the spatial effect of the Link-based KS-Sl AMF (3) model. . . 109 5.4 Parameter estimates for the link-based multivariate Poisson-lognormal model
for single-vehicle (SV) and multiple-vehicle (MV) accidents (Link-based SV-MV (3)) . . . 112 5.5 Combined Covariance-Correlation matrix of the (A)random effect and (B)
the spatial effect of the Link-based SV-MV (3) model. . . 112 5.6 Parameter estimates for the link-based multivariate Poisson-lognormal model
for Fatal and serious (SV KS) and slight single-vehicle (SV Sl) accidents (Link-based SV KS-Sl (9)) . . . 115 5.7 Combined Covariance-Correlation matrix of the (A)random effect and (B)
the spatial effect of the Link-based SV KS-Sl (9) model. . . 116 5.8 Parameter estimates for the link-based multivariate Poisson-lognormal model
for fatal or serious (MV KS) and slight (MV Sl) multiple-vehicle accidents (Link-based MV KS-Sl (3)) . . . 118 5.9 Combined Covariance-Correlation matrix of the (A)random effect and (B)
the spatial effect of the Link-based MV KS-Sl (3) model. . . 119 5.10 Parameter estimates for the condition-based univariate Poisson-lognormal
model for all accidents (Condition-based All (10)) . . . 121 5.11 Parameter estimates for the condition-based multivariate Poisson-lognormal
model for fatal and serious (KS) and slight (Sl) accidents (Condition-based KS-Sl AMF (20)) . . . 125 5.12 Combined Covariance-Correlation matrix of the random effect of the
Condition-based KS-Sl AMF (20) model. . . 126 5.13 Parameter estimates for the condition-based multivariate Poisson-lognormal
model for single-vehicle (SV) and multiple-vehicle (MV) accidents ( Condition-based SV-MV (10)) . . . 129
5.14 Combined Covariance-Correlation matrix of the random effect of the Condition-based SV-MV (10) model. . . 130 5.15 Parameter estimates for the condition-based multivariate Poisson-lognormal
model for fatal and serious (SV KS) and slight (SV Sl) single-vehicle acci-dents (Condition-based SV KS-Sl (9)) . . . 132 5.16 Combined Covariance-Correlation matrix of the random effect of the
Condition-based SV KS-Sl (9) model. . . 133 5.17 Parameter estimates for the condition-based multivariate Poisson-lognormal
model for fatal and serious (SV KS) and slight (SV Sl) motorway single-vehicle accidents (Condition-based SV KS-SL moto (3)) . . . 134 5.18 Combined Covariance-Correlation matrix of the random effect of the
Condition-based SV KS-SL moto (3) model. . . 134 5.19 Parameter estimates for the condition-based multivariate Poisson-lognormal
model for fatal and serious (MV KS) and slight (MV Sl) multiple-vehicle accidents (Condition-based MV KS-Sl (18)) . . . 138 5.20 Combined Covariance-Correlation matrix of the random effect of the
Condition-based MV KS-Sl (18) model. . . 138 5.21 Parameter estimates for the condition-based multivariate Poisson-lognormal
model for fatal and serious (MV KS) and slight (MV Sl) motorway multiple-vehicle accidents (Condition-based MV KS-SL moto (12)) . . . 140 5.22 Combined Covariance-Correlation matrix of the random effect of the
Condition-based MV KS-SL moto (12) model. . . 140 5.23 Qualitative relationships of the traffic variables (speed and volume) with
accidents according to the outcomes of the link-based and the condition-based aggregation approaches. . . 143 5.24 Qualitative relationships of the geometric variables (curvature, gradient
and lanes) with accidents according to the outcomes of the link-based and the condition-based aggregation approaches. . . 143 5.25 Parameter estimates for the link-based multivariate Poisson-lognormal model
for fatal and serious (KS) and slight (Sl) accidents- accident locations iden-tified with the AMM1 (closest section) method (Link-based KS-Sl AMM1 (3)) . . . 146
5.26 Combined Covariance-Correlation matrix of the random effect of the Link-based KS-Sl AMM1 (3) model. . . 147 5.27 Parameter estimates for the condition-based multivariate Poisson-lognormal
model for fatal and serious (KS) and slight (Sl) accidents- accident loca-tions identified with the AMM1 (closest section) method (Condition-based KS-Sl AMM1 (20)) . . . 148 5.28 Combined Covariance-Correlation matrix of the random effect of the
Condition-based KS-Sl AMM1 (20) model. . . 149
6.1 Elasticity of speed and the minimum (mean speed increases by 2.5 mph) and maximum (mean speed increases by 5 mph) expected increase of mo-torway accidents by type. . . 155 B.1 Parameter estimates for the link-based multivariate Poisson-lognormal model
for fatal (K), serious (S) and slight (Sl) accidents (Link-based K-S-Sl (7)) 196 B.2 Combined Covariance-Correlation matrix of the random effect of the
Link-based K-S-Sl (7) model. . . 197 B.3 Parameter estimates for the condition-based multivariate Poisson-lognormal
model for fatal (K), serious (S) and slight (Sl) accidents (Condition-based K-S-Sl (10)) . . . 198 B.4 Combined Covariance-Correlation matrix of the random effect of the
Chapter 1
Introduction
1.1
Background
Road transport infrastructure is an important growth and productivity indicator for na-tional economies (Maˇciulis et al., 2009). Despite the undoubtable benefits to society, road transport systems have also negative social and economic impact. Traffic congestion, pollution (i.e. emissions and noise) and accidents are defined as the main externalities of road transport systems (Maddison et al., 1996). Relative comparisons between these three problems are not particularly meaningful as all of them have different and severe impact on road transport systems. Congestion mainly affects road networks’ operation, causing disruption and delays, pollution is linked with environmental changes that have adverse consequences on human health and traffic accidents, which are the focus of this thesis, have impact on the physical integrity of road users and the networks’ operation.
Accidents are defined as unwanted or unintended sudden events or a specific chain of such events which have harmful consequences (ITF et al., 2009). They cause serious traf-fic delays, congestion and property damage but more importantly they are linked with road traffic injuries that remain an unsolved global public health problem (WHO, 2013). The multiple problems that are linked with accidents and their inherent complexity make them one of the most challenging problems that policy makers and other stakeholders have to address.
had at least one killed or seriously injured casualty (Department for Transport, 2015b). A significant proportion of these accidents occurred on the motorway network. More specifically, although the length of motorways is only 1% of the total road network of the country, motorways account for almost 5% of accidents on the entire UK road network (Department for Transport, 2015b,c). This is certainly related with the fact that motor-ways carry approximately 21% of the total road traffic but it might be also due to the presence of potential accident triggering factors such as speed.
There is an endless list of potential accident contributory factors that are related either to the road environment or the users. Traffic conditions, road configuration, weather, driver demographic characteristics are only a few of the factors that are believed to be linked with accidents. The relationships between these factors and accidents are examined from different perspectives (e.g. behaviour, external conditions, infrastructure) especially since the middle of the 20th century; however, the complexity and individuality of road
acci-dents make the explanation of these phenomena ambiguous.
Speed, along with alcohol consumption and failure to use a seatbelt, are the top three factors related with 65% of fatal accidents in the UK (Clarke et al., 2010). Speed has been reported to be a contributory factor for 36% of fatal and 14% of all accidents in the UK during 2013 (Department for Transport, 2014). Driving with excessive speed is a poten-tial contributory factor that is particularly interesting for high-speed road environments such as motorways. The percentage of fatal accidents on high speed environments is more than double than the corresponding percentage on roads with lower average speeds (Keep, 2013). This fact implies that a causal relationship between serious accidents and speed might exist. To control the negative impact of speeding, traffic authorities set and enforce speed limits on motorways and other main roads. The national motorway speed limit in the UK is 70 mph for all types of vehicles except for goods vehicles with laden weight over 7.5 tonnes and cars that tow caravans or trailers that should not exceed 60 mph (Department for Transport, 2007).
1.2
Problem Statement
Speed limits should not be considered as the target speed, however a great proportion of motorway drivers in the UK systematically exceed the speed limits; in 2014 46% of cars violated the 70 mph speed limit, leading to an annual average speed and an 85th percentile as high as 68 mph and 77 mph respectively (Department for Transport, 2015a). One could argue that these figures indicate the necessity of an update to the current speed limit that was firstly set in 1966. It is a fact that many factors related to road safety have been changed over time. For instance, vehicle technology, vehicle-based active and passive safety systems, driver training and education, emergency responses and medical services have been significantly improved. Based on the above and arguing that safety cannot be the only consideration when setting speed limits the Department for Transport expressed their intention to increase motorway speed limits from 70mph to 80 mph in 2011 (Department for Transport, 2011a). The reason behind this idea was that a speed limit increase could lead to reduced travel times and less congestion that can be translated to economic benefits for the region.
As expected, this announcement raised questions concerning the possible negative conse-quences that a regulation like this could bring to the number of traffic accidents on the UK motorways. To assess whether such an increase in the speed limit is sensible it is necessary to estimate its future effect on road safety. The relationship between speed and accidents is the key to quantify the impact of speed limit changes. Increases in speed limit are related with average speed raises (Freedman and Williams, 1992) that could potentially cause more accidents on the network. Previous studies on the impact of speed limit changes primarily concluded that the changes in accident frequency and severity are proportional to the speed limit alterations (e.g. Elvik, 2009). Nevertheless, the individual examination of the relationship of speed with accidents provides less clear results. Speed-ing is confirmed to be related with higher accident severity but it is not clear whether this is true for accident frequency (e.g. Aarts and Van Schagen, 2006; Kockelman and Ma, 2007; Quddus, 2013). The lack of a generalised conclusion and the absence of British studies on the impact of speed limit increases show that the relationship of speed with accidents should be further explored.
The dissimilar findings of existing research on the relationship of accident frequency with speed may be due to various methodological limitations of accident analyses that reduce the accuracy of representation of the actual circumstances that are related with, and probably caused, accidents. In conventional accident analyses accidents are typically ag-gregated using spatial criteria such as road links. Link-based analyses use variables that are by default highly aggregated as they represent the conditions on an entire link with one characteristic value (e.g. time-varying measures are usually represented by annual averages). In this way it is likely that the spatial and temporal variations within the link are not captured, making the representation of the pre-accident conditions practically impossible. Moreover, analysing all accident types together may reduce the capability of models to reveal the actual accident contributory factors as those are found to vary between different accident generation processes (Geedipally and Lord, 2010).
The speed limit increase that was proposed by the Department for Transport after the replacement of the Secretary of State for Transport (former Secretary Philip Hammond was replaced by Patrick McLoughlin) did not continue to be a priority and did not reach the implementation stage (Chorley, 2013). Nevertheless, the relationship of speed and traffic accidents is still an interesting and relatively unexplored subject for the motor-way network of England. This thesis examines speed-accident relationships on the UK motorway attempting to overcome the current methodological limitations. This includes the exploration of alternative accident data aggregation approaches that will enable the accurate representation of the pre-accident traffic conditions in statistical models and the evaluation of the effects of speed and other contributory factors on different accident types. The results intend to increase the understanding of accident occurrences and the methods for analysing them.
1.3
Research Importance
Although over the last decades accidents have a decreasing trend especially in the Western world, their number is still unacceptably high (WHO, 2013). In addition to the devas-tating personal losses, the annual loss to society due to accidents in the UK is estimated
to be £15 billion (the value for preventing a fatal accident is approximately £2 million) (Department for Transport, 2012b). As a consequence, mitigation of traffic accidents re-mains one of the top priorities of traffic management agencies in the UK and all over the world (e.g. Whitelegg and Haq, 2006). To decrease the number of accidents effectively by introducing new policies or technologies, it is necessary to firstly understand the mecha-nisms that lead to these events. Road safety research aims to reveal causal relationships and contributory factors of accidents so as to develop targeted preventive measures in the future.
The majority of accidents are related with combinations of human error with defects of the road environment (e.g. Wagenaar et al., 1990). While controlling drivers’ errors is not always possible, designing and managing roads in a manner that hazardous situations are avoided is more feasible. Developing road infrastructure of high safety standards is one straightforward way for securing effective accident mitigation. Accident modelling is a key method for achieving this as it provides information on the relationships of road characteristics with accidents. This research project is meaningful because it provides qualitative results on the relationships of several contributory factors with accidents and also provides new methodological insight on accident modelling.
1.4
Aim and Objectives
This thesis aims to examine the relationship between motorway accidents and speed. This will be accomplished through the following objectives:
• To review the impact of speed and other contributory factors on accidents
• To examine existing statistical approaches in accident modelling
• To refine and merge data from multiple sources so as to enhance the quality of the analysis
• To develop accident-speed relationships using a new condition-based modelling ap-proach
• To compare and contrast the results between the conventional and the condition-based modelling approach
• To evaluate the impact of a potential speed limit increase on accidents
1.5
Thesis Outline
This thesis consists of seven chapters. An outline of the chapters is provided below:
• Chapter 2 conducts an extensive literature review on the relationship of accidents with traffic and geometric contributory factors, the main statistical approaches in accident analyses and the existing accident location refinement methods;
• Chapter 3 presents the methodology of this thesis. The chapter starts with the description of an accident mapping algorithm that is applied to the accident data. Following are the two accident aggregation methods that are examined and the statistical models that are employed. The final section of this chapter explains the modelling strategy that was followed in this work;
• Chapter 4 illustrates the accident, traffic and geometric data and the outcomes of the data pre-processing methods that are used before proceeding to the main analysis;
• Chapter 5 shows and explains the results of the statistical models that are developed. The chapter also discusses methodological implications for accident analyses that were derived from the modelling outcomes;
• Chapter 6 provides estimations on the impact of a potential speed limit increase and provides policy recommendations for mitigation of traffic accidents;
• Chapter 7 summarises this research project and outlines its contributions to knowl-edge and limitations. Finally, some thoughts for future research directions are pro-vided.
Chapter 2
Literature Review of Findings and
Methods of Accident Analyses
2.1
Motivation
Accidents impose social and personal costs on drivers, passengers and generally the road network users. Traffic managers and local authorities for at least the last century are working on decreasing the number of road accidents with an emphasis on accidents with casualties (Norton, 2015). Prevention relies on the in-depth understanding of the factors and the mechanisms related with accidents. There are numerous factors associated with driving attitudes, traffic or external conditions (e.g. alcohol consumption, traffic conges-tion, adverse weather) and often combinations of such factors that may lead to accidents (Brown, 1982; Montella, 2011). The first systematic accident analyses emerged approx-imately seven decades ago and since then there have been constant significant advances on our understanding of accident causation (Hagenzieker et al., 2014). The randomness and the complexity that characterises road accidents though have not yet permitted a full explanation of these phenomena.
In order to develop an appropriate methodology for this research it is necessary to under-stand the existing knowledge and to identify the methodological limitations of previous accident analyses. The focus of this literature review is the main outcomes and the quan-titative approaches that have been employed in accident modelling. The first part of this chapter outlines the findings of previous research on the relationships of accidents with
speed, traffic volume and road geometric features that are the contributory factors that will be examined in this thesis. Following that, there is a discussion on the main statistical approaches that have been used in accident analyses and their strengths and limitations. The final section of this review outlines the significance of reported accident locations in accident analyses and the existing accident mapping techniques.
2.2
Speed and Accidents
Speed is related with a large proportion of traffic accidents (Aarts and Van Schagen, 2006; Clarke et al., 2010). This is explainable considering that speed is a potential ac-cident contributory factor that is always present on the network in contrast to many others that have random (e.g. rainfall) or periodic character (e.g. darkness) (Elvik et al., 2004). As drivers do not always succeed in choosing appropriate speeds, speed regulation measures such as speed limits are necessary because they offer some guidance for correct speed choices (Elvik, 2010). Speed limits can therefore indirectly represent the typical traffic conditions on the roadway. Accepting that an accident-speed relationship exists, speed limit changes are expected to have impact on the safety levels of a road network. Network-level accident-speed relationships have been examined either by estimating the impact of speed limit changes or by developing statistical models that explain the number of accidents as a function of speed as a traffic variable.
High speeds are proven to increase the severity of accidents and there are also indica-tions that they have a negative impact on accident frequency. Although the number of studies that attempted to quantify the accident-speed relationship is significant, the high complexity of accidents and some methodological restrictions have not permitted the gen-eration of a relationship with general acceptance and application. The findings of the most significant studies on this topic are presented in the sections below.
2.2.1
Speed limits and accidents
2.2.1.1 Speed limit increasesThe aim of setting speed limits is to maintain the equilibrium between road safety, traffic flow and energy consumption in road networks (TRB, 1998; Department for Transport, 2006). A speed limit does not necessarily represent a speed that is safe at all conditions and is definitely not a target speed. Except for denoting what is legal, properly set speed limits reflect the range of speeds that are considered sensible for a specific road environ-ment according to its characteristics (Departenviron-ment for Transport, 2006).
Setting speed limits requires a thorough data collection and analysis of various factors related with the road environment. The most common factors that are taken into con-sideration are the design speed, the 85th percentile, the mean speed, the road function,
previous accident and enforcement experience, roadway geometry and the impressions a road gives to its users (TRB, 1998). The existence of appropriately set speed limits though does not ensure the keeping of speeds at safe levels; violating the speed limit is one of the most common road traffic law offences (Department for Transport, 2015a). As a consequence, speed limit enforcement is particularly important for effective speed regulation (Wilson et al., 2006). Among the numerous different methods for enforcing speed, speed cameras and speed guns are considered to be some of the most efficient. For instance, average speed drop and accident mitigation have been reported at roadway locations that are equipped with speed cameras (e.g. Mountain et al., 2005; Soole et al., 2013; Li et al., 2013).
In some cases, road management authorities decide to use special types of speed lim-its when it is believed that they will suit better the roads’ characteristics and needs. As an example, some roadway sections have variable speed limits that adapt to the external conditions (e.g. weather, traffic) or differential speed limits that apply for some specific types of vehicles such as trucks (TRB, 1998). Since 2005, variable speed limits are imple-mented on some sections of the Strategic Road Network of England forming the so-called smart motorway network that is continuously expanding (Highways England, 2014). The smart motorway is a dynamic response to the continuously increased traffic demand that is also cost-effective compared to an expansion of the existing network (Highways Agency,
2010). For that purpose, except for using hard shoulders as lanes variable, mandatory and highly enforced speed limits are used. Variable speed limits are set in order to corre-spond efficiently to the traffic and environmental conditions on the motorway (Highways Agency, 2006; Department for Transport, 2012a).
Speed limits are measures that generally have long-term or even permanent character. Traffic authorities usually decide to change a speed limit only if they consider it as nec-essary for promoting safety or relaxing congestion. The distribution of speeds on the roadway is typically a function of the posted speed limit. As a consequence speed limit changes will lead to changes in the average driving speeds. Research has shown that these changes are proportional but comparatively moderate and that is possibly because new speed limits reflect better the current speed choices of the users (Rock, 1995). More specifically, the average speed change equals approximately to one quarter to half of the speed limit difference (e.g. Freedman and Williams, 1992; Finch et al., 1994; Baruya, 1998b; Aljanahi et al., 1999; Ossiander and Cummings, 2002; Elvik et al., 2004; Vadeby and Forsman, 2010; De Pauw et al., 2014). Assuming that speed is related with accidents, a speed limit change, if all other factors remain unchanged, should have an impact on the number of accidents on a road network and probably on the adjacent roads too (i.e. spill-over effect) (e.g. Garber and Grahman, 1990; Wagenaar et al., 1990). According to a meta-analysis by Elvik et al. (2004) 70.5% (weighted percentage) of the before-after included studies found a proportional change in accidents after a speed limit alteration.
There are quite a few examples from countries all over the world where the speed limits were changed (increased or decreased) and the differences in road accidents shed more light on the effect of speed limits on road safety. To be in line with the aim of this thesis, this review will focus on studies that examined the impact of increased speed limits on accidents.
There are a considerable number of before and after studies that are focused on speed limit changes in the United States. Almost a decade after the general speed limit reduc-tion (to 55 mph) due to the petrol crisis, the US government in 1987 gave the permission to the States that they wished to, to increase their speed limits up to 65 mph.
Fol-lowing this, in 1995 the responsibility of setting speed limits completely returned to the States and from that point until today each State selects its own speed limit (TRB, 1998).
After the 10-mph increase of speed limits (from 55 to 65 mph), in 40 of the States in 1988; most of the state and national studies report a general trend of increased fatal ac-cidents and fatalities (TRB, 1998; Houston, 1999). In their before and after study Brown et al. (1990) found that in the State of Alabama a year after the speed limit increase, 19% more accidents were reported on rural interstates. Wagenaar et al. (1990) apply-ing an ARIMA time series model estimated that there was a 19% increase in fatalities and a 25-40% increase in injuries in rural interstates of Michigan. They suggested that the frequency of fatalities also rose in limited access freeways that did not experience a speed limit change, as a side effect of higher driving speeds in neighbouring roads, the so-called spill-over effect. Using ARIMA models Rock (1995) also suggested the existence of spill-over effects due to increased speed variance in the State of Illinois in addition to a substantial monthly increase of accidents on rural inter-states (345 more accidents and 15 more fatalities).
Baum et al. (1991) examined the impact of the speed limit rise in 40 states using as a reference eight states where the speed limit was unchanged for their before and after analysis. Controlling for the increased vehicle miles travelled and vehicle occupancy, they found a 29% increase in fatalities of rural interstates of the states that adopted higher speed limits (Baum et al., 1991). On the other hand, the eight states that did not apply the measure had a 12% reduction in fatalities that according to the confidence interval of the odds ratio that was used for the estimation was not found to be statistically sig-nificant. However, when accidents were examined disaggregated by state, the impact of speed limit increases was not uniform. Although the median of fatal accidents increased by approximately 15%, Garber and Grahman (1990) found that only 28 out of the 40 states experienced more fatal accidents. Chang et al. (1993) suggested that the increase was more significant in the comparatively smaller states noting the existence of several unobserved exogenous factors that contribute to these changes.
Lave and Elias (1994) opposed the view that speed limit increases have a negative im-pact on road safety. Setting as their dependent variable state-wide instead of interstate fatalities, they estimated a 3.4% to 5.1% decline. They explained that this might was the effect of traffic diversion (i.e. faster drivers tended to avoid non-interstates), more efficient distribution of resources for road safety by the authorities and speed variations decrease despite the fact that such data were not available to them to confirm these explanations.
The effect of the speed limit relaxation in several main roads in Hong Kong was neg-ative for accidents of all severities. The impact on fatal and serious accidents though was considerably more significant when the speed limit increased from 70 to 80 km/h (∼
43.50 to 49.71 mph) (fatal and serious accidents increased by 18%) than from 50 to 70 km/h (∼31.07 to 43.50 mph) (fatal and serious accidents increased by 1%)(Wong et al., 2005). The European examples of speed limit increases in rural highways and motorways have also shown with some consistency that the impact of this measure is rather negative for road safety (OECD/ECMT, 2006). A 10km/h (∼ 6.2 mph) speed limit increase lead to 13% more fatalities in Hungary and in considerably more personal injury accidents in Sweden and Denmark (OECD/ECMT, 2006; Hels, 2012; Vadeby, 2015). The impact on speed limits increase on Greek motorways varied based on their geometric and traffic characteristics. More specifically, motorways with lower geometric standards had more fatal accidents, but this was not true for motorways with better geometrical features and relatively lower traffic (Yiannis et al., 2015) .
2.2.1.2 Meta-analyses
Regardless of their results, the common feature of the above studies is that they examine local effects of speed limit changes having available accident data before and after the period of the measure implementation. In order to take strategic policy decisions though, it is useful to know in advance the potential impact of a speed limit increase. There have been several attempts in the literature to define general rules for the impact of speed limit changes; most of them are based on the combination of the outcomes of previous studies (i.e. meta-analyses).
The effect of changing speeds after the implementation of traffic measures on road safety was examined in-depth in the meta-analysis conducted by Elvik et al. (2004). The study primarily aimed to identify a generic relationship that could estimate the manner in which speed changes influence the number and severity of traffic accidents and additionally to test to what extent the Power Model (Nilsson, 2004) describes this relationship. Nils-son (2004) introduced the Power Model as a group of six power functions (see equations 2.1-2.6) that estimate the expected number of accidents or casualties by accident severity after a certain change in mean speeds on a road network assuming that the number of occurrences and casualties is always proportional to speed. Although the power functions are obviously quite simplistic to provide very accurate results, Nilsson (2004) supported that they are applicable for all network environments.
Fatal Accidents: y1 = v1 v0 4 y0 (2.1) Fatalities: z1 = v1 v0 4 y0+ v1 v0 8 (z0−y0) (2.2)
Fatal and Serious Accidents: y1 =
v1
v0
3
y0 (2.3)
Fatal and Seriously Injured Casualties: z1 =
v1 v0 3 y0+ v1 v0 6 (z0−y0) (2.4) All Accidents: y1 = v1 v0 2 y0 (2.5) All Casualties: z1 = v1 v0 2 y0+ v1 v0 4 (z0−y0) (2.6) Where:
v0 and v1: the mean speed before and after the change respectively
z0 and z1: the casualties before and after the change respectively.
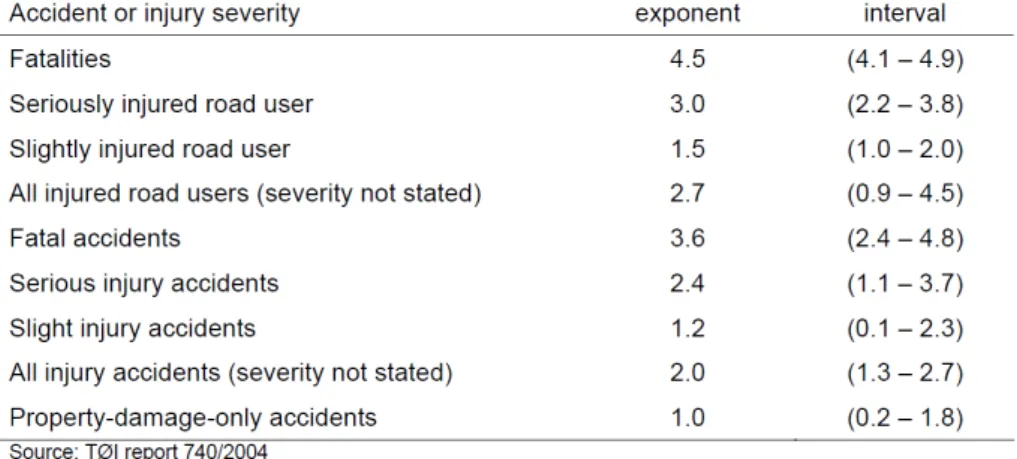
For their meta-analysis Elvik et al. (2004) identified 98 valid projects from all over the world conducted between 1960 and 2004. The topic of these studies was mainly about the consequences due to mean speed changes that have occurred due to a new road safety measure. As a part of their exploratory analysis Elvik et al. (2004), after standardising the explanatory power of the studies, found that average speeds were decreased 95% af-ter a speed limit reduction and this was consistent with the Power model, which means that accident number and speed changed proportionally. The respective figure for the estimates of increasing mean speeds was 70.5%. Applying a meta-regression analysis they estimated new exponents applicable for equations 2.1-2.6 that are summarised in Table 2.1. The authors appeared to be confident about the results of their meta-analyses suggesting that the existing limitations such as study inclusion biases, omission of other factors are unlikely to have drastically affected the outcomes.
Figure 2.1: Best estimates of exponents for different accident or injury severity groups (source: Elvik et al., 2004)
Nevertheless, the Power Model has a drawback that is unavoidably reflected on its re-sults. The use of power functions is straightforward and transferable but the exponents provided are independent of the baseline speed and that might lead to inaccurate estima-tions (Hauer and Bonneson, 2006). As an example, the estimated proportional changes
on the frequency of accidents are equal when mean speed increases from 30mph to 33mph and from 60mph to 66mph, because in both the cases there is a 10% increase of speeds. Hauer and Bonneson (2006) using the data from the meta-analysis by Elvik et al. (2004) proved the dependence of accident frequency on the baseline speed and examined whether other factors apart from mean speeds should be taken into consideration. Hauer and Bon-neson (2006) and Hauer (2009) also developed new exponential prediction models that incorporated manoeuvre time and distance for collision avoidance.
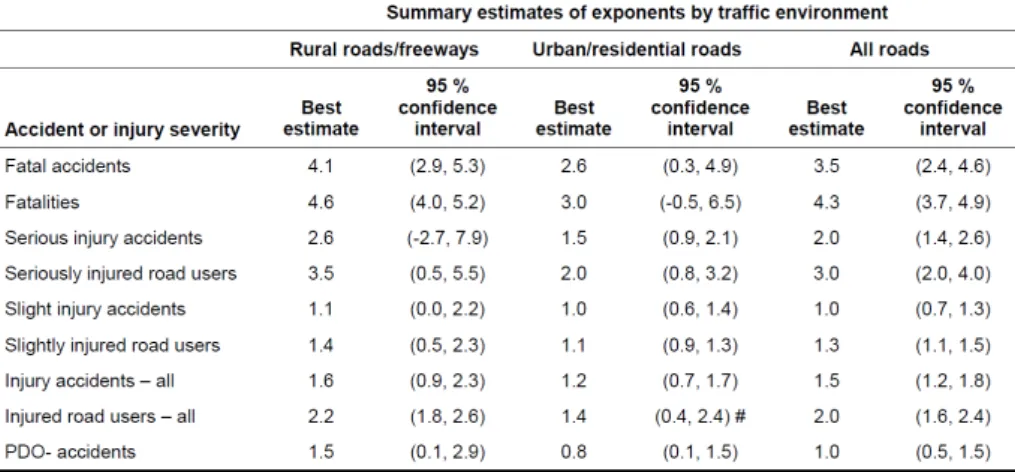
Elvik (2009) suggested that the power model is simpler than the exponential and modified the power model in a way that the initial speeds were indirectly taken into consideration. Using an updated and richer dataset he estimated two different sets of exponents for high and low speeds that can be seen in Table 2.2. Although this approach provides improved results, the baseline speeds are still not taken into account and that is why Elvik (2013) re-parametrised these exponents in order to compare it with the exponential model. The exponential model had slightly better fit for injury and PDO accidents but for accidents with fatalities the power model fitted better. Elvik (2013) concluded that the analysis supports exponential models as they are more suitable for modelling the impact of speed changes on road safety. Despite that, Elvik’s (2009) approach due to its simplicity is used as a point of reference by many transportation agencies in the world (e.g. Hels, 2012; Vadeby, 2015).
Figure 2.2: Best estimates of exponents for different accident or injury severity groups by road type (source: Elvik, 2009)
2.2.2
Speed and speed variance
Meta-analyses’ results are useful for identifying general data patterns, but are not accurate enough for predicting the effect of a speed limit increase on a particular road network as they cannot take into account the area-specific characteristics (geographic, cultural etc.) that may differentiate the outcomes. Consequently, to predict the impact of a potential speed limit increase on a road network it is necessary to define its accident-speed rela-tionship. As has already been discussed, the majority of the before and after studies report proportional changes in accident frequency following speed limit alterations (e.g. Elvik et al., 2004; Aarts and Van Schagen, 2006). This effect is always attributed to the increase of average speeds on the roadway; however, the individual examination of the relationship of speed with accidents does not always support this idea.
Based on the amount of the kinetic energy that is released during a collision (EKinetic = mV2
2 ), accidents that occur under high speed conditions are definitely more likely to lead
to more serious outcomes (e.g. Joksch, 1993; Kloeden et al., 1997; Aarts and Van Scha-gen, 2006; Pei et al., 2012). High travel speeds are also associated with many accident triggering factors such as lower reaction times, longer decisions, breaking and stopping distances, reduction of manoeuvrability and increased possibilities of manipulation error, loss of control and exceeding the critical speed on a curve (Solomon, 1964; Godwin, 1984; Hale, 1990; Fildes and Lee, 1993; Patterson et al., 2000; Navon, 2003; Aarts and Van Schagen, 2006). On the other hand, higher speeds are also related with more uniform distribution of speeds (i.e. lower speed variance) that is considered to be beneficial for road safety (Lave, 1985; Graves et al., 1993; Navon, 2003).
There is a considerable amount of research on the accident-speed relationship but several points of disagreement between studies. Most of the studies found driving speeds to be linearly or exponentially related to accidents (e.g. Fildes et al., 1991; Baruya and Finch, 1994; Kloeden et al., 1997; Quimbly et al., 1999; Taylor et al., 2000; Kloeden et al., 2002). A few studies contradicted the common belief though, proposing that speed is inversely proportional with accidents (e.g. Baruya, 1998a; Stuster, 2004) and others reported sta-tistically insignificant relationships (Lave, 1985; Garber and Gadiraju, 1989). Some of the most recent papers that explored the impact of speed on accidents using advanced
statistical modelling did not find a statistically significant relationship between speed and accidents (e.g. Garber and Ehrhart, 2000; Kockelman and Ma, 2007; Quddus, 2013). Pei et al. (2012) attempted to explain the results’ inconsistencies suggesting that the esti-mated accident-speed relationship by models strongly depends on the selected measure of exposure; the relationship was shown to be negative for distance-based exposure (i.e. vehicle miles travelled) but positive for time-based exposure (i.e. vehicle hours travelled). The inconsistent results between research papers in fact might be related with a variety of methodological and data limitations that do not permit the accurate evaluation of the speed-accident relationship. This will be further discussed in section 2.4.
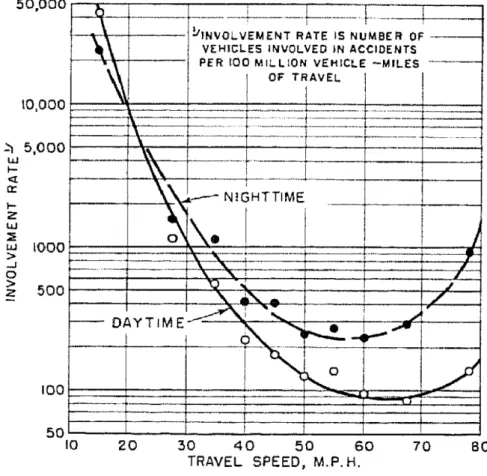
The work of Solomon (1964) on the relationship of speed and accidents is one of the widely cited, replicated and criticised studies; maybe more than any other relevant study. This is because one of its main outcomes was that speed dispersion and not speed is related with accident frequency; contrasting what was believed so far and the findings of many subsequent studies. Speed dispersion (or speed variance) is defined as speed differ-ences between or within lanes between individual vehicles or in a road section level (Aarts and Van Schagen, 2006). Speed differences lead to more vehicle passes that are related with more accident prone interactions (Lave, 1985; Navon, 2003) In his case-control study Solomon (1964) employed 10,000 accident reports that included information on the speed before the accident (based on police officers’ estimations and a combination of other rel-evant data in accident reports). The control data included spot speed observations for 290,000 drivers that were measured with concealed, speed measuring devices. Solomon (1964) comparing the two speed distributions that stemmed from the case and the compar-ison groups (defining an accident involvement rate) observed that that accident-involved drivers were travelling at speeds that deviated from the average speed and more specif-ically were considerably lower than it. Accident involvement rates were calculated by dividing the number of accident-involved drivers by the respective vehicle-miles of travel and it was plotted against speed forming a U-shaped curve (see Figure 2.3) that according to Solomon (1964) represents the chance of a driver being involved in an accident as a function of their speed. It can be noticed that the involvement rate reaches a peak at very low speeds (15 mph) and its lowest value is for a speed approximately 5 mph above the average speed that was 50 mph. From that point and onwards, involvement rate increases
constantly. As a consequence, Solomon (1964) suggested that the greater the variation (positive or negative) from the average in a vehicle’s speed, the more likely it is for this vehicle to be involved in a road accident or differently put, relatively high driving speed is safer than either low or excessively high speed driving. His finding for accident severity was different and consistent with literature, as he suggested that accident severity and speed are directly proportional.
Figure 2.3: Accident involvement rate as a function of driving speeds for day (solid line) and night (dashed line) (source: Solomon, 1964).
Solomon’s (1964) work was followed by some similar studies, in terms of methodology and results, that supported the existence of a U-shaped curve between the chance of ac-cident involvement and speed (Cirillo, 1968; Munden, 1967; RTI, 1970). The validity of this result however is questionable if the limitations of these studies are considered. The inclusion of vehicles whose speed was not chosen such as turning vehicles and vehicles in congested conditions (46% of the sample) is one factor that could distort the results of these studies (Hauer, 1971; Frith and Patterson, 2001; RTI, 1970). Also, the use of the
ratio of distributions of data that originate from dissimilar in terms of accuracy measure-ment methods (i.e. vehicle speeds before the accidents and driving speeds) by default leads to a U-shaped curve even if the two distributions were equal (Hauer, 2009).
Speed variance has been examined as a potential contributory factor several times and with different approaches ever since. One of the main challenges is the quantification of speed variance (Wang et al., 2013); speed differences cannot be directly measured like other traffic variables (e.g. volume, mean speed) so the researchers employed several dif-ferent surrogate measures. For instance, Lave (1985) used the difference of the mean speed and the 85th percentile of the speed distribution and estimated a positive relationship
be-tween speed variations and accidents. This finding agrees with the majority of studies where speed variance was defined as the standard deviation of speed (Baruya and Finch, 1994; Baruya, 1998a; Taylor et al., 2000; Quddus, 2013). Pei et al. (2012) however reported that there is not a statistically significant relationship between the standard deviation of speed and accidents. This is consistent with the findings of Kockelman and Ma (2007) who used more complex expressions for defining separately speed variance between and across lanes aiming to reflect disaggregate estimates of instant variation. All these results should be seen with some caution though as they probably reflect default mathematical properties of the data rather than actual causal relationships between speed variance and accident frequency (Davis, 2002). In fact, the mechanism of the impact of speed vari-ance cannot be explicitly explained until individual vehicle-level second-by-second data are available (Kockelman and Ma, 2007).
2.3
Other Explanatory Variables
Speed is not an independent traffic characteristic; vehicles’ speed is usually a function of the surrounding traffic conditions and infrastructure features. Therefore the relationship of speed with accidents cannot be defined without controlling for the simultaneous effect of other road characteristics (Aarts and Van Schagen, 2006). Various traffic characteris-tics have been examined and found that they have significant impact in traffic accidents such as traffic flow, traffic density, vehicle-capacity ratio and others. The effects of road
geometry (e.g. curvature, gradient) and construction quality (e.g. pavement conditions) on road safety have also been widely studied in the literature. The relationship of traffic volume, horizontal and vertical alignment and the number of lanes will be mainly dis-cussed here as these are variables that are included in the available datasets.
2.3.1
Traffic characteristics and accidents
Traffic flow is considered to be one of the most important accident precursors in the lit-erature. Naturally, the number of vehicles on the roadway is directly proportional with the number of vehicle interactions that can potentially lead to collisions (Navon, 2003). Most studies represent traffic flow with the Annual Average Daily Traffic (i.e. AADT) or Average Daily Traffic (i.e. ADT) mainly because these variables are normally available in traffic datasets. AADT has been found by a large number of researchers to have a proportional relationship with accident frequency (e.g. Miaou and Lum, 1993; Milton and Mannering, 1998; Abdel-Aty and Radwan, 2000; Chang, 2005; Anastasopoulos and Man-nering, 2009), that in other words means that the busier a road is, the more accidents are expected to occur on it. In addition, studies that examined Levels of Service (LOS) as a surrogate measure for traffic conditions and density, confirmed that accident frequency is the highest for the lowest LOS and vice versa (Frantzeskakis and Iordanis, 1987).
There are however some exceptions to these findings; the study of Garber and Ehrhart (2000) reports slight decreases in accident rates when the flow per lane increases for the range of 90 to 100 vehicles per hour per lane. Gwynn (1967) and Ceder (1982) also found that the relationship of traffic flow and accident rates form a U-shaped curve meaning that accident probability rises at very high or very low traffic conditions and it is at its lowest levels under moderate traffic. The form of a U-shaped curve also takes the relationship of the vehicle-capacity ratio (i.e. v/c ratio) that is also a measure that represents, probably with higher precision, the traffic flow conditions on the roadway (Zhou and Sisiopiku, 1997).
At first glance the statement that the traffic flow and accidents are proportional seems valid, but it has been proven to be too generic and not representative of all accident
types. There are studies that show that the effect of traffic volume has different impacts on different collision types. Specifically, single vehicle accidents have been found to be related to lower traffic flows while the number of multiple vehicle accidents increases at higher traffic volumes (Gwynn, 1967; Ceder, 1982; Martin, 2002; Qin et al., 2004; Lord et al., 2005; Kim et al., 2006; Ye et al., 2009; Bham et al., 2012). This finding can be the explanation for the U-shaped curves that were found to represent the relationship of accidents with traffic flow when all accidents are examined aggregated (Ceder, 1982; Martin, 2002). The left part of the U-curve might be related with single vehicle accidents that occur at low flow conditions and the right one refers to multiple vehicle accidents that are more likely to occur under more congested conditions.
Although at least for multiple vehicle collisions accident frequency and traffic flow have a positive relationship, more serious accidents tend to occur under lower flows and espe-cially at off-peak times (Martin, 2002). This is probably because lower flows are indirectly related with high speed and speed variance (as traffic builds up) that are also thought to be significant accident precursors (e.g. Garber and Ehrhart, 2000; Elvik et al., 2004). The fact that the latter two traffic characteristics are considered to trigger accident fre-quency complicates their examination along with traffic flow and the interpretation of the findings. Recent research on real-time accident prediction models suggests that acci-dents occur due to turbulences of the traffic flow under particular combinations of traffic conditions attempting to provide a more complete definition for the role of traffic flow in accidents (e.g. Abdel-Aty and Pande, 2005; Hossain and Muromachi, 2013).
2.3.2
Road geometry and accidents
The geometrical characteristics of a road are thought to be related with accident frequency and severity in various ways (AASHTO, 2010). Particular road configurations can con-tribute to restricted visibility (e.g. sharp curves), higher stopping distances (e.g. downhill sections) or even indirectly encourage inappropriate driving behaviour (e.g. speeding on long straight segments). The effect of the road design on accidents is a very popular subject in road safety research due to the increased interest from the road managing agencies and data availability. It is a fact that in some cases the results of the studies are
not always consistent. This is because of the variations in the land, construction, traffic and demographic characteristics (e.g. Haynes et al., 2007, 2008) that are difficult to be controlled and the differences in the statistical approaches and the surrogate measures that are used to represent geometry. The core literature findings for the relationship of curvature, gradient and number of lanes are presented here.
2.3.2.1 Curvature
One of the commonly accepted ideas about road geometrical characteristics is that sharp curves are related with higher accident rates (e.g. Miaou et al., 1992; Milton and Man-nering, 1998; Abdel-Aty and Radwan, 2000; Caliendo et al., 2007; Anastasopoulos and Mannering, 2009; Gitelman et al., 2014) and more severe injuries (Ma and Kockelman, 2006). Curves with small radiuses that often do not provide the necessary sight distance, are related with more driving errors and raise the lateral acceleration that can cause loss of vehicle control (Peters and Iagnemma, 2009). Chang (2005) however found that ac-cident likelihood reduces at sharper curves. His counterintuitive result was explained as the effect of more careful driving when the road configuration is more challenging.
Radius is an important but not the only determinant of hazardous horizontal alignment; the frequency of curves on a road segment has also been found to be related with the number of accidents. According to Milton and Mannering (1998) the higher the length of a straight section just before a curve, the higher is the accident frequency. That is because when drivers traverse long tangent segments they are less likely to expect curves and might enter the curve with inappropriate speed. Shankar et al. (1995) found that fewer curves per mile are related with more serious accidents. This explains to a certain extent the finding of Caliendo et al. (2007) who found that apart from sharp curves, very long straight segments are also hazard prone. Some area-wide studies proposed that areas with more curves experience overall less accidents (Haynes et al., 2007, 2008; Wang et al., 2009b; Li et al., 2015). Wang et al. (2009b) explained this outcome suggesting that in more curved configurations drivers tend to be more cautious and aware of the road. However, since the sharpness of the curves was not separately available in the data (curvature was expressed with bend density), it is not possible to determine whether that was the effect
of the number or the radius of the curves.
According to the findings outlined above, changes in the horizontal alignment should normally lead to some changes in the number of accidents and that has been confirmed from the study of Vogt and Bared (1998) who found that decreased curvature lead to less traffic accidents. In contrast, a panel-data analysis by Noland and Oh (2004) suggested there was not a significant effect on accidents related with area-wide changes neither in the sharpness nor in the number of curves.
2.3.2.2 Gradient
High vertical grades are associated with high accident frequency (Shankar et al., 1995; Milton and Mannering, 1998; Chang, 2005; Anastasopoulos and Mannering, 2009; Gitel-man et al., 2014). Milton and Mannering (1998) refer that the increase in accidents on upgrades is related to speed decreases, especially for heavy vehicles that might lead to more overtaking from faster cars. Downgrades, on the other hand, lead to higher vehicle speeds and therefore stopping distances. Yuan et al. (2008) suggest that not only the grade but also the length of downgrades is related with higher accident frequency.
Road geometrical characteristics do not act independent of one another. It has been sug-gested that the combination of poor horizontal and vertical curvature is mainly related with more traffic accidents (May, 1994; AASHTO, 2010). A recent simulation-based study has shown that the lateral acceleration (that was used as the proxy for accident proba-bility) is high on downhill curved segments as well as crests or sags that are combined with curves (Wang et al., 2015). Uphill segments are not related with increased lateral acceleration. This study provides a new insight on the impact of road geometry on safety but it examines the impact of only one risk factor related with geometrical combinations so its results cannot be considered as generic.
2.3.2.3 Number of lanes
The number of lanes is linked with lane changes and increased vehicle interactions that can be potentially dangerous. Kononov et al. (2008) defined the possible vehicle conflicts as a function of the number of lanes as follows:
Cn=n·(n−1) for n = 2 (2.7)
and
Cn=n·(n−1) +
n!
3!(n−3)! forn >2 (2.8)
whereCn: the number of possible conflicts and n: the number of lanes.
Most of the researchers who examined the influence of the number of road lanes on accidents have found that the number of lanes is proportional with accident frequency (Persaud, 1992; Milton and Mannering, 1998; Chang, 2005). Noland and Oh (2004) sug-gested that a higher number of lanes is increasing the fatality rates too. Milton and Mannering (1998) refer that the number of lanes as a variable might act as a proxy for separate road categories meaning that the estimated coefficients might additionally reflect the differences between roads rather than the number of lanes alone.
Ma and Kockelman (2006) estimated that the number of lanes is related with decreases in non-fatal accidents and that it has no effect on fatal accidents. The authors did not provide an explanation, but this result might imply that roads with more lanes are less congested and so they tend to have fewer accidents related with congested conditions, that are usually non-fatal. Park et al. (2010) suggested that the relationship of the number of lanes with accidents forms a U-shaped curve; 6-lane roads were found to be the least accident prone compared to 4 and 8-lane roads. The authors explained that roads with more lanes provide more space for accident avoidance manoeuvring.