Engagement-Aware Computing: Modelling User
Engagement from Mobile Contexts
Akhil Mathur
Nokia Bell Labs
Nokia Bell Labs and
Nicholas D. Lane
University College London
Fahim Kawsar
Nokia Bell Labs
ABSTRACT
In this paper, we examine the potential of using mobile context to model user engagement. Taking an experimental approach, we systematically explore the dynamics of user engagement with a smartphone through three different studies. Specifically, to understand the feasibility of detecting user engagement from mobile context, we first assess an EEG artifact with 10 users and observe a strong correlation between automatically detected engagement scores and user’s subjective perception of engagement. Grounded on this result, we model a set of application level features derived from smartphone usage of 10 users to detect engagement of a usage session using a Random Forest classifier. Finally, we apply this model to train a variety of contextual factors acquired from smartphone usage logs of 130 users to predict user engagement using an SVM classifier with a F1-Score of 0.82. Our experimental results highlight the potential of mobile contexts in designing engagement-aware applications and provide guidance to future explorations.
Author Keywords
Mobile Sensing; Engagement; Behaviour Modelling; EEG
ACM Classification Keywords
H.5.m. Information Interfaces and Presentation (e.g. HCI): Miscellaneous
INTRODUCTION
In the past decade, HCI studies have highlighted the need for broadening the scope of user experience beyond utilitarian aspects such as usability. Researchers have studied several hedonic and experiential factors of interacting with technology such as fun and playfulness [17], user emotions [27, 37], and receptivity [15, 29]. Of particular attention has been the study of user engagement with technology: how do we understand and design for more engaging user experiences, what are the factors that influence user engagement with a system? Can user engagement be quantified and even modelled so that system designers can accommodate engagement awareness in their design? Permission to make digital or hard copies of all or part of this work for personal or classroom use is granted without fee provided that copies are not made or distributed for profit or commercial advantage and that copies bear this notice and the full citation on the first page. Copyrights for components of this work owned by others than the author(s) must be honored. Abstracting with credit is permitted. To copy otherwise, or republish, to post on servers or to redistribute to lists, requires prior specific permission and/or a fee. Request permissions from [email protected].
UbiComp ’16,September 12 - 16, 2016, Heidelberg, Germany.
Copyright is held by the owner/author(s). Publication rights licensed to ACM. ACM 978-1-4503-4461-6/16/09...$15.00
DOI: http://dx.doi.org/10.1145/2971648.2971760
Answers to these questions have a profound impact on the success a system, as engagement awareness radically improves users’ experience with digital services [40]. Engagement is usually described as a combination of cognitive processes such as focused attention, affect, and interest. Attention is a quantification of momentary
cognitive resources, whereas engagement combines attention with affect and interest over a longer term to represent an individual’s lasting cognitive state. Engagement is traditionally measured using surveys and more recently through a user’s interaction pattern with a system, e.g., the time spent on a webpage. Studies on user engagement in the contexts of desktop-based systems [44] and websites [11, 49] have shown that simple metrics such as dwell time are meaningful and robust in modelling user engagement. More importantly, these research have shown that with an awareness of engagement, users’ experience with a system can be substantially improved which in turn leads to user growth, user retention, and increasing revenue streams. While many past works in mobile computing have investigated attention-aware systems, we are unaware of any work that looked at understanding user engagement with smartphones, especially in a content-agnostic way.
In this work, we explore this specific aspect of understanding engagement dynamics in a smartphone space. Our premise is that:”Contextual factors derived from smartphone usage, and its embedded sensors carry vital information to model user engagement”.
Intuitively, one can assume that there are certain contexts in a day when a user might be more likely to engage with their smartphone: John’s engagement with his phone might be high when he is traveling to work on a bus, or Jane’s engagement with her phone might be low when she is in a meeting. We examine whether this intuition holds taking an experimental approach through a set of studies. First, to understand the feasibility of detecting user engagement from mobile context, we conduct a benchmarking study which compares the engagement metrics from an electroencephalogram (EEG) headset against the subjective perception of engagement in various smartphone usage scenarios. We observe a strong correlation between EEG engagement readings and user’s subjective perception of engagement. Next, to address the challenges associated with capturing EEG data at scale, we use a set of application level features acquired from smartphone usage of 10 users to develop a proxy model of user engagement. Finally, we design a large-scale study in which we examine a variety of contextual factors acquired
from smartphone usage logs of 130 users (e.g., environment, activity, usage pattern) to automatically predict engagement levels of future sessions. We eventually train a Support Vector Machine(SVM) classifier which uses 10 empirically picked contextual features to predict user engagement with a F1 -Score of 0.82.
In summary, our work makes the following contributions:
• We have conducted two studies with an EEG artifact to gather over 20 hours of engagement data coupled with smartphone usage in the real world affording us for the first time to assess user engagement in a mobile setting.
• We have conducted comprehensive experiments to examine the feasibility and performance of predicting user engagement from a rich set of mobile contexts.
• We introduce a novel engagement prediction model purely based on context features derived from the smartphone.
RELATED WORK
User Engagement Theories
In the psychology literature, user engagement has been linked to multiple theories including the flow theory [9, 10], aesthetic theory [5], play theory [41], and information interaction theory [42]. Through a meta-analysis of various engagement theories, O’Brien and Tom [31] concluded that user engagement is a combination of several cognitive processes, and is influenced bybothsystem attributes (such as content novelty, aesthetics, appeal) and user attributes (such as focused attention, felt involvement). That is, an aesthetically pleasing system with very interesting content alone may not engage a user, if the user does not have necessary attentional resources available. On similar lines, the Multiple Resource Theory [47] suggests that in multi-tasking scenarios (e.g. mobile phone usage in everyday life), users’ ability to perceive, interact or respond a task depends on the availability of visual, motor or cognitive resources needed for the task. For example, while driving a car, if a user receives an interesting content, he/she still may not engage with it because the user does not have sufficient visual and motor resources. Finally, the theory of learned attention and learned inattention [23] suggests that users develop a habit of either engaging with or ignoring certain kinds of cues depending on their context. A practical example of learned attention is the propensity among some users to engage with the email app as soon as they receive an email notification, irrespective of their current state. Similarly, if someone has learned not to engage (i.e., learned inattention) with their phone during the work hours, they are likely to ignore any content sent to them despite its relevance. Collectively, the aforementioned theories show that user engagement with a system is influenced not only by its content and relevance, but also by the context, available attentional resources, and long-term behavior of the users.
Due to the wide scope of the engagement modelling problem – in this paper, we limit our exploration to modelling of user engagement through mobile context features. In other words, we adopt a content and application-agnostic approach,
and only use context features derived from smartphones and aspects of user behavior to systematically model user engagement. However, we acknowledge that content relevance and application type alsocarry vital information for modelling user engagement, and developing models which combine content and context features for predicting engagement could be an avenue for future research.
Interruptibility Prediction
Detecting the right moments to interrupt a user has been an important problem in the attention-aware computing literature because interruptions at inopportune moments can adversely affect the cognitive state of the user [2], increase task completion times [30], and may lead to high task error rate [3]. Traditionally, interruptibility has been studied in static task-oriented environments such as desktop computers in offices (e.g. [16,20]), however with the growing popularity of ubiquitous technologies, interruptibility detection work has transitioned to smartphones and smartwatches. In this vein, techniques [21, 33] have been proposed which identify and use breakpoints in a user’s smartphone activity stream to trigger interruptions. Fischer et al. [14] proposed triggering interruptions immediately after completion of communication tasks such as phone calls and text messages, and Pejovic et al. [36] used rich context information from the smartphone to develop a machine learning model for triggering interruptions.
While the aforementioned works look at finding the right moments when users are interruptible, our goal in this paper is different, i.e. to find the right moments when the users are likely to be in a state of engagement. Similar to Pejovic et al. [36], we also use rich context information from a user’s smartphone to train a machine learning model for predicting user’s engagement.
Affective computing
In the field of Affective computing, systems have been developed that can detect and adapt themselves to users’ affective states. Picard et al. [38] showed automatic recognition of eight affective states from sensed physiological signals with 80% accuracy. Bixler and DMello [6] proposed using keystrokes during writing tasks to detect affective states such as boredom and engagement. Mark et al. [27] found that time of the day and frequency of window switches on the computer are some variables linked to boredom in the workplace. In the context of smartphones, Pielot et al. [39] showed that context features related to recency of communication, usage intensity, time of day, and demographics can infer boredom with an accuracy of up to 82.9%. Other works have found behavioral traits such as happiness [8], stress [7], mood [25] to be correlated to mobile phone usage features and personality traits of an individual. Our investigation continues the tradition of past studies examining the mobile context features to understand behavioral traits, and in particular user engagement.
CHALLENGES WITH ENGAGEMENT MODELLING
The primary goal of this work is to explore whether user engagement can be predicted using context and usage features
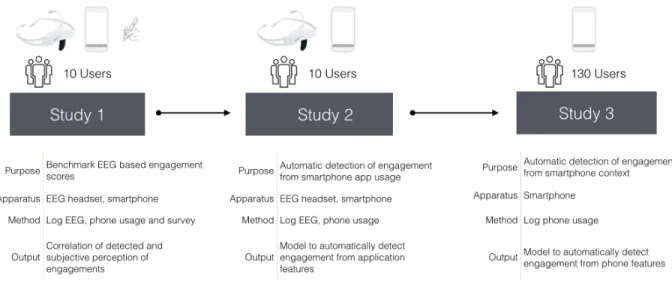
Figure 1. The overall methodology that we followed in this work to model user engagement from smartphone contexts.
derived from a smartphone. To achieve this objective, we need to address two things: a) large collection of data about smartphone usage in different real-world contexts, and b) collection of user engagement data as ground truth to qualify the smartphone usage. These requirements, and in particular the latter one pose the following challenges:
Collection of Data: While many studies in the recent past have explored smartphone-based data collection at scale [1, 45], the collection of user engagement data from smartphones still remains an open and challenging problem. Indeed, experience sampling method (ESM) has been used for collecting subjective user perceptions on interruptibility [29, 36], boredom [39]. However, in the context of this work ESM is not suitable as the subjective perception of engagement is a function of the engagement itself. Besides, as discussed earlier engagement has a temporal dimension demanding systematic ground truth collection which – if not impossible – is very hard to acquire with ESM. Survey-based techniques have also been proposed to measure user engagement [32] wherein users are asked to fill a long questionnaire after each interaction session. While this method is indeed acceptable for a short duration study, it will clearly overwhelm users if employed in a longitudinal study where users will have hundreds of smartphone interaction sessions every week. To address this challenge, in this work we decided to use a portable electroencephalogram (EEG) headset named Emotiv Insight1to get an estimate of the engagement levels of users. On wearing it, the Insight headset measures EEG signals from the user’s brain on 5 different channels, and processes them using proprietary algorithms to generate metrics on wearer’s
engagement, focus, excitement, stress, and relaxation. More specifically, for calculating user engagement scores, the Insight headset measures the degree of arousal of EEG beta waves along with attenuation of EEG alpha waves.
1https://emotiv.com/insight.php
Scale of Data: To build a reliable prediction model for user engagement, it is essential to gather smartphone context data and the corresponding engagement ground truth from a
diverseset of users acrossmultiple real-world contexts. This would ensure that the variations in user behavior and context that happen over time are well represented in the prediction model. To this end, an ideal experiment methodology would be to get a large number of users to wear the EEG headset for a sufficiently long period of time (e.g. few weeks), and gather data on their smartphone context and engagement scores. However, in practice this approach is not feasible for two reasons:firstly, as EEG headsets are not common in everyday life, users might find it awkward to wear them for a long period, or in specific contexts (e.g. in business meetings or while driving). Therefore, we will lose the ground truth data from many real-world contexts which will eventually make the prediction model inaccurate;secondly, EEG headsets are currently expensive (nearly $500 per headset) which makes their usage in a large-scale study impractical.
In summary – we need to conduct alarge-scale fieldstudy to gather rich and diverse smartphone context data for modelling engagement. However, the collection of EEG data (ground truth) in field at a large-scale is not feasible due to the aforementioned practical concerns. As such, we cannot use the smartphone context features from a large-scale study to directly create a predictive model of user engagement – hence we conduct our experiment in two phases. In phase one, we perform a small scale EEG-based study where we use smartphone usage featuresindependentof user’s context and historical patterns to build aproxy inference model for EEG engagement scores. In other words, we learn those features of a smartphone usage session that are correlated with the observed EEG engagement scores in the session – these features can thereafter be used as a proxy for the actual EEG measurements which are, as discussed earlier, difficult to collect at scale. In phase two, we conduct a large-scale study with 130 smartphone users where we log their smartphone usage for nearly 4 months, allowing us
to capture a rich data about various real-life contexts and longitudinal user behavior. Then we use theproxy inference modelfrom phase one to generate EEG ground truth labels for all usage sessions, and aim to build a predictive model which uses historical user data to predict future engagement of the users. It is important to highlight that this two-phase methodology involving a proxy model does result in a loss of prediction power of the model – however, for the aforementioned practical considerations, we argue that it is a reasonable methodology choice.
Reliability of Data: Emotiv EEG headsets use proprietary algorithms to computeengagementscores and in prior work, they have not been used to measure engagement with daily smartphone usage. As such, to ensure that the engagement scores generated by the headset are reliable and match the subjective perceptions of users, we did a benchmarking exercise at the start of our experiments. We compared the engagement scores generated by the EEG headsets against a state-of-the-art survey method named User Engagement Scale [32] that has been used extensively to measure user engagement with technology. Through this study, we learned the best way of interpreting the EEG engagement scores such that it matches with the subjective perception of the users. Figure 1 illustrates our overall methodology based on the design decisions discussed above. In what follows we describe the benchmarking experiment, followed by the two-phase study on modelling user engagement from smartphone contextual features.
UNDERSTANDING ENGAGEMENT EXPERIMENTALLY
We begin by experimentally benchmarking the EEG scores against subjective engagement perception of the users. Based on the result of this experiment we then move to our next study, in which we examine the automatic detection of engagement from application-level features.
Benchmarking EEG-based Engagement Data
Objective
In prior research [12, 18], Emotiv EEG headsets have been used in the domains of computer gaming, virtual reality, and human-robot interaction. However, the Emotiv EEG headsets have never been used to study user engagement with smartphones in everyday life. As such, we first benchmark the performance of the EEG headset against a state-of-the-art survey technique used for measuring engagement with technology systems. The User Engagement Scale (UES) [32] is a set of carefully designed questions which has been used to measure subjective user engagement in online shopping systems [35], news websites [34], video games [48] etc. Hence, we compare the engagement scores generated by the Insight EEG headset against the subjective perceptions of user engagement obtained from the UES.
Methodology
We recruited 10 participants (3 female), aged between 26 to 40 years for the study. Each participant wore the EEG headset and performed a set of 14 tasks on a Moto G Android smartphone. A diverse set of smartphone usage tasks of different nature and duration were chosen to account for
Focused Attention •When I was doing the task, I lost track of the world around me.
• I was so involved in the session that I lost track of time.
• I blocked out things around me when I was doing the task(s). Felt Involvement •I was absorbed in the task(s).
•I felt involved in the task(s).
•I felt interested in the task(s). Overall It was an engaging session for me.
Table 1. Questions from UES sub-scales to evaluate subjective user engagement
variations in EEG readings. The tasks included watching videos in the YouTube app (5), reading articles on various websites in the browser (5), installing the File Manager app from Google Play (1), installing the Meetup app from Google Play (1) and searching for meet-ups of their interest (1), and finally uninstalling the Meetup app from the device settings menu (1). During each task, we collected engagement scores from the EEG headset at the rate of 100 Hz.
After each task, we asked the participants to subjectively rate their engagement levels within the task using the User Engagement Scale (UES). UES is a multidimensional scale that contains six sub-scales: Aesthetics, Novelty, Perceived Usability, Endurability, Felt Involvement, and Focused Attention. The first 4 sub-scales evaluate the effect of content and system design on engagement, and the last 2 sub-scales (Felt Involvement and Focused Attention) pertain to the ability of a user to attend to and become involved in the task experience. As the broader focus of our work is on predicting user engagement in a content-agnostic manner, we only used the last 2 sub-scales for the benchmarking process. Table 1 lists the questions from the 2 sub-scales which the users were asked to rate on a Likert scale from ‘Strongly Disagree’ to ‘Strongly Agree’. Each experiment lasted for 30 minutes.
Analysis and Findings
For benchmarking, we perform a correlation analysis between the observed EEG engagement scores and the subjective preferences (Likert scores) for each task. Due to the diverse nature of the tasks, the EEG engagement scores are likely to vary across the tasks, but we expect a similar variation in the Likert scores – and indeed, a correlation analysis is apt to capture this variation.
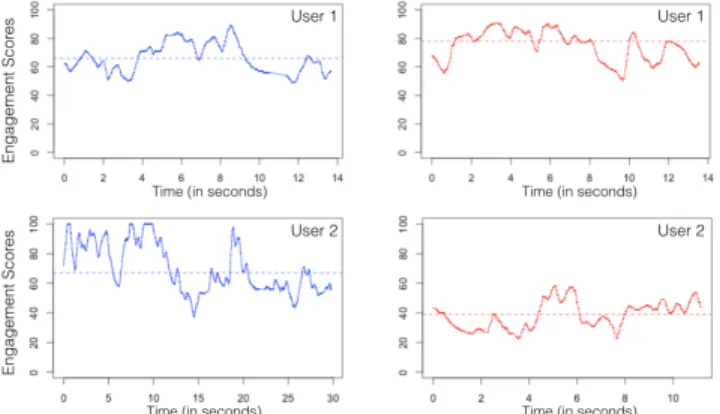
Figure 2 illustrates the observed EEG engagement scores for two different users while viewing a video in the YouTube app (blue line) and while reading an article on www.cnn.com (red line). The key observation from this figure is that the EEG engagement scores show significant variation over time during both tasks. As such, we extract various statistical properties from the EEG engagement scores during each task, and conduct a correlation analysis between each of them and Likert scale scores. We computed basic statistical properties such as mean, median, maximum, minimum, standard deviation - and also tried a complex linear regression
Max Spearman’s⇢= 0.71, p <0.001 (Max-Median) Spearman’s⇢= 0.6, p <0.001 Standard Deviation s Spearman’s⇢= 0.41, p <0.001 Mean Spearman’s⇢= 0.33, p <0.01 Table 2. Correlations between Likert scale scores and statistical features of an EEG session
model with 15 statistical features extracted from the EEG values. Table 2 shows the four statistical features that were best correlated with the Likert scale values - we found the strongest correlation (Spearman‘s ⇢ = 0.71, p < 0.001) between themaximumengagement score in a task and Likert scale scores, while the mean engagement score showed lower correlation with the subjective user preferences.
This finding suggests that themaximum engagement score obtained from the EEG headset during a task is the strongest indicator of the subjective user engagement. As such, we will refer to themaximumengagement scores as the Benchmarked Engagement Score (BES) in the subsequent studies in this paper, and use it as the primary EEG engagement metric for analysis.
Figure 2. Observed engagement scores of two users over two different tasks. The dashed lines represent the median.
Inferring Engagement From Application Features
Objective
As discussed earlier, the collection of EEG data at scale in various real-life contexts is a challenging task. To address this issue, we aim to develop a statistical model which can act as aproxyfor the benchmarked EEG engagement scores in real-world contexts, thereby allowing us to model the relationship between user contexts and EEG scores at scale. We now present a study which generates this proxy model for EEG scores using the features of a smartphone session.
Inspired by prior research on characterising mobile phone usage [4, 13, 43], we define a session as the period between screen-on and screen-off, during which a user interacts with the phone. On Android, events such as notification arrival and battery charging can switch on the screen automatically therefore, for an accurate representation of usage sessions, we filtered out the sessions that did not elicit any user interactions (i.e., screen unlocking). Further, we also accounted for accidental timeouts and unintentional breaks in interaction by merging two sessions that are 5 seconds or less apart [4].
System
We developed an Android application called SessionLogger which runs as a background service and passively logs user interaction sessions on the smartphone. More specifically, for each session, we log the timestamps of session-start, session-endand timestamps of open(foreground), app-close(background) of each application used in the session along with their names, and time spent on home/launcher screen. The logged data is saved on the Android filesystem and periodically uploaded to a backend server.
To collect engagement scores from the EEG headset, we used the Insight application provided by Emotiv on the Google Play Store2. The Insight application connects an Android smartphone to the EEG headset over Bluetooth Low Energy (BLE), and receives engagement scores from the headset at the rate of 100Hz. The engagement scores are logged in a file on the internal storage of the smartphone, and the data is periodically uploaded to a backend server for analysis. Methodology
10 participants (3 females) aged between 27 - 46 years were recruited for the study. They were all working professionals, and comprised of software developers, researchers, customer service executives, nurses and health managers. All participants lived in western Europe and had at least 5 years of experience using smartphones. None of them had previously used an EEG headset.
Participants installed the Insight and SessionLogger apps on their personal smartphones. Each participant was given an EEG headset, and was instructed how to wear the headset to get a good signal on all channels. They were also told how to connect their smartphone to the headset over BLE, and shown the process of logging engagement scores from the headset. We gave the EEG headset to each participant for 24 hours and asked them to wear it as long as possible. To minimise any bias in the smartphone usage when the headset is worn, participants were instructed to use their smartphones as they would normally do in their routine life. At the end of the 24 hour period, the participants returned the headset to the research team and uninstalled the apps from their smartphones.
Figure 3. EEG engagement data for a session from two users.
Analysis
In total, our system logged 23.7 hours of EEG data across all users (µ = 2.37 hours, = 1.1 hours). During this period, a total of 671 applications (µ= 67.1, = 33) were 2https://play.google.com/store/apps/details?id=com.emotiv.insightapp
Feature Description
BucketID A day was divided into time buckets of 5 minutes each. The ‘BucketID’ feature corresponds to the time bucket during which the app was launched.
Duration Total duration of the application. AppsInSession Number of apps used in the current
session, excluding the phone caller app.
AppOrder Order of the app in the session (i.e. whether it is the first app, second app and so on)
RevisitationCount [22] Number of times the current app has previously been used in the same session.
LastAppDuration Duration of the previous app used in the session.
TimeSinceLastApp Time difference between previous app-close timestamp and current app-open timestamp.
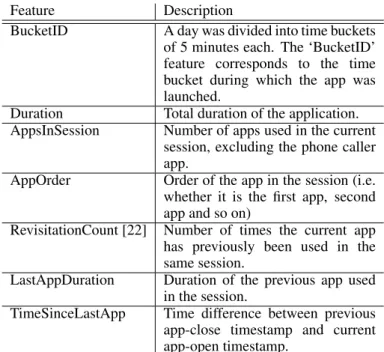
Table 3. Application features extracted from smartphone usage logs
accessed by the users on the smartphones in 250 separate sessions. Figure 3 illustrates the observed EEG engagement scores from smartphone sessions of two different users. The vertical red lines indicate the times when an app is opened (i.e. comes into the foreground), and the vertical green lines indicate the times when the same app is closed (i.e. goes into the background). For example, in Figure 3 (left), the first app is opened att1 = 3seconds into the session and closed at t2 = 43 seconds. As evident from the Figure, the engagement scores vary across different applications in a given session. Therefore, instead of modelling engagement scores for an entire session, we adopt an application-based modelling approach wherein we extract features related to each application accessed during the session, and use those features to model the observed benchmarked engagement scores while the app was being used.
Model to Detect Engagement From Application Features In total, we extract 7 features from each application usage period as explained in Table 3. The benchmarked engagement score observed during the app usage period is marked as the ground truth value for modelling the data. We opted to build a classifier of the user’s engagement with two classes: High EngagementandLow Engagement. To derive these classes, we calculate the median of BESs across all the applications for a user, and use the median as a pivot to divide the scores into 2 classes. Hence, the problem of modelling user engagement turns into a binary classification problem. We tested and empirically compared the performance of a wide range of classification techniques, including naive Bayes (NB), L2-regularized Logistic Regression (LR), Support Vector Machines (SVM) with a radial kernel, Adaptive Boosting (AdaBoost), and Random Forests (RF). For evaluating the performance of these models, we adopted two approaches of dividing the data into training set and
test set: 10-fold validation and Monte Carlo cross-validation with 10 iterations. We use the F1-score, the harmonic mean of precision and recall, as our primary evaluation metric.F1-score is calculated as follows:
F1= 2.
P recision.Recall P recision+Recall
Figure 4 shows the performance of the various classifiers across the two cross-validation methods. The results show that Random Forest classifier yielded the highestF1 score of 0.855 when used with the Monte Carlo cross validation approach.
Figure 4. Performance (F1-Scores) of different classification models.
Random Forest also ranks the features by their importance in the classification task, which is most commonly expressed using the MeanDecreaseGini metric. For the set of features used in our experiment, we calculated the
MeanDecreaseGini, and found that the top four features are BucketID (+) , Duration (+), AppOrder (+) and
LastAppDuration ( ). The +/ sign next to each feature shows the trend of the feature in relation to engagement. For example, observed EEG engagement becomes higher as theDurationincreases, while observed EEG engagement decreases as theLastAppDurationincreases.
In summary, by fusing data from smartphone usage sessions and EEG headsets, we succeeded in building a Random Forests classification model, which can infer binary engagement levels (High/Low) of a user solely based on features derived from the application usage. In the next section, we will demonstrate how we use this model as a
proxy for EEG engagement scoresin a large-scale study to qualify smartphone contexts with engagement attributes.
MODELLING ENGAGEMENT FROM MOBILE CONTEXTS
Objective
The objective of this study is to answer our primary research question: can context information derived from smartphones predict the level of user engagement in a content-agnostic manner? Developing a prediction model entails using properties or features of the past to predict the future state of an entity. In our case, this means using the historical usage behavior and context data of a user to predict his/her
Data Type Description
Screen events Screen turned on, off, unlocked.
Application events Time when an app comes into foreground and goes into background, app name.
Notification events Time of notification arrival, notification access or dismissal, name of application which sent the notification
Call events Time of call, type of call (incoming/outgoing/missed).
Sensor data Battery level, cell tower ID, WifiDetails (isConnected, BSSID), isHeadphoneConnected, ringer mode (silent/vibration/normal), proximity to the phone, ambient light intensity, ambient sound level, user’s physical activity.
Table 4. List of data collected from user’s phones.
engagement level in a future interaction session. This predictive modelling task by definition differs from the inference problem presented in the previous section where we employed the features of the ongoing application session to infer engagement. Here, while making a prediction for a future session, we will not have access to the application features that we used in Table 3 – for example, we do not know what would be the Duration of a future application session. We only have access to the past context and usage data (near-term and long-term)before a session starts, and a prediction for engagement must be made only using these features.
We learned from the theories of engagement presented earlier in the paper that engagement can be influenced by a variety of immediate user contexts as well as long term habits formed by the user. In this vein, we wanted to collect context data through a longitudinal study to ensure that we capture many different contexts of phone usage, and also gather data on long-term user interaction behavior with their smartphones. Next, we describe the application we developed for large-scale collection of smartphone usage and context data. System
We developed an Android application named QuantApp which runs on Android 5.0+. QuantApp is implemented to run as a background service on the users phone and passively record all usage sessions on the device along with context information around them. More specifically, Table 5 lists the data points collected from users’ phones. Screen, application, notification and call data was collected in an event-based manner, i.e. whenever a new data point becomes available (e.g., a new notification is received) - an event is fired by the Android operating system. QuantApp listens to these specific events and logs the appropriate data points. The sensor data items listed in the last row were collected in two ways: a) at the start of each smartphone session, i.e. whenever the screen was turned on, b) once every 15 minutes. The periodic collection of sensor data was done to ensure that context data is collected even during periods of inactivity.
After installing the app, users are asked to fill a short demographic questionnaire and provide permissions for QuantApp to access Notifications and Application Usage Data on their phone. These permissions cannot be applied through the standard Android Manifest, and must be manually provided by the user from the Settings Menu on their phone. QuantApp guides the user through this approval
process, and once the permissions are granted - the app starts running in the background to collect data logs. The logs are stored locally on the SD card of the phone, and are periodically uploaded to a remote server.
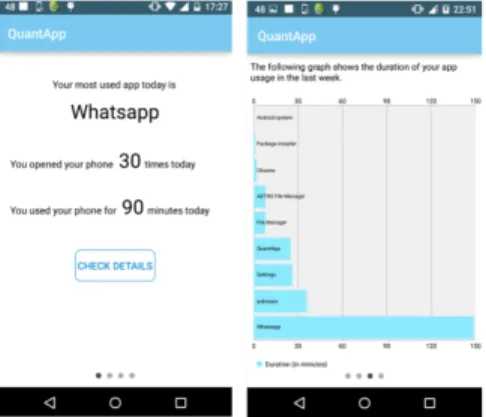
Finally, to give an incentive for people to install and use the app, QuantApp also shows statistics about user behavior, such as their most used app of the day, distribution of their application usage over a period of time, the number of notifications attended on their phone. Figure 5 shows two screenshots of the app.
Figure 5. Screenshots of the data collection app named QuantApp
Methodology
In December 2015, we published QuantApp on the Google Play Store and solicited participation by publicising the study on social networks and email lists. The app was installed by 130 users from 12 countries, including US, UK, India, Canada, Germany, Belgium, and Malaysia. The users were aged between 18 to 50 years, 34 of them were female, and 58 identified themselves as students.
After installation, users were shown a welcome screen where the purpose of the study, the functioning of the app and its data collection features were clearly mentioned. Further, users were informed that those who keep the app installed on their phone for at least six weeks will be eligible to win a smartwatch through a lottery process.
Logs and Feature Extraction
The raw data set obtained from the users until March 15, 2016 contains 44261 call events, 747,692 notification events, 1.1
Features Description
Device Context Features
ConnectionType Whether the device is connected to the internet over WiFi or cellular or not connected.
BatteryLevel Current battery level between 0 - 100
RingerMode Is the phone on silent, vibration or normal mode? Day of the Week a value between 0 to 6
Hour of the Day a value between 0 to 23
isWeekend True if the day is a Saturday or Sunday. False otherwise isCharging Flag whether the phone is currently being charged
Proximity Flag whether the screen is covered or not (determined using the proximity sensor)
Session Context Features
TimeSinceLastSession Time since the last session ended. TimeSinceLastCall Time since the last phone call.
TimeSinceLastNotification Time since the last notification was received
Initiator Flag whether the session was initiated due to a notification or due to users internal motivation.
Recent Usage Features
LastHourAppCount Number of apps used in the last hour LastHourSessionCount Number of sessions in the last hour
LastHourActiveTime Amount of time spent interacting with phone in the last hour LastHourNotificationReceived Number of notifications received in the last hour
LastHourNotificationAttended Number of notifications attended in the last hour
LastHourAppsPerMin LastHourAppCount divided by time the LastHourActiveTime LastHourBatteryDrain Battery drain in the last hour
Environment and Activity Features
Location Users semantic location (home/work/other) AmbientNoise Noise level measured in dB using the microphone AmbientLight Light level measured in lux using the light sensor
PhysicalActivity Physical Activity of the user (walking/running/stationary/driving/on a bike) obtained from Android APIs
Demographic Features
Age User’s age in years
Gender User’s gender
Occupation Student, employed, unemployed
Table 5. All the features used in our model related to device, session, recent usage and environment contex and demographic of a user
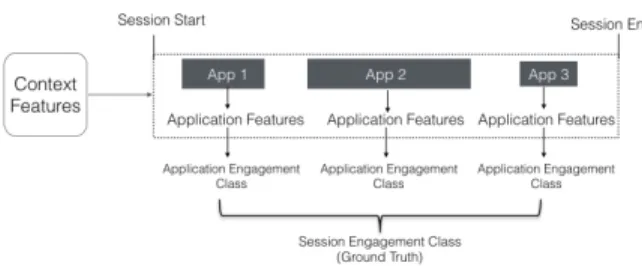
million application events, 1.08 million screen events, and 2.9 million sensor data points. In total, we observed 261,141 usage sessions (µ= 2008, = 1857) across all users. As shown in Figure 6, we extracted two kinds of features for each session: application features andcontext features.
Application features were computed for each application accessed in a session, and refer to the same 7 features used in the previous study and shown in Table 3. These features were only used to generate ground truth labels for engagement in a session and not used for predictive modelling.
Figure 6. Illustraion of a usage session used in the data analysis
In addition at the start of each session, we extracted 25context features related to phone usage patterns in 5 categories: device context features, session context features, features related to recent usage, environment and activity features and demographic features. These context features were used for predictive modelling and are described in Table 5. Some of the data points collected from mobile phones were used directly as features (for e.g., battery level, connection type, ringer mode). To compute the semantic location feature, we implemented existing techniques [26, 46] of modelling temporal variations in Wi-Fi and Cell-ID traces. We generated other features (e.g. those related to recent usage, battery drain) programmatically by doing a temporal analysis of the usage logs.
Qualifying Phone Session with Engagement Attribute After extracting the relevant features, we need to compute the ground truth of user engagement for each session. Recall that the absence of EEG engagement ground truth in a large-scale study was one of the key challenges that we identified at the beginning of the paper. In the previous study, we were able to
train a Random Forest model which uses only the application usage features to predict the binary engagement classes with a high degree of accuracy (F1 Score of 0.85). Therefore, we now use the same Random Forest model as a proxy for the missing EEG engagement scores in this study. The RF model is applied to the application usage features extracted in this study to obtain the user engagement class (High/Low) for each application usage period. Finally, to compute an engagement class for the entire session, we follow a majority voting scheme across all predicted user engagement classes, weighted by the duration of each app. For example, if apps withHigh Engagement Classhave higher app duration than apps withLow Engagement Class, then the session is categorised as aHighengagement session.
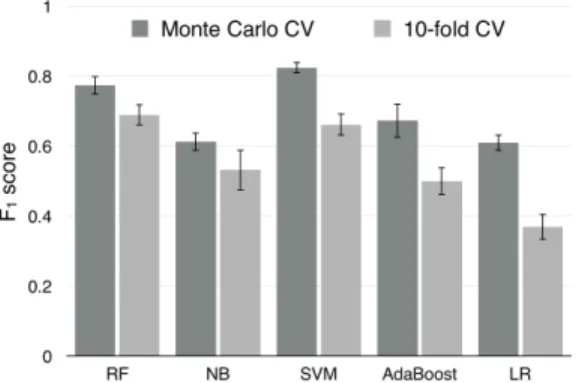
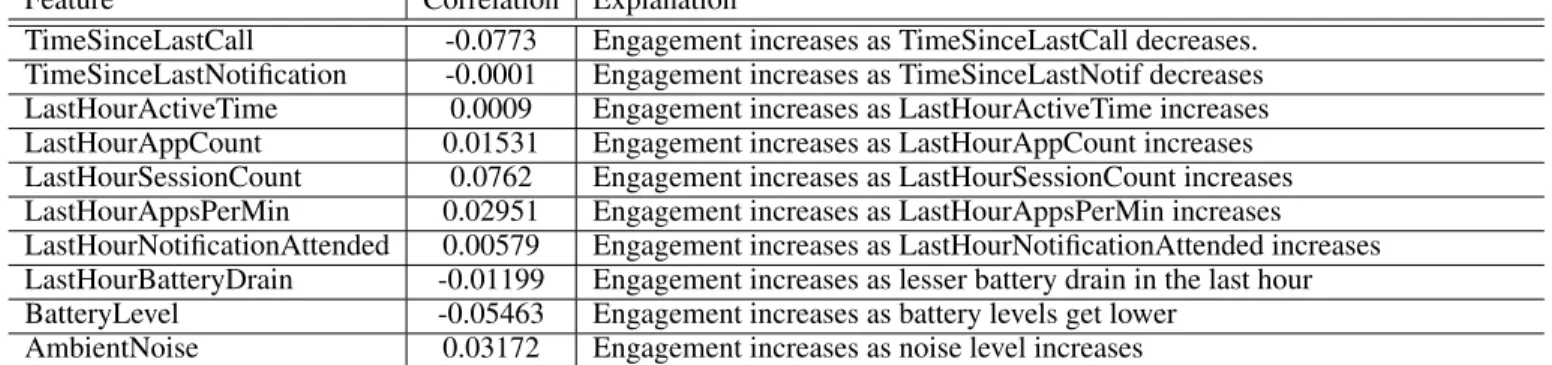
Model to Detect Engagement From Smartphone Features We adopted the same model building pipeline as the previous study, i.e we used 10-fold cross-validation and Monte Carlo cross-validation for dividing the data into training set and test set, and thereafter computed the (F1-score to compare the performance of different classifiers. Figure 7 shows the performance of various classifiers on the entire dataset. We obtained the best performance with an SVM classifier with a radial basis function (RBF) kernel. We used the Caret package in R to rank the features in the order of their importance to the SVM classifier. The 10 most important features for classification are listed in the sorted order in Table 6.
We also computed the direct relationship between engagement class and the top 10 features by doing a Point-Biserial correlation test. As shown in Table 6, we found that users exhibit lower engagement as more time passes since receiving the last call or notification. We also observe that usage activity in the last hour is a positive indicator for high engagement. Interesting, the results show that engagement is higher when the battery levels are low – we speculate that this negative correlation might be reflective of the user behavior at night, when users are likely to leave their phones for charging, but have minimal engagement with the phone. Finally, we observe that presence of ambient noise increases engagement.
Figure 7. Performance (F1-Scores) of different classification models on composite data.
Next, we trained the classifiers on each individual’s data separately to create a personalised model - figure 8 shows
the performance of these personalised classifiers averaged across all users. We observed that the SVM classifier with a radial basis function kernel has the best average performance, however its accuracy gains over the SVM classifier trained on composite data (Figure 7) are minimal ( 3%). This means that a classification model for predicting engagement levels can be trained using composite data from a large number of users, and need not be trained from scratch for individual users.
Figure 8. Performance (F1-Scores) of different personalised models. DISCUSSION
The primary focus of this work was to explore whether context information extracted from a smartphone can be a good predictor of user engagement. Several psychology and HCI theories in the past have suggested that user engagement is a complex metric, influenced by system features (e.g., usability, content) as well as the user’s context. In this work, we took a systematic approach to uncovering the dependency of user engagement on context features and showed that features related to smartphone sessions, near-past usage and device context are good predictors of user engagement. We now discuss how our findings can be applied to future mobile systems and applications.
Mobile Operating System as an Engagement Broker
In a recent work, Lee et al. [24] argued that mobile operating systems should manage user attention as a resource. They proposed that the OS should keep track of a user’s available attention at all times, and when an app demands user attention, the OS should check the user’s attention availability and match it against the attention demands of the app before letting the app interrupt the user. We envision that the model and features proposed in our work can be applied to a similar architecture for managing user engagement on smartphones in the future. As the operating system has access to all the context features used for training the engagement models in this work, it is uniquely suited to predict a user’s likely engagement at the start of each session. By doing so, the operating system can manage the delivery of content and services to the end-user by matching their engagement demands with the predicted engagement levels of the user. For instance, an app which shows mobile advertisements requires high engagement from the end-users, and can ask the operating system to push its content to the user when he/she is likely to be highly engaged. We believe that rethinking the mobile operating system as a broker for user engagement
Feature Correlation Explanation
TimeSinceLastCall -0.0773 Engagement increases as TimeSinceLastCall decreases. TimeSinceLastNotification -0.0001 Engagement increases as TimeSinceLastNotif decreases LastHourActiveTime 0.0009 Engagement increases as LastHourActiveTime increases LastHourAppCount 0.01531 Engagement increases as LastHourAppCount increases LastHourSessionCount 0.0762 Engagement increases as LastHourSessionCount increases LastHourAppsPerMin 0.02951 Engagement increases as LastHourAppsPerMin increases LastHourNotificationAttended 0.00579 Engagement increases as LastHourNotificationAttended increases LastHourBatteryDrain -0.01199 Engagement increases as lesser battery drain in the last hour BatteryLevel -0.05463 Engagement increases as battery levels get lower
AmbientNoise 0.03172 Engagement increases as noise level increases
Table 6. Features ranked by their importance in the SVM classification. Second column shows the correlation between the features and the High Engagement Class.
using models like ours could be an interesting area to explore in future work.
Improved Notification Delivery on Smartphones
Timely delivery of notifications on mobile devices has been an active area of research in the past few years. Researchers have primarily focused on understanding the receptivity of mobile notifications [29] and predicting opportune moments to deliver notifications in order to optimise metrics such as response time and emotion [36]. While response time and emotion are indeed useful metrics to optimise, they do not capture how much engagement will the user show towards the notification content. The primary purpose of a notification is to attract user attention and increase the possibility of user engagement with the notification content. As such, we believe that the models and features we demonstrated in this work can be incorporated in designing effective notification delivery mechanisms.
Increasing Response Rates in Crowdsourcing Systems
Another application of our proposed technique could be in crowdsourcing systems which rely on crowd responses. Such systems often suffer from low response rates [50]. To address this problem, researchers have looked at increasing the incentives for participation [28], and designing novel payment methods [19]. Similarly, when employing experience sampling (ESM) methods in smartphone studies, researchers are faced with the dilemma of when to send the ESM probe to the end-users, so that the user response rate is high. In addition to providing better incentives, we propose that researchers should explore sending ESM probes or crowdsourced tasks in an engagement-aware manner, i.e. during those sessions when the predicted user engagement is high leveraging the techniques discussed in this work.
CONCLUSIONS
In this work, we examined the influence of smartphone contexts in modelling user engagement. First, we assess the feasibility of an EEG artifact in detecting user engagement, and then developed a model to detect engagement automatically from application features using a Random Forest classifier with aF1-Score of 0.85. Finally, we have used this model to qualify rich smart phone contexts with engagement attribute using an SVM classifier with aF1 -Score of 0.82.
Limitations: Our work had a low proportion of female participants in the first two studies due to a practical limitation of the EEG headsets. For a good signal reading, the headsets require a firm contact between the EEG sensors and the scalp, which often becomes challenging and inconvenient for users with hair on their head. Due to this, it was difficult to recruit many female users for the study. Next, it is possible that wearing the EEG headset might have biased the smartphone usage of the participants in our second study. While we did instruct the participants to continue their regular smartphone usage behavior, the possibility of a bias cannot be discounted. In future work, we would compare the smartphone usage behaviour of participants with and without the EEG headset, and report any findings of usage bias. In this work, we adopted the methodology of using a proxy inference model to generate ground truth labels. While this approach allowed us to overcome the practical constraints with collecting EEG data at scale, it also results in a loss of prediction power of the overall model. In future when EEG headsets become pervasive, similar studies could be conducted with true engagement ground truth obtained directly from EEG headsets in a real-world setting. Finally, the performance of our prediction models was also limited by the scope of our research question - as we wanted to predict engagement levels in a content-agnostic manner only using the context features. We believe that the proposed model can be used as a bootstrapping model for engagement and over a period of time, it can be fine-tuned to individual user preferences, or combined with features related to content novelty, relevance and aesthetics to improve its performance.
Despite these limitations, we believe our work is the first-of-its-kind study to examine, and model the user engagement purely based on features derived from a smartphone. We also hope that the theoretical framework, models, and insights developed in this work will bring clarity and guidance to aid future Ubicomp practitioners and mobile system developers in designing better, and engagement-aware user experiences.
ACKNWLEDGMENTS
We thank the shepherd and the reviewers for their feedback on the paper. We also thank Dr. Sourav Bhattacharya for his valuable inputs on the predictive modelling algorithms. We are grateful to Ms. Anjali Mathur for her help in usability testing of QuantApp and participant recruitment.
REFERENCES
1. Ricardo Baeza-Yates, Di Jiang, Fabrizio Silvestri, and Beverly Harrison. 2015. Predicting the next app that you are going to use. InProceedings of the 8th International Conference on Web Search and Data Mining. ACM. 2. Brian P. Bailey and Joseph A. Konstan. 2006. On the
need for attention-aware systems: Measuring effects of interruption on task performance, error rate, and affective state.Computers in Human Behavior22, 4 (2006), 685–708.
3. Konstan J. Bailey, Brian. and Carlis J. 2001. The Effects of Interruptions on Task Performance, Annoyance, and Anxiety in the User Interface. InProceedings of INTERACT.
4. Nikola Banovic, Christina Brant, Jennifer Mankoff, and Anind Dey. 2014. ProactiveTasks: the short of mobile device use sessions. InProceedings of MobileHCI ’14. ACM, 243–252.
5. MC Beardsley. 1982. The aesthetics point of view: Selected essays (MJ Wreen & DM Callen, Eds.). (1982). 6. Robert Bixler and Sidney D’Mello. 2013. Detecting
boredom and engagement during writing with keystroke analysis, task appraisals, and stable traits. In
Proceedings of IUI ’13. ACM, 225–234.
7. Andrey Bogomolov, Bruno Lepri, Michela Ferron, Fabio Pianesi, and Alex Sandy Pentland. 2014. Daily stress recognition from mobile phone data, weather conditions and individual traits. InProceedings of the ACM international conference on multimedia. ACM, 477–486.
8. Andrey Bogomolov, Bruno Lepri, and Fabio Pianesi. 2013. Happiness recognition from mobile phone data. In
Social Computing (SocialCom), 2013 International Conference on. IEEE, 790–795.
9. Peter Chapman, Sanjeebhan Selvarajah, and Jane Webster. 1999. Engagement in multimedia training systems. InSystems Sciences, 1999. HICSS-32. Proceedings of the 32nd Annual Hawaii International Conference on. IEEE, 9–pp.
10. Mihaly Csikszentmihalyi. 2014. Toward a psychology of optimal experience. InFlow and the foundations of positive psychology. Springer, 209–226.
11. Ernesto Diaz-Aviles, Hoang Thanh Lam, Fabio Pinelli, Stefano Braghin, Yiannis Gkoufas, Michele Berlingerio, and Francesco Calabrese. 2014. Predicting user
engagement in twitter with collaborative ranking. In
Proceedings of the 2014 Recommender Systems Challenge. ACM, 41.
12. Ehsan Tarkesh Esfahani and Vedantham Sundararajan. 2011. Using brain–computer interfaces to detect human satisfaction in human–robot interaction.International Journal of Humanoid Robotics8, 01 (2011), 87–101. 13. Denzil Ferreira, Jorge Goncalves, Vassilis Kostakos,
Louise Barkhuus, and Anind K Dey. 2014. Contextual
experience sampling of mobile application micro-usage. InProceedings of the MobileHCI ’14. ACM, 91–100. 14. Joel E Fischer, Chris Greenhalgh, and Steve Benford.
2011. Investigating episodes of mobile phone activity as indicators of opportune moments to deliver notifications. InProceedings of MobileHCI ’11. ACM, 181–190. 15. Joel E Fischer, Nick Yee, Victoria Bellotti, Nathan Good, Steve Benford, and Chris Greenhalgh. 2010. Effects of content and time of delivery on receptivity to mobile interruptions. InProceedings of MobileHCI ’10. ACM, 103–112.
16. James Fogarty, Scott E Hudson, Christopher G Atkeson, Daniel Avrahami, Jodi Forlizzi, Sara Kiesler, Johnny C Lee, and Jie Yang. 2005. Predicting human
interruptibility with sensors.ACM TOCHI12, 1 (2005), 119–146.
17. Sarah Gallacher, Jenny O’Connor, Jon Bird, Yvonne Rogers, Licia Capra, Daniel Harrison, and Paul Marshall. 2015. Mood squeezer: Lightening up the workplace through playful and lightweight interactions. InProceedings of CSCW ’15. ACM.
18. Tom V Iancovici, Sebastian Osorio, and BJ Rosario. 2011. Biofeedback in Virtual Reality Applications and Gaming.Massachusetts, University of Massachusetts
(2011).
19. Kazushi Ikeda and Michael S Bernstein. Pay It Backward: Per-Task Payments on Crowdsourcing Platforms Reduce Productivity.
20. Shamsi T Iqbal and Brian P Bailey. 2008. Effects of intelligent notification management on users and their tasks. InProceedings of the SIGCHI Conference on Human Factors in Computing Systems. ACM, 93–102. 21. Shamsi T Iqbal and Brian P Bailey. 2010. Oasis: A
framework for linking notification delivery to the perceptual structure of goal-directed tasks.ACM Transactions on Computer-Human Interaction (TOCHI)
17, 4 (2010), 15.
22. Simon L Jones, Denzil Ferreira, Simo Hosio, Jorge Goncalves, and Vassilis Kostakos. 2015. Revisitation analysis of smartphone app use. InProceedings of UbiComp ’15. ACM, 1197–1208.
23. John K Kruschke. 2001. Toward a unified model of attention in associative learning.Journal of mathematical psychology45, 6 (2001), 812–863. 24. Kyungmin Lee, Jason Flinn, and Brian Noble. 2015. The
case for operating system management of user attention. InProceedings of the 16th International Workshop on Mobile Computing Systems and Applications. ACM, 111–116.
25. Robert LiKamWa, Yunxin Liu, Nicholas D Lane, and Lin Zhong. 2013. Moodscope: Building a mood sensor from smartphone usage patterns. InProceeding of MobiSys ’13. ACM.
26. Juhong Liu, Ouri Wolfson, and Huabei Yin. 2006. Extracting semantic location from outdoor positioning systems. Innull. IEEE, 73.
27. Gloria Mark, Shamsi T Iqbal, Mary Czerwinski, and Paul Johns. 2014. Bored mondays and focused afternoons: The rhythm of attention and online activity in the workplace. InProceedings of CHI ’14. ACM, 3025–3034.
28. Winter Mason and Duncan J Watts. 2010. Financial incentives and the performance of crowds.ACM
SigKDD Explorations Newsletter11, 2 (2010), 100–108. 29. Abhinav Mehrotra, Veljko Pejovic, Jo Vermeulen,
Robert Hendley, and Mirco Musolesi. 2016. My Phone and Me: Understanding Peoples Receptivity to Mobile Notifications. (2016).
30. Christopher A Monk, Deborah A Boehm-Davis, and J Gregory Trafton. 2002. The attentional costs of interrupting task performance at various stages. In
Proceedings of the Human Factors and Ergonomics Society Annual Meeting.
31. Heather L O’Brien and Elaine G Toms. 2008. What is user engagement? A conceptual framework for defining user engagement with technology.American Society for Information Science and Technology59, 6 (2008), 938–955.
32. Heather L O’Brien and Elaine G Toms. 2010. The development and evaluation of a survey to measure user engagement.Journal of the American Society for Information Science and Technology61, 1 (2010), 50–69.
33. Tadashi Okoshi, Julian Ramos, Hiroki Nozaki, Jin Nakazawa, Anind K Dey, and Hideyuki Tokuda. 2015. Attelia: Reducing user’s cognitive load due to
interruptive notifications on smart phones. InPervasive Computing and Communications (PerCom), 2015 IEEE International Conference on. IEEE, 96–104.
34. Heather OBrien and Paul Cairns. 2015. An empirical evaluation of the User Engagement Scale (UES) in online news environments.Information Processing & Management51, 4 (2015), 413–427.
35. Heather Lynn OBrien. 2010. The influence of hedonic and utilitarian motivations on user engagement: The case of online shopping experiences.Interacting with Computers22, 5 (2010), 344–352.
36. Veljko Pejovic and Mirco Musolesi. 2014. Interruptme: designing intelligent prompting mechanisms for pervasive applications. InProceedings of the 2014 ACM International Joint Conference on Pervasive and Ubiquitous Computing. ACM, 897–908.
37. Rosalind W Picard. 2010. Affective computing: from laughter to IEEE.Affective Computing, IEEE Transactions on1, 1 (2010), 11–17.
38. Rosalind W Picard, Elias Vyzas, and Jennifer Healey. 2001. Toward machine emotional intelligence: Analysis of affective physiological state.Pattern Analysis and Machine Intelligence, IEEE Transactions on23, 10 (2001), 1175–1191.
39. Martin Pielot, Tilman Dingler, Jose San Pedro, and Nuria Oliver. 2015. When attention is not
scarce-detecting boredom from mobile phone usage. In
Proceedings of UbiComp ’15. ACM, 825–836.
40. Janeaya Revels, Dewi Tojib, and Yelena Tsarenko. 2010. Understanding consumer intention to use mobile services.Australasian Marketing Journal (AMJ)18, 2 (2010), 74–80.
41. William Stephenson. 1964.The play theory of mass communication. Transaction Publishers.
42. Elaine G Toms. 2002. Information interaction: Providing a framework for information architecture.
Journal of the American Society for Information Science and Technology53, 10 (2002), 855–862.
43. Niels van Berkel, Chu Luo, Theodoros
Anagnostopoulos, Denzil Ferreira, Jorge Goncalves, Simo Hosio, and Vassilis Kostakos. A Systematic Assessment of Smartphone Usage Gaps.
44. Henriette C van Vugt, Elly A Konijn, Johan F Hoorn, I Keur, and Anton Eli´ens. 2007. Realism is not all! User engagement with task-related interface characters.
Interacting with Computers19, 2 (2007), 267–280. 45. Daniel T Wagner, Andrew Rice, and Alastair R
Beresford. 2013. Device analyzer: Understanding smartphone usage. InMobile and Ubiquitous Systems: Computing, Networking, and Services. Springer, 195–208.
46. Xiaoli Wang, Albert Kai-sun Wong, and Yongpmg Kong. 2012. Mobility tracking using GPS, Wi-Fi and cell ID. InInformation Networking (ICOIN), 2012 International Conference on. IEEE, 171–176. 47. Christopher D Wickens. 2002. Multiple resources and
performance prediction.Theoretical issues in ergonomics science3, 2 (2002), 159–177.
48. Eric N Wiebe, Allison Lamb, Megan Hardy, and David Sharek. 2014. Measuring engagement in video
game-based environments: Investigation of the User Engagement Scale.Computers in Human Behavior32 (2014), 123–132.
49. Elad Yom-Tov, Mounia Lalmas, Ricardo Baeza-Yates, Georges Dupret, Jos Lehmann, and Pinar Donmez. 2013. Measuring inter-site engagement. InBig Data, 2013 IEEE International Conference on. IEEE, 228–236. 50. Haichao Zheng, Dahui Li, and Wenhua Hou. 2011. Task
design, motivation, and participation in crowdsourcing contests.International Journal of Electronic Commerce