Missouri University of Science and Technology Missouri University of Science and Technology
Scholars' Mine
Scholars' Mine
Engineering Management and SystemsEngineering Faculty Research & Creative Works Engineering Management and Systems Engineering
01 Oct 2017
Instance Selection using Genetic Algorithms for an Intelligent
Instance Selection using Genetic Algorithms for an Intelligent
Ensemble Trading System
Ensemble Trading System
Youngmin KimDavid Lee Enke
Missouri University of Science and Technology, [email protected]
Follow this and additional works at: https://scholarsmine.mst.edu/engman_syseng_facwork Part of the Operations Research, Systems Engineering and Industrial Engineering Commons
Recommended Citation Recommended Citation
Y. Kim and D. L. Enke, "Instance Selection using Genetic Algorithms for an Intelligent Ensemble Trading System," Procedia Computer Science, vol. 114, pp. 465-472, Elsevier, Oct 2017.
The definitive version is available at https://doi.org/10.1016/j.procs.2017.09.030
This work is licensed under a Creative Commons Attribution-Noncommercial-No Derivative Works 4.0 License. This Article - Conference proceedings is brought to you for free and open access by Scholars' Mine. It has been accepted for inclusion in Engineering Management and Systems Engineering Faculty Research & Creative Works by an authorized administrator of Scholars' Mine. This work is protected by U. S. Copyright Law. Unauthorized use including reproduction for redistribution requires the permission of the copyright holder. For more information, please contact [email protected].
Available online at www.sciencedirect.com
1877-0509 © 2017 The Authors. Published by Elsevier B.V.
Peer-review under responsibility of the scientific committee of the Complex Adaptive Systems Conference with Theme: Engineering Cyber Physical Systems.
10.1016/j.procs.2017.09.030
ScienceDirect
Procedia Computer Science 114 (2017) 465–472
10.1016/j.procs.2017.09.030 1877-0509
ScienceDirect
Procedia Computer Science 00 (2017) 000–000
www.elsevier.com/locate/procedia
1877-0509 © 2017 The Authors. Published by Elsevier B.V.
Peer-review under responsibility of the scientific committee of the Complex Adaptive Systems Conference with Theme: Engineering Cyber Physical Systems.
Complex Adaptive Systems Conference with Theme: Engineering Cyber Physical Systems, CAS
October 30 – November 1, 2017, Chicago, Illinois, USA
Instance Selection Using Genetic Algorithms for an Intelligent
Ensemble Trading System
Youngmin Kim
aand David Enke
b*
aLaboratory for Investment and Financial Engineering, Department of Engineering Management and Systems Engineering, Missouri University of Science and Technology, 205 Engineering Management, 600 W. 14th Street, Rolla, MO, 65409-0370, USA
bLaboratory for Investment and Financial Engineering, Department of Engineering Management and Systems Engineering, Missouri University of Science and Technology, 221 Engineering Management, 600 W. 14th Street, Rolla, MO, 65409-0370, USA
Abstract
Instance selection is a way to remove unnecessary data that can adversely affect the prediction model, thereby selecting representative and relevant data from the original data set that is expected to improve predictive performance. Instance selection plays an important role in improving the scalability of data mining algorithms and has also proven to be successful over a wide range of classification problems. However, instance selection using an evolutionary approach, as proposed in this study, is different from previous methods that have focused on improving accuracy performance in the stock market (i.e., Up or Down forecast). In fact, we propose a new approach to instance selection that uses genetic algorithms (GAs) to define a set of target labels that can identify the buying and selling signals and then select instances according to three performance measures of the trading system (i.e., the winning ratio, the payoff ratio, and the profit factor). An intelligent ensemble trading system with instance selection using GAs is then developed for investors in the stock market. An empirical study of the proposed model is conducted using 35 companies from the Dow Jones Industrial Average, the New York Stock Exchange, and the Nasdaq Stock Market from January, 2006 to December, 2016.
© 2017 The Authors. Published by Elsevier B.V.
Peer-review under responsibility of the scientific committee of the Complex Adaptive Systems Conference with Theme: Engineering Cyber Physical Systems.
Keywords: Instance selection; Genetic algorithms; Intelligent trading system; Ensemble trading system.
* Corresponding author. Tel.: +1-573-341-4749 E-mail address: [email protected]
466 Youngmin Kim et al. / Procedia Computer Science 114 (2017) 465–472Kim / Procedia Computer Science 00 (2017) 000–000
1. Introduction
Data mining, or knowledge discovery in databases (KDD), is generally defined as the broad process of discovering hidden valuable knowledge or patterns in large amounts of data [5]. The process is composed of data preprocessing (i.e., data cleaning, integration, transformation, reduction, and discretization), modeling, data analysis, evaluation, and deployment [14]. Data preprocessing is one of the most important data mining processes since the data quality impacts the mining results. If poor data (or information) is coming into a process, unreliable and inconsistent results can be obtained; this is applicable to the concept of garbage in, garbage out (GIGO) in data-driven approaches, such as data mining, pattern recognition, and machine learning.
Data reduction techniques have generally used different approaches, such as feature selection, dimensionality reduction, and instance selection. In the literature, many related studies have shown promising results for data reduction using feature selection and dimensionality reduction when developing intelligent trading system [1, 4, 7, 12, 17]. For example, Zhong and Enke (2017) presented three dimensionality reduction techniques, including principal component analysis (PCA), fuzzy robust principal component analysis (FRPCA), and kernel-based principal component analysis (KPCA) to predict the daily direction of the S&P 500 Index ETF (SPY) return based on 60 financial and economic features. Other studies have also considered the use of technical indicators as features to an intelligent trading system [18, 19]. Chen et al. (2016) proposed a multi-factor time series model based on an adaptive network-based fuzzy inference system (ANFIS) for stock index forecasting. They considered stepwise regression to select technical indicators and then combined this with ANFIS to construct the forecasting model in the Taiwan and Hong Kong stock markets. Kim and Ahn (2012) proposed a new optimization model for artificial neural networks (ANNs) using GAs. It simultaneously optimizes four major architectural factors of ANNs, such as connection weights, the number of neurons in the hidden layer, feature subset selection, and feature transformation (i.e., discretization). Until now, the focus has been on selecting representative features or reducing dimensionality to obtain the same or higher accuracy (i.e., Up or Down prediction), rather than the original data set in stock markets.
However, data reduction carried out without instance selection for classification problems can lead to poor performance since the stock market is a complex system with noisy data. Thus, data preprocessing of instance selection is needed to achieve enhanced performance from learning algorithms [2]. One approach to instance selection is to calculate the distances to neighboring data points using a clustering algorithm (e.g., k-nearest neighbors). Another approach to instance selection is to choose the suitable instances (or objects) in the original data set to become the training data set for a learning algorithm. For example, a genetic algorithm (GA) approach to instance selection in ANNs is proposed in [8] to predict stock market movement. This result showed that if noisy and irrelevant instances are eliminated, not only does the classification accuracy increase, but the computational complexity can also be reduced. In particular, a GA is one of the most widely used algorithms for data reduction, such as feature selection, instance selection, and discretization [3, 7, 8, 9].
Nevertheless, from a practical point of view, trading performance is more important than classification accuracy when developing intelligent trading systems for the stock market; for instance, although classification accuracy is higher, trading performance might not be better if the trading system is evaluated using other factors, such as the winning ratio, the profit factor, the payoff ratio, and the number of trades [6, 13, 16]. Therefore, this study proposes a new approach to instance selection that uses GAs to define a set of target labels that can identify the buying and selling signals and then select instances based on the trading measures. Learning algorithms are then trained using the new reduced data set to develop an intelligent trading system. An empirical study of the proposed model is conducted using 35 stocks from the DJIA, NYSE, and Nasdaq Stock Market from January, 2006 to December, 2016. In addition, the results are compared to a conventional approach without instance selection.
2. An intelligent ensemble trading system with instance selection using genetic algorithms
An intelligent ensemble trading system with instance selection using GAs consists of three phases. In the first phase, instance selection using GAs is applied to produce a subset (i.e., instances) from the entire available data set, constructing a new training data set that is used for the learning algorithms. In the second phase, each supervised learning algorithm is trained using the new training data set. In the final phase, the intelligent ensemble trading
system generates trading signals (i.e., the buy, hold, and sell signals) using the trading strategy based on the majority voting method.
2.1. Phase 1: Instance selection using genetic algorithms
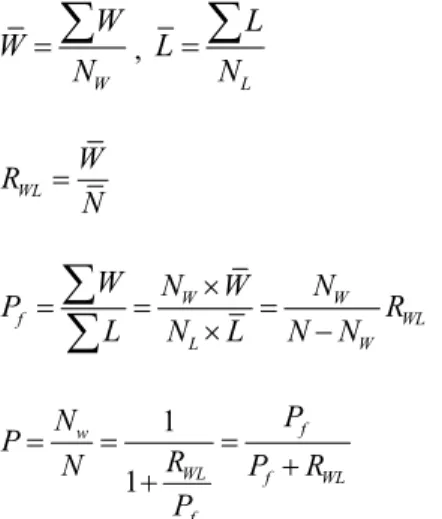
A profitable trading system can be defined by the winning ratio (i.e., the ratio of the number of winning trades to the total number of trades, P), the profit factor (i.e., the ratio of the amount of winning trades divided by the amount of losing trades, Pf ), and the payoff ratio (i.e., the ratio of average winning to average losing trade, PWL) [6, 13, 16]. To calculate the expected gain of the trading systems, it is necessary to know how often the system wins (or loses) and the amount of the average winning (losing) trades. These measures are calculated as follows:
W W W N
, L L L N
(1) WL W R N (2) W W f WL L W W N W N P R L N L N N
(3) 1 1 f w WL f WL f P N P R N P R P (4) where W L( )is the amount of the winning (losing) trade, with N (NW NL) being the total number of trades. Eq.(4) is the profitability rule that relates the winning ratio to the profit factor and the payoff ratio [6]. To select instances, a profitable trading system is needed to identify market signals (i.e., buy, hold, sell, or no position). A GA is then used to identify points when a stock is bought and sold using the past stock closing price, as shown in Fig. 1.
Fig. 1. Instance selection using GAs Date Close Signals Strategy
T-1 260.05 0 None T 259.45 1 Buy T+1 260.8 1 Hold T+2 261.3 -1 Sell T+3 259.9 0 None T+4 260.5 0 None T+5 256.5 1 Buy T+6 258.1 1 Hold T+7 261.05 1 Hold T+8 259.2 1 Hold
T+9 261.2 -1 Sell Date Feature 1 … Feature N Target label T-1 0.01 … 0.34 1 (Buy) T+1 0.01 … 0.26 -1 (Sell) T+4 0.02 … -0.28 1 (Buy) T+8 0.02 … -0.23 -1 (Sell)
The original data set
Define target labels using GAs (Buy=1 or Sell = -1, no position=0)
The reduced data set
Date Feature 1 … Feature N Target label T-1 0.01 … 0.34 -1 (Down) T 0.04 … -0.15 1 (Up) T+1 0.01 … 0.26 1 (Up) T+2 0.03 … -0.23 -1 (Down) … T+8 0.02 … -0.23 1 (UP) … … … …
468 Youngmin Kim et al. / Procedia Computer Science 114 (2017) 465–472Kim / Procedia Computer Science 00 (2017) 000–000
For the defined fitness function, the objective function of the instance selection using GAs is calculated as follows:
Maximize E g( ) No trade. P W (1 P L) N
L L
(5) where E g( ) is the expected gain, with a profitable trading system generating a positive value. Eq. (5) highlights how a profitable trading system with a positive expectancy is maximized by multiplying by the number of trades (i.e., opportunities). In other words, Eq. (5) highlights what the trading system can be expected to earn, on average, for every dollar at risk. Also, constraints are used for statistical sampling, including the number of trades (N > 30), the winning ratio (0.33 ≤ P ≤ 0.80), and the payoff ratio (0.25 ≤ PWL ≤ 2.00). These values are defined by Eq. (4) and the profit factor (Pf ≥ 1) [6].
2.2. Phase 2: Trading signal generation by learning algorithms
For this phase, learning algorithms are applied to train patterns based on the new training data set reduced in phase 1. The learning algorithms used include the multinomial logistic regression (MLR), k-Nearest-Neighbors (k -NN), Native Bayes, and artificial neural networks (ANN) since these learning algorithms are popular classifiers. In order to retrieve the most similar cases and to calculate the distance, the Euclidean distance and the value k(= 5) were used for k-NN. For the ANN, a three layer (i.e., the input, hidden, output layer), fully connected back-propagation neural network (BPN) was used. A sigmoid function is used as an activation function with a learning rate (0.1) and momentum rate (0.1).
2.3. Phase 3: Ensemble trading strategy
According to the predicted value (buy: +1 or sell: -1) from each learning algorithm (i.e., classifiers), the majority voting method is used to calculate a trading signal (i.e., buy, hold, or sell) at time t. An ensemble trading strategy is described as follows:
IF
Ci is greater than 0 (at time t) and no position (at time t-1), THEN buy signalElse if
Ci is greater than or equal 0 (at time t) and buy position (at time t-1), THEN holdElse if
Ci is less than 0 (at time t) and buy position (at time t-1), THEN sell signalElse if
Ci is less than 0 (at time t) and no position (at time t-1), THEN no positionElse no position (at time t) (i.e.,
Ci = 0)where Ci ( 1, , )i N is ith classifier (i.e., learning algorithm). This study used the classifiers (N=4) trained by the
learning algorithms in Phase 2.
3. Experimental results
An empirical study of an intelligent ensemble trading system with the instance selection using GAs is conducted using the daily closing prices of 35 companies from the DJIA, NYSE, and Nasdaq Stock Market. The data was obtained from Yahoo Finance from January 2, 2006 to December 31, 2016. The datasets were divided into training (January 2, 2006 to December 31, 2015; 2266 instances) and testing (January 4, 2016 to December 30, 2016) sets. New reduced training data sets are generated for every year for each stock using the previously described GA instance selection procedure. The features (i.e., input variables) used in this study were 8 technical indicators, including the moving average convergence divergence (MACD), the price rate of Change (ROC), momentum,
disparity (5), disparity (10), stochastic %K, stochastic %D, and moving average oscillator (MAO). The trading results are compared against traditional learning algorithms, such as k-nearest neighbors (k-NN), logistic regression, Naïve Bayes, artificial neural networks, and the ensemble classifier based on the majority voting method. For the modeling, a trading transaction cost of 0.1% was also considered.
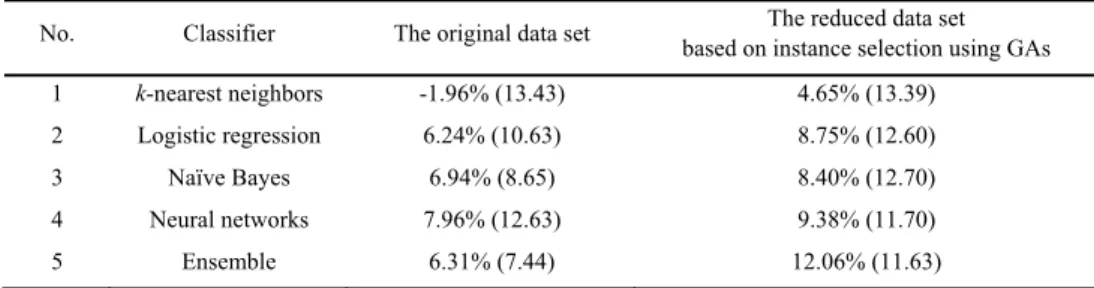
To compare the trading performance of the intelligent trading systems with instance selection using GAs, the conventional approach without instance selection (i.e., the original data set) is conducted. The data set of the conventional approach is comprised of the same features, but the target labels are defined as Up (+1) or Down (-1) [7, 8, 9, 10, 11, 17]. From Table 1, all trading systems with instance selection using GAs outperform trading systems without instance selection for the testing data set. These results show that instance selection using GAs approach allows for better learning patterns compared to conventional approaches. These results also indicate that instance selection using GAs eliminates noisy and irrelevant instances from the original data sets, selecting better market signals to improve trading performance. In particular, the intelligent ensemble trading system with instance selection using GAs shows the best trading performance (average returns: 12.06%, standard deviation: 11.63) when compared with the other approaches. In addition, the ensemble trading system with the majority voting method helps to provide better trading performance.
Table 1. Average returns and standard deviation of trading results
No. Classifier The original data set based on instance selection using GAs The reduced data set 1 k-nearest neighbors -1.96% (13.43) 4.65% (13.39)
2 Logistic regression 6.24% (10.63) 8.75% (12.60) 3 Naïve Bayes 6.94% (8.65) 8.40% (12.70) 4 Neural networks 7.96% (12.63) 9.38% (11.70)
5 Ensemble 6.31% (7.44) 12.06% (11.63)
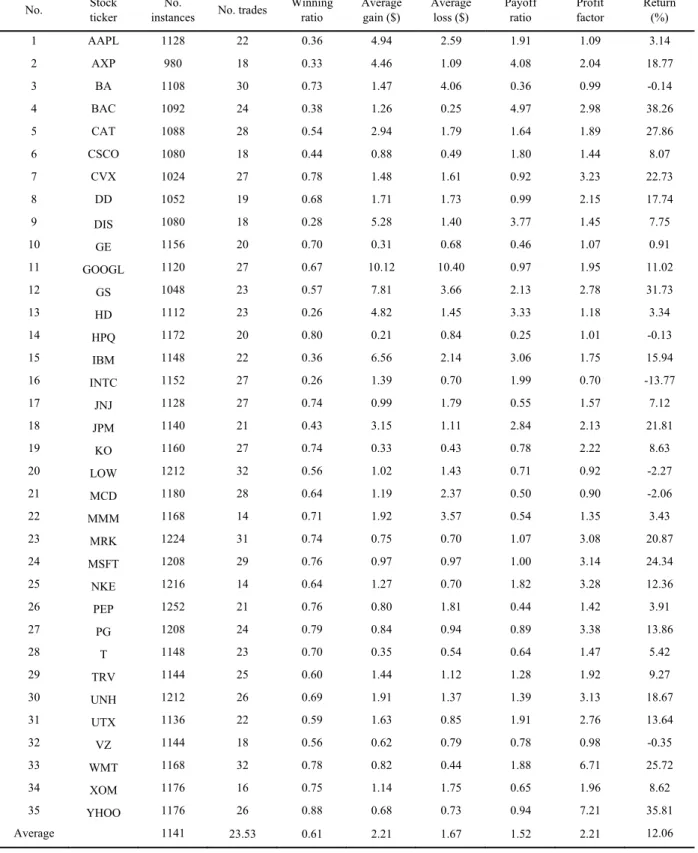
Tables 2-3 show trading performance of the ensemble trading systems according to various trading measures, including the number of instances (i.e., the number of samples), the winning ratio, the profit factor, the payoff ratio, and the number of trades. The intelligent ensemble trading system with instance selection using GAs produces larger profits compared to the conversional approach, illustrating that the training data set reduced by the instance selection using GA works effectively for learning algorithms. In addition, the ensemble trading system with instance selection using GAs obtains profit factors greater than 1 in 30 out 35 stocks. If the trading strategy is profitable, the profit factor is greater than 1, while a value less than 1 identifies a profitless trading strategy [6, 10, 15]. Furthermore, as shown in Tables 2-3, the proposed instance selection using GAs significantly reduces the data size (the average number of instances: 1141) for the learning algorithms, as compared with a conversional approach trained from all instances (i.e., 2266 instances).
4. Conclusions and future work
For this study, a novel instance selection using GAs is proposed for an intelligent ensemble trading system in the U.S. stock market. The results show that the proposed method can help to provide better profitability when compared to a conventional approach based on the original data set. The results also indicate that the training data set that was reduced based on instance selection using GAs helps the learning algorithms to train on patterns in the stock market, while the ensemble trading system can help to improve trading performance. These findings help to provide guidelines for developing an intelligent trading system when implementing instance selection approaches in the stock market. Nonetheless, it may be necessary to simulate different industry stocks, including defense contractors, drugs, and service industries before a stronger conclusion on robustness can be made. For further study, the intelligence ensemble trading system with instance selection using GAs could possibly be improved by allowing short selling of stocks. The model could also be applied to the futures market. In summary, both feature selection and instance selection should be considered in order to develop a more effective intelligence trading system.
470 Youngmin Kim et al. / Procedia Computer Science 114 (2017) 465–472Kim / Procedia Computer Science 00 (2017) 000–000 Table 2. Trading results of the intelligent ensemble trading system with instance selection using GAs
No. Stock ticker instances No. No. trades Winning ratio Average gain ($) Average loss ($) Payoff ratio Profit factor Return (%) 1 AAPL 1128 22 0.36 4.94 2.59 1.91 1.09 3.14 2 AXP 980 18 0.33 4.46 1.09 4.08 2.04 18.77 3 BA 1108 30 0.73 1.47 4.06 0.36 0.99 -0.14 4 BAC 1092 24 0.38 1.26 0.25 4.97 2.98 38.26 5 CAT 1088 28 0.54 2.94 1.79 1.64 1.89 27.86 6 CSCO 1080 18 0.44 0.88 0.49 1.80 1.44 8.07 7 CVX 1024 27 0.78 1.48 1.61 0.92 3.23 22.73 8 DD 1052 19 0.68 1.71 1.73 0.99 2.15 17.74 9 DIS 1080 18 0.28 5.28 1.40 3.77 1.45 7.75 10 GE 1156 20 0.70 0.31 0.68 0.46 1.07 0.91 11 GOOGL 1120 27 0.67 10.12 10.40 0.97 1.95 11.02 12 GS 1048 23 0.57 7.81 3.66 2.13 2.78 31.73 13 HD 1112 23 0.26 4.82 1.45 3.33 1.18 3.34 14 HPQ 1172 20 0.80 0.21 0.84 0.25 1.01 -0.13 15 IBM 1148 22 0.36 6.56 2.14 3.06 1.75 15.94 16 INTC 1152 27 0.26 1.39 0.70 1.99 0.70 -13.77 17 JNJ 1128 27 0.74 0.99 1.79 0.55 1.57 7.12 18 JPM 1140 21 0.43 3.15 1.11 2.84 2.13 21.81 19 KO 1160 27 0.74 0.33 0.43 0.78 2.22 8.63 20 LOW 1212 32 0.56 1.02 1.43 0.71 0.92 -2.27 21 MCD 1180 28 0.64 1.19 2.37 0.50 0.90 -2.06 22 MMM 1168 14 0.71 1.92 3.57 0.54 1.35 3.43 23 MRK 1224 31 0.74 0.75 0.70 1.07 3.08 20.87 24 MSFT 1208 29 0.76 0.97 0.97 1.00 3.14 24.34 25 NKE 1216 14 0.64 1.27 0.70 1.82 3.28 12.36 26 PEP 1252 21 0.76 0.80 1.81 0.44 1.42 3.91 27 PG 1208 24 0.79 0.84 0.94 0.89 3.38 13.86 28 T 1148 23 0.70 0.35 0.54 0.64 1.47 5.42 29 TRV 1144 25 0.60 1.44 1.12 1.28 1.92 9.27 30 UNH 1212 26 0.69 1.91 1.37 1.39 3.13 18.67 31 UTX 1136 22 0.59 1.63 0.85 1.91 2.76 13.64 32 VZ 1144 18 0.56 0.62 0.79 0.78 0.98 -0.35 33 WMT 1168 32 0.78 0.82 0.44 1.88 6.71 25.72 34 XOM 1176 16 0.75 1.14 1.75 0.65 1.96 8.62 35 YHOO 1176 26 0.88 0.68 0.73 0.94 7.21 35.81 Average 1141 23.53 0.61 2.21 1.67 1.52 2.21 12.06
Table 3. Trading results of the intelligent ensemble trading system without instance selection (the conversional approach)
No. Stock ticker No. trades Win% Average gain ($) Average loss ($) Payoff ratio Profit factor Return (%) 1 AAPL 11 0.55 2.59 2.48 1.05 1.25 3.03 2 AXP 17 0.71 1.11 3.00 0.37 0.89 -2.63 3 BA 11 0.73 5.84 11.86 0.49 1.31 7.93 4 BAC 23 0.57 0.31 0.46 0.68 0.88 -3.38 5 CAT 22 0.64 1.72 2.11 0.81 1.42 10.44 6 CSCO 18 0.33 1.17 0.52 2.26 1.13 3.08 7 CVX 15 0.67 2.73 2.21 1.24 2.47 17.64 8 DD 31 0.74 0.86 1.84 0.469 1.35 8.02 9 DIS 10 0.60 1.82 2.76 0.66 0.99 -0.11 10 GE 11 0.27 1.50 0.41 3.64 1.36 3.99 11 GOOGL 17 0.53 24.98 17.46 1.43 1.61 10.63 12 GS 14 0.71 4.39 6.72 0.65 1.63 9.33 13 HD 15 0.40 3.63 2.41 1.51 1.00 0.08 14 HPQ 19 0.79 0.43 1.04 0.41 1.55 18.80 15 IBM 13 0.77 3.73 3.95 0.94 3.15 17.89 16 INTC 10 0.50 1.15 0.30 3.85 3.85 12.22 17 JNJ 9 0.67 3.26 3.09 1.05 2.11 10.05 18 JPM 23 0.91 0.83 2.41 0.35 3.62 18.60 19 KO 13 0.23 0.97 0.58 1.68 0.51 -7.26 20 LOW 17 0.35 3.26 2.00 1.63 0.89 -3.36 21 MCD 9 0.67 2.37 3.41 0.70 1.39 3.47 22 MMM 10 0.60 1.74 1.82 0.96 1.43 2.20 23 MRK 17 0.59 0.95 0.63 1.50 2.14 9.58 24 MSFT 18 0.78 1.36 1.44 0.94 3.31 22.30 25 NKE 30 0.70 0.67 1.46 0.46 1.06 1.37 26 PEP 12 0.25 1.81 1.42 1.28 0.43 -7.98 27 PG 28 0.71 0.73 1.06 0.69 1.72 7.86 28 T 14 0.79 0.65 1.80 0.36 1.32 5.23 29 TRV 22 0.59 2.25 1.08 2.09 3.02 16.78 30 UNH 16 0.75 1.79 2.94 0.61 1.83 8.20 31 UTX 20 0.70 1.23 2.13 0.58 1.35 4.65 32 VZ 9 0.78 1.02 1.90 0.54 1.88 7.40 33 WMT 23 0.61 1.08 1.62 0.66 1.03 0.80 34 XOM 21 0.71 0.83 1.79 0.46 1.16 2.22 35 YHOO 25 0.52 0.76 0.78 0.97 1.05 1.57 Average 16.94 0.61 2.44 2.65 1.08 1.63 6.31
472 Youngmin Kim et al. / Procedia Computer Science 114 (2017) 465–472Kim / Procedia Computer Science 00 (2017) 000–000
Appendix A. Stock Ticker Symbols
The Dow Jones Industrial Average (DJIA) is recognized as a leading index and contains 30 of the most liquid securities in the U.S. stock market. However, of the 30 stocks in the DJIA, the component company Visa has been excluded for analysis since it provides fewer data points compared to the other stocks in the index. The remaining 6 stocks in the study were selected from either the New York Stock Exchange (NYSE) or the Nasdaq Stock Market since they are also well-known companies with liquid and actively traded stocks.
No. Stock Ticker No. Stock Ticker No. Stock Ticker
1 Apple AAPL 13 The Home Depot HD 25 Nike NKE
2 American Express AXP 14 Hewlett–Packard HPQ 26 PepsiCo PEP
3 Boeing BA 15 IBM IBM 27 Procter & Gamble PG
4 Bank of American BAC 16 Intel INTC 28 AT&T T
5 Caterpillar CAT 17 Johnson & Johnson JNJ 29 Travelers TRV 6 Cisco Systems CSCO 18 JPMorgan Chase JPM 30 UnitedHealth Group UNH 7 Chevron CVX 19 Coca-Cola KO 31 United Technologies UTX
8 DuPont DD 20 Lowe’s LOW 32 Verizon VZ
9 Walt Disney DIS 21 McDonalds MCD 33 Wal-Mart WMT
10 General Electric GE 22 3M MMM 34 ExxonMobil XOM
11 Alphabet GOOGL 23 Merck MRK 35 Yahoo YHOO
12 Goldman Sachs GS 24 Microsoft MSFT
References
1. Chen Y-S, Cheng C-H, Chiu C-L, Huang S-T. A study of ANFIS-based multi-factor time series models for forecasting stock index. Applied Intelligence 2016; 45(2): 277-292.
2. Dasarathy B.V. Nearest neighbour (NN) norms: NN pattern classification techniques. IEEE computer Society Press, 1991.
3. Derrac J, Garcia S, Herrera F. A survey on evolutionary instance selection and generation. International Journal of Applied Metaheuristic Computing 2012; 1(1): 60-92.
4. Enke D, Mehdiyev N. Stock market prediction using a combination of stepwise regression analysis, differential evolution-based fuzzy clustering, and a fuzzy inference neural network. Intelligent Automation and Soft Computing 2013; 19(4): 636-648.
5. Han J, Kamber M, Pei J. Data mining: Concepts and Techniques, 3rd ed. Morgan Kaufmann, 2011.
6. Harris M. Profitability and Systematic Trading: A Quantitative Approach to Profitability, Risk, and Money Management, Wiley trading, 2008. 7. Kim K-J, Ahn H. Simultaneous optimization of artificial neural networks for financial forecasting. Applied Intelligence 2012; 36:887-898. 8. Kim K-J. Artificial neural networks with evolutionary instance selection for financial forecasting. Expert Systems with Applications 2006; 30:
519-526.
9. Kim Y, Ahn W, Oh K.J, Enke D. An intelligent hybrid trading system for discovering trading rules for the futures market using rough sets and genetic algorithms. Applied Soft Computing 2017; 55: 127-140.
10. Kim Y, Enke D. Developing a rule change trading system for the futures market using rough set analysis. Expert System with Applications 2016; 59: 165-173
11. Lee S, Enke D, Kim Y. A relative value trading system based on a correlation and rough set analysis for the foreign exchange futures market. Engineering Applications of Artificial Intelligence 2017; 61: 47-56.
12. Mehdiyev N, Enke D. Interest rate prediction: a neuro-hybrid approach with data preprocessing. International Journal of General Systems 2014; 43(5): 535-550.
13. Penfold B. The universal principles of successful trading: Essential knowledge for all traders in all markets. Wiley trading, 2010.
14. Shmueli G, Bruce P.C, Patel N.R. Data mining for business analytics: Concepts, techniques, and applications with XLMiner. 3rd ed. Wiley, 2016.
15. Stridsman, T. Trading systems that work: Building and evaluating effective trading systems. New York: McGraw Hill Professional; 2001. 16. Tharp V. Trade your way to financial freedom. 2nd ed. McGraw Hill Professional; 2006.
17. Zhong X, Enke D. Forecasting daily stock market return using dimensionality reduction. Expert Systems with Applications 2017; 67: 126-139. 18. Bogullu V.K, Enke D, Dagli C.H. Using neural networks and technical indicators for generating stock trading signals. Intelligent Engineering
Systems through Artificial Neural Networks 2002; 12: 721-726.
19. Thawornwong S, Enke D, Dagli C.H. Using neural networks and technical analysis indicators for predicting stock trends. Intelligent Engineering Systems through Artificial Neural Networks 2001; 11: 739-744.