College
Choice
Report
Part 3
millions of people in high schools, colleges, professional associations,
businesses, and government agencies, nationally and internationally.
Though designed to meet a wide array of needs, all ACT programs and
services have one guiding purpose—helping people achieve education
and workplace success.
A copy of this report can be found at
www.act.org/collegechoice
The College Choice Report is an annual report series that follows an ACT-tested high school graduating class from high school through the second year of college. It focuses on an alternating set of student characteristics, preferences, and college search behaviors to assist enrollment managers, admissions personnel, and other college administrators with student recruitment, enrollment, and persistence. This College Choice Report is part of a report cycle that focuses on a particular ACT-tested high school graduating class. Other reports in this cycle are The Condition of College & Career Readiness, which highlights the academic readiness of high school graduates to enter college or career training, and The Reality of College Readiness, which highlights the relationships among readiness, college enrollment, and retention.
This College Choice Report series follows the ACT-tested high school graduating class of 2013, focusing on students’ selection of a college major or program of study. This is an important topic for enrollment managers and admissions officers to consider, as students’ choices of major have a number of implications for postsecondary institutions. For example, colleges can use information about students’ choices of planned major in both anticipating the demand for and reallocating the supply of seats within and across individual programs of study at an institution. Colleges can also use information about students’ choices of planned major to help them find programs of study that are a good fit with their interests, which in turn may help to increase student persistence rates and decrease the overall time to degree.
Part 1 of this series, Preferences and Prospects
(released November 2013), covers such topics as students’ choice of planned major, certainty of planned major choice, request for assistance with educational and occupational plans, Interest-Major Fit, best-fitting major, and selection of major as the most important factor in choosing a college. Part 2 of this series, Enrollment Patterns (released July 2014), focuses on the college enrollment of these ACT-tested high school graduates and addresses topics such as the consistency of college major choice between ACT® college readiness
assessment registration and the first year of college and changes to Interest-Major Fit among students who declared majors outside of their planned major areas.
Part 3 of this series, Persistence and Transfer
(released April 2015) focuses on consistency of college major choice between ACT registration and the second year of college and student persistence within majors between the first and second year of college.
Key Findings from Part 3
The following key findings are summarized in this report:
•
Many college students declare a major that is•
Achievement, certainty, and fit are important indicators of consistency between planned and declared major.•
Student flow from planned to declared major areas results in big gains and losses for some areas of study.•
Most students persist within the same major area between the first and second year of college.How to Use This Report
More than half (54%) of the graduating class of 2013 took the ACT during high school. Whether you are searching for prospective students locally or in other parts of the country, a better understanding of the preferences and college choice behaviors of ACT-tested students can improve your marketing and recruitment strategies. The information presented in this report (and in the accompanying online charts and maps) can provide insights and inform discussions on your campus about the desired characteristics and locations of prospective students and your strategies for recruiting them. For colleges that participate in the ACT Educational Opportunity Service (EOS), this information can help you to establish or refine your selection criteria to create more efficient student searches. Over time, the report can also help you gauge the effectiveness of your search, marketing, and recruitment strategies.
Sources
Student information provided in this report—such as students’ background characteristics, ACT scores, planned major, and participation in EOS—is collected when students register for and take the ACT. College enrollment during fall 2013 and fall 2014 is determined by matching the test records of the ACT-tested graduating class of 2013 with enrollment records that colleges provide to the National Student Clearinghouse®. Data from the National Student
Clearinghouse account for 95% of all enrollments in Title IV, degree-granting institutions in the nation.
Many College Students Declare a Major that Is Consistent with
Their Reported Plans on the ACT
Roughly half (49%) of all second-year college students from the high school graduating class of 2013 declared a major in the same area as the major that they had planned to enter when they registered for the ACT. This finding is similar to that among ACT-tested first-year college students, as shown in Part 2 of this report series.
Planned-Declared Major Consistency Differs by Planned Major Area
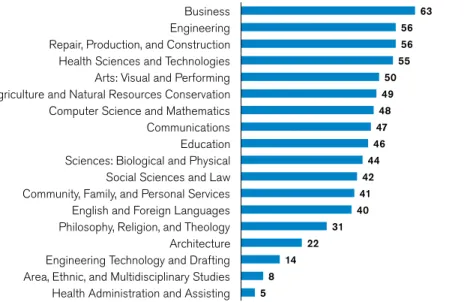
The consistency between college students’ planned and declared major area differs by the broad area in which they had selected a planned major (see Figure 1). At one extreme, roughly six out of 10 students (63%) who planned to major in the area of Business actually declared a major in this area by their second year of college. In only four other planned major areas— Engineering; Repair, Production, and Construction; Health Sciences and Technologies; and Arts: Visual and Performing—had 50% of second-year college students or more declared a major that was consistent with their plans. At the other extreme, roughly one-third of students or fewer declared a major that was consistent with their plans in five planned major areas: Philosophy, Religion, and Theology (31%); Architecture (22%); Engineering Technology and Drafting (14%); Area, Ethnic, and Multidisciplinary Studies (8%); and Health Administration and Assisting (5%).Figure 1. Planned-Declared Major Consistency Rate by Planned Major Area
5 8 14 22 31 40 41 42 44 46 47 48 49 50 55 56 56 63
Health Administration and Assisting Area, Ethnic, and Multidisciplinary Studies Engineering Technology and Drafting Architecture Philosophy, Religion, and Theology English and Foreign Languages Community, Family, and Personal Services Social Sciences and Law Sciences: Biological and Physical Education Communications Computer Science and Mathematics Agriculture and Natural Resources Conservation Arts: Visual and Performing Health Sciences and Technologies Repair, Production, and Construction Engineering Business
Planned-Declared Major Consistency Differs by College Level
The rate at which second-year students declared a major that is consistent with their plans also differs by college level. Only 41% of two-year college students declared a major that was consistent with their plans, as compared to 50% of four-year college students. This is due in Half of all college students declare a major that is consistent with their precollege plans.
part to there being fewer degree program offerings at two-year colleges compared to four-year colleges. There were some planned major areas, however, in which the planned-declared major consistency rate among two-year college students was relatively higher than the rate among their four-year college peers (See Table 1). For example, two-year college students were more than four times as likely as four-year college students to have declared a major that was located in their planned major area of Health Administration and Assisting; and they were more than twice as likely to have declared a major that was located in their planned major area of Engineering Technology and Drafting. On the contrary, four-year college students were 17 times as likely as two-year college students to have declared a major that was located in their planned major area of Philosophy, Religion, and Theology; and they were more than four times as likely to have declared a major that was located in their planned major area of Architecture. Table 1. Planned Major Areas with Largest Discrepancies in Planned-Declared Major Consistency Rates by College Level
Major Area 2-Year 4-Year
Favoring 2-Year Colleges
Health Administration and Assisting 13% 3% Engineering Technology and Drafting 26% 10%
Favoring 4-Year Colleges
Philosophy, Religion, and Theology 2% 34%
Architecture 6% 25%
Planned-Declared Major Consistency Differs by Gender
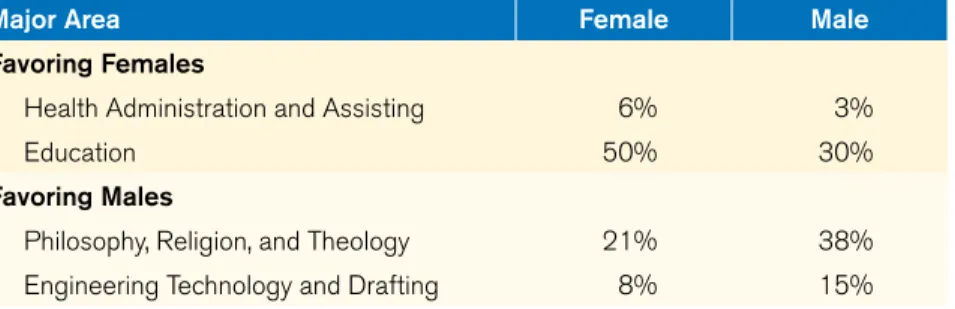
Although the overall planned-declared major consistency rate is the same for females and males (at 49%), this overall rate masks some important gender differences in consistency rates within specific planned major areas (see Table 2). At one end of the spectrum, females were twice as likely as males to have declared a major that was located in their planned major area of Health Administration and Assisting. They were also far more likely than males to have declared a major that was located in their planned major area of Education. At the other end of the spectrum, males were nearly twice as likely as females to have declared a major that was located in their planned major area of Philosophy, Religion, and Theology and in their planned major area of Engineering Technology and Drafting.
Table 2. Planned Major Areas with Largest Discrepancies in Planned-Declared Major Consistency Rates by gender
Major Area Female Male
Favoring Females
Health Administration and Assisting 6% 3%
Education 50% 30%
Favoring Males
Philosophy, Religion, and Theology 21% 38% Engineering Technology and Drafting 8% 15%
Achievement, Certainty, and Fit Are Important Indicators of
Planned-Declared Major Consistency
Why Academic Achievement Matters
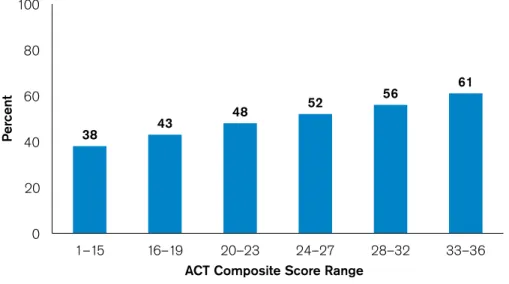
In general, second-year college students with higher academic achievement are more likely than their peers with lower academic achievement to have declared a college major that is consistent with their plans. Figure 2 illustrates the strong positive relationship between students’ ACT Composite score and their planned-declared major consistency rate. Roughly three out of five students with an ACT Composite score in the range of 33 to 36 declared a major that was located in their planned major area, compared with only two out of five students in the score range of one to 15 who declared a major that was consistent with their plans. Figure 2. Planned-Declared Major Consistency Rate by ACT Composite score
38 43 48 52 56 61 0 20 40 60 80 100 1–15 16–19 20–23 24–27 28–32 33–36 P er cent
ACT Composite Score Range
This positive relationship between students’ ACT Composite score and the consistency between their planned and declared major holds within most, but not all, planned major areas. Specifically, students with higher academic achievement are less likely than their lower-achieving peers to have declared a college major that is located in their planned major areas of Community, Family, and Personal Services; Engineering Technology and Drafting; Health Administration and Assisting; and Repair, Production, and Construction.
Why Planned Major Certainty Matters
When students select a planned major during the ACT registration process, they can also indicate the extent to which they are certain of their choice (i.e., very sure, fairly sure, or not sure). Thirty-eight percent of second-year college students who reported the certainty of their planned college major on the ACT were very sure of their choice; 46% were fairly sure of their choice, and 16% were not sure of their choice.
College students who reported a greater level of certainty regarding their choice of planned major were more likely than those who were less certain to have declared a major by the second year of college that was consistent with their plans. There is an 18 percentage-point difference in the share of students who declared a major within their planned major area Only two out of
five students who were not sure of their planned major end up declaring a major that aligns with their precollege plans.
between students who were very sure of the planned major and those who were not sure of their choice. Specifically, 56% of students who were very sure of their planned major declared a major that was located in their planned major area, compared to only 47% of students who were fairly sure of their planned major and 38% of students who were not sure of their planned major. This positive relationship between the level of certainty of students’ planned major and the rate at which their declared major was consistent with their plans was similar across all planned major areas.
Why Interest-Major Fit Matters
The Interest-Major Fit index measures the strength of the relationship between the student’s profile of ACT Interest Inventory scores and the profile of interests of students in a given major. Thirty-nine percent of second-year college students who selected a planned major during ACT registration chose a major that is a good fit with their interests, as measured by the ACT Interest Inventory; another 32% selected a planned major that had a moderate fit with their interests, whereas 29% chose a planned major that had a poor fit with their interests. As with the self-reported measure of students’ certainty of their planned major choice, the extent to which students’ choice of planned major aligns with their measured interests is a good predictor of whether they will follow through on their plans during college. There is a 14 percentage-point difference in the share of students who followed through on their plans and declared a major within their planned major area between students who had a good Interest-Major Fit and those with a poor Interest-Major Fit for their planned major choice. Specifically, 55% of students who had a good Interest-Major Fit for their planned major had declared a major that was consistent with their plans, compared to 48% of students with a moderate Interest-Major Fit for their planned major and only 41% of students with a poor Interest-Major Fit for their planned major. This same positive relationship holds across all planned major areas but two: Community, Family, and Personal Services; and Health
Administration and Assisting. Within these two major areas, there is no relationship between Interest-Major Fit and planned-declared major consistency.
When Achievement, Certainty, and Fit Are Combined
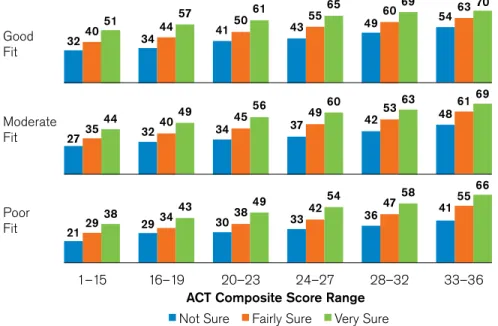
When examined separately, second-year college students with higher ACT Composite scores, greater certainty about their choice of planned major and better Interest-Major Fit were more likely than their peers to declare a major that is located in their planned major area. When examined together, it becomes clearer how these three indicators operate relatively independently and additively to predict planned-declared major consistency in the second year of college. As seen in Figure 3, within each combination of ACT Composite score range and level of Interest-Major Fit, the planned-declared major consistency rate increases with greater levels of planned major certainty. Similarly, within each combination of ACT Composite score range and level of planned major certainty, the planned-declared major consistency rate increases with improvement in students’ Interest-Major Fit. Finally, within each combination of level of Interest-Major Fit and level of planned major certainty, the planned-declared major consistency rate increases with students’ ACT Composite score range.
Only two out of five students with a poor fit between their planned major and their measured interests end up declaring a major that aligns with their precollege plans.
Figure 3. Planned-Declared Major Consistency Rate by ACT Composite score, Certainty of Planned Major Choice, and Level of interest-Major Fit
21 29 38 29 34 43 30 38 49 33 42 54 36 47 58 41 55 66 27 35 44 32 40 49 34 45 56 37 49 60 42 53 63 48 61 69 32 40 51 34 44 57 41 50 61 43 55 65 49 60 69 54 63 70 1–15 16–19 20–23 24–27 28–32 33–36
ACT Composite Score Range
Not Sure Fairly Sure Very Sure Good Fit Moderate Fit Poor Fit
Consider the following example taken from Figure 3. At one extreme, among those second-year college students in the lowest ACT Composite score range (1–15) who were not sure of their planned major and who selected a planned major that had a poor fit with their measured interests, only two out of 10 (21%) students declared a major in their planned major area. At the other extreme, among those students in the highest ACT Composite score range (33–36) who were very sure of their planned major choice and who selected a planned major that had a good fit with their measured interests, seven out of 10 (70%) students declared a major in their planned major area.
Student Flow from Planned to Declared Major Areas Results in
Big Gains and Losses for Some Areas of Study
Major Areas with a Net Loss
About six (5.8) second-year college students left their planned major area of Architecture to declare a major in another area for every student who left another planned major area to declare a major in Architecture. Among those students who left this planned major area, the top recipients were major areas such as Engineering (21%); Business (20%); and Arts: Visual and Performing (11%).
For every second-year college student who left another planned major area to declare a major in Health Sciences and Technologies, roughly four (3.8) students left their planned major area of Health Sciences and Technologies to declare a major in another area. Popular destinations for students who left this planned major area are areas such as Sciences: Biological and Physical (33%); Community, Family, and Personal Services (16%); Business (12%); and Social Sciences and Law (11%). Several majors (e.g., Osteopathic Medicine) within the major area of
Health Sciences and Technologies do not necessarily have undergraduate offerings, which would explain why so many of these students declared majors in other related areas.*
Three second-year college students left their planned major area of Health Administration and Assisting to declare a major in another area for every student who left another planned major area to declare a major in Health Administration and Assisting. Of those who left this planned major area, most students went on to areas such as Health Sciences and Technologies (40%); Sciences: Biological and Physical (14%); Community, Family, and Personal Services (13%); and Business (10%).
Table 3. Major Areas with the Largest net gains and Losses as second-year College students Move from Planned Majors to Declared Majors
Major Area Entering Students | Leaving Students
Largest Net Losses
Architecture
1 5.8
Health Sciences and Technologies
1 3.8
Health Administration and Assisting
1 3.0
Largest Net Gains
Community, Family, and Personal Services
6.5 1
Repair, Production, and Construction
3.1 1
Area, Ethnic, and Multidisciplinary Studies
2.2 1
Major Areas with a Net Gain
For every second-year college student who left the planned major area of Community, Family, and Personal Services to declare a major in another area, more than six (6.5) students left another planned area to declare a major in Community, Family, and Personal Services. Students who entered this major area came mostly from planned areas such as Health Sciences and Technologies (32%); Social Sciences and Law (22%); and Business (10%).
About three (3.1) second-year college students left another planned major area to declare a major in Repair, Production, and Construction for every student who left this planned major area to declare a major in another area. Among students who entered this planned major area, the top contributors were major areas such as Engineering (32%); Engineering Technology and Drafting (14%); and Business (10%).
For every second-year college student who left the planned major area of Area, Ethnic, and Multidisciplinary Studies to declare a major in another area, roughly two (2.2) students left another planned area to declare a major in Area, Ethnic, and Multidisciplinary Studies. Of those students who entered this major area, most were from planned areas such as; Social Sciences and Law (26%); Health Sciences and Technologies (14%); English and Foreign Languages (12%); and Sciences: Biological and Physical (11%).
Most Students Persist Within the Same Major Area Between the
First and Second Year of College
Of those ACT-tested students who were enrolled in college for a second year of study, 81% continued in the same major area that they declared during their first year of college, whereas 19% declared a major in a different major area.
Within-Major Persistence Differs by Planned Major Area
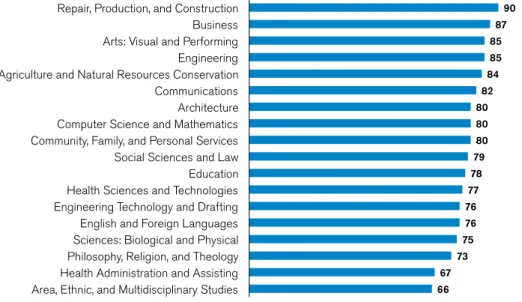
Persistence within a major area between the first and second year of college differs by the broad area in which the students had declared a major (see Figure 4). For example, nine out of 10 second-year students (90%) who declared a major in the area of Repair, Production, and Construction during their first year of college persisted in that area during the second year of college. In only three areas—Philosophy, Religion, and Theology; Health Administration and Assisting; and Area, Ethnic, and Multidisciplinary Studies—had fewer than three out of four students persisted in their declared major area from the first to the second year of college. Figure 4. Within-Major Persistence Rate by Declared Major Area
66 67 73 75 76 76 77 78 79 80 80 80 82 84 85 85 87 90
Area, Ethnic, and Multidisciplinary Studies Health Administration and Assisting Philosophy, Religion, and Theology Sciences: Biological and Physical English and Foreign Languages Engineering Technology and Drafting Health Sciences and Technologies Education Social Sciences and Law Community, Family, and Personal Services Computer Science and Mathematics Architecture Communications Agriculture and Natural Resources Conservation Engineering Arts: Visual and Performing Business Repair, Production, and Construction
Within-Major Persistence Differs by College Level and Transfer Status
Eighty-eight percent of students who were still enrolled in college re-enrolled at the same college for a second year of study, whereas 12% transferred to another college for a second year of study. Students who re-enrolled at the same college were nearly twice as likely to persist within the area of their declared major between their first and second year of college asstudents who transferred to another college. Specifically, 83% of non-transfer students and only 47% of transfer students persisted in their first-year declared major area for the second year of college.
Students who re-enrolled at same college. Of the students who re-enrolled at the same college, 20% attended a two-year college for both years of study, whereas 80% attended a four-year college for both years. Persistence within a major area for students who re-enrolled at the same college differs by the level of the college that they attended. Whereas 83% of four-year college students persisted in the same major area from the first four-year to the second four-year of college, a somewhat larger share of two-year college students (86%) continued in the same major area over the same time period.
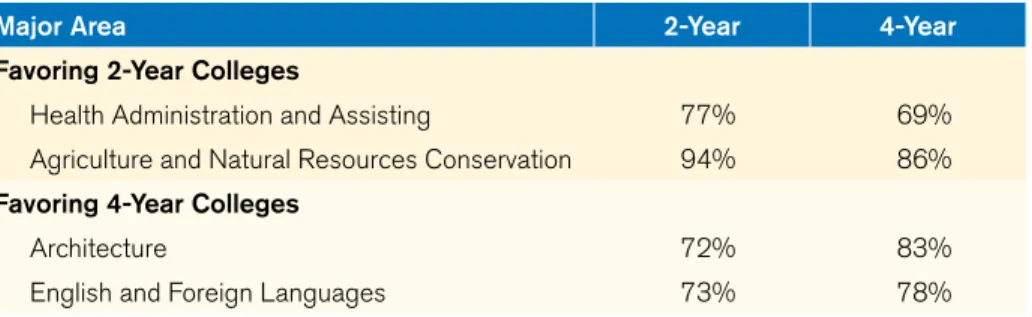
There were some declared major areas, however, in which four-year college students persisted within their major areas at relatively higher rates than that of their two-year college peers (see Table 4). For example, four-year college students who declared a major in areas such as Architecture; and English and Foreign Languages were more likely than two-year college students to have persisted within these major areas. On the contrary, two-year college students who declared a major in areas such as Health Administration and Assisting; and Agriculture and Natural Resources Conservation were more likely than four-year college students to have persisted within these major areas.
Table 4. Declared Major Areas with Largest Discrepancies in Within-Major Persistence Rates by College Level Among students Who Re-enrolled at the same College
Major Area 2-Year 4-Year
Favoring 2-Year Colleges
Health Administration and Assisting 77% 69%
Agriculture and Natural Resources Conservation 94% 86%
Favoring 4-Year Colleges
Architecture 72% 83%
English and Foreign Languages 73% 78%
Students who transferred to another college. Sixteen percent of two-year college students and 11% of four-year college students transferred to another college for their second year of study. Of these students, 11% transferred from a two-year college to another two-year college, 17% transferred from a two-year college to a year college, 40% transferred from a four-year college to another four-four-year college, and 32% transferred from a four-four-year college to a two-year college.
The rate at which transfer students persisted in the area of their declared major differs by the college level of the first institution attended and the direction of their transfer. Students who transferred between two four-year colleges have the highest rate of persistence within their major area (at 51%), followed by students who transferred between two two-year colleges (47%), students who transferred from a two-year college to a four-year college (44%), and students who transferred from a four-year college to a two-year college (40%).
Students who returned to the same college were almost twice as likely as transfer students to persist within their major area. Students who transferred from a four-year college to a two-year college were the least-likely students to persist within their college major area.
Within-Major Persistence Differs by Gender
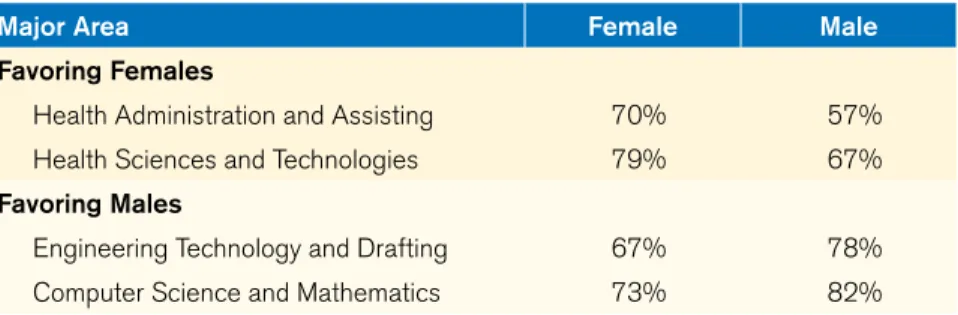
Overall, a slightly larger share of males (82%) than females (79%) persisted in the same declared major area between the first and second years of college. Gender differences are more prominent, however, within specific declared major areas (see Table 5). For example, females were more likely than males to persist in declared major areas such as Health Administration and Assisting; and Health Sciences and Technologies. Males, on the other hand, were more likely than females to persist in declared major areas such as Engineering Technology and Drafting; and Computer Science and Mathematics.
Table 5. Declared Major Areas with Largest Discrepancies in Within-Major Persistence Rates by gender
Major Area Female Male
Favoring Females
Health Administration and Assisting 70% 57% Health Sciences and Technologies 79% 67%
Favoring Males
Engineering Technology and Drafting 67% 78% Computer Science and Mathematics 73% 82%
Within-Major Persistence Differs by Academic Achievement
In general, students with the highest levels of entering academic achievement were more likely than their peers with lower academic achievement to have persisted within the same major area between the first and second years of college (See Figure 5). Among students in the score ranges of 1–15 through 24–27, roughly eight out of 10 students persisted within their declared major area, compared with 84% of students in the score range of 28–32 and 89% of students in the score range of 33–36.
Figure 5. Within-Major Persistence Rate by ACT Composite
79 78 79 81 84 89 0 20 40 60 80 100 1–15 16–19 20–23 24–27 28–32 33–36 P er cent
This general positive relationship masks some important differences in within-major persistence rates by the major areas themselves. In some major areas, such as Arts: Visual and Performing; Business; Computer Science and Mathematics; and Engineering, there is a very strong positive relationship between ACT Composite score and within-major persistence. In other major areas, such as Health Administration and Assisting, there is a clear negative relationship between ACT Composite score and within-major persistence. Further, in major areas such as Health Sciences and Technologies, there is no definitive relationship between ACT Composite score and within-major persistence.
Within-Major Persistence Differs by Planned-Declared Major Consistency
Persistence within a declared major area differs by whether the declared major area was consistent with students’ precollege plans. Eighty-four percent of second-year students who declared a major during the first year of college in an area that was consistent with their plans persisted in that major in the second year of college, compared to 76% of students who had declared a major that was inconsistent with their plans. This advantage in the within-major persistence rate for students who initially declared a major that was consistent with their plans holds across all declared major areas.Among first-year students who did not declare a major consistent with their plans, those whose declared major was an improvement in fit with their measured interests were more likely than their peers to persist in their declared major area. Specifically, 79% of students who improved their Interest-Major Fit between their planned and declared majors persisted in their declared major area. In comparison, 76% of students who had no change in their Interest-Major Fit and 74% of students whose Interest-Major Fit worsened persisted in their declared major area.
Within-Major Persistence Differs by Interest-Major Fit
The Interest-Major Fit index* measures the strength of the relationship between the student’s profile of ACT Interest Inventory scores and the profile of interests of students in a given major. Thirty-six percent of second-year college students who declared a major during the first year of college chose a major that is a good fit with their interests as measured by the ACT Interest Inventory; another 32% had a moderate Interest-Major Fit, whereas 32% had a poor fit. As with the consistency between students’ declared and planned major, the extent to which students’ first-year declared major aligns with their measured interests is a good predictor of whether they will persist in that major between the first and second year of college. Specifically, 83% of students who had a good fit between their first-year declared major and their interests
persisted in that major area in the second year of college, compared to 81% of students with a moderate Interest-Major Fit and 77% of students with a poor Interest-Major Fit. This same positive relationship held across all planned major areas but in Architecture; Health
Administration and Assisting; Philosophy, Religion, and Theology; and Social Sciences and Law. In these major areas, there is no definitive relationship between Interest-Major Fit for students’ declared major and their persistence within those major areas.
Students whose declared major was an improvement in fit with their measured interests were more likely than their peers to persist in their declared major area.
When recruiting students, colleges should:
•
Consider looking at students’ planned major while simultaneously considering their ACT scores, Interest-Major Fit score, and self-reported certainty of planned major choice in order to better identify students who may have a stronger interest in a particular major and who might be more likely to enroll in a particular major. This information is especially important when trying to recruit more male students to your campus and when trying to increase the enrollment of females within particular STEM fields.•
Use student results from the ACT Interest Inventory to provide prospective students who are undecided about their planned major choice with information about particular programs of study at the college for which they might have good fit.•
Promote institutional strengths in advising and career development to prospective students who are undecided about their major or occupation, are uncertain of their planned major or occupational choice, or indicate that they want assistance with educational and occupational planning. For example, admissions personnel could communicate information aboutacademic advising, special programs for undecided students, internships, career counseling, and other programs and services that can help students make informed decisions about educational majors and careers.
After students enroll, colleges should:
•
Use Interest-Major Fit scores as a part of institutional efforts to identify students who could benefit from advising and career planning interventions intended to guide students into better-fitting college majors.•
Use information regarding students’ status as undecided, certainty of their planned major choice, or their request for assistance with educational and career planning to help target students for additional academic advising and career counseling services as part of student orientation and first-year programming.•
Consider different advising strategies for high-achieving and low-achieving students, as high-achieving students are less likely to be very sure about their planned major choices but more likely to have good Interest-Major Fit, whereas low-achieving students are more likely to be very sure about their planned major choices but less likely to have good Interest-Major Fit.Definition of Declared Major
For this report, “declared major” is based on the six-digit CIP code that accompanies ACT-tested students’ enrollment record that colleges submit to the National Student Clearinghouse (NSC). Colleges can report both first and second major for the student as a six-digit CIP code and/or as a write-in response within a text field. This report is based on information reported for the students’ first major. We used a crosswalk between valid six-digit CIP codes and ACT college codes to categorize students’ declared majors into the same 18 broad areas we used for Part 1 and Part 2 of this report. The following documentation highlights the steps we took to prepare the NSC declared major data for
Part 3 of this report.
• If the CIP code and write-in response for the first major were missing, we replaced these values with those reported for the second major, when available.
• Where necessary, we updated CIP 2000 codes with CIP 2010 codes using a crosswalk provided by the National Center for Education Statistics (NCES).
• We checked all reported six-digit CIP codes in the NSC data file using a list of valid CIP 2010 codes provided by NCES. We found that 20% of ACT-tested enrollment records had no major information (i.e., neither a valid CIP code nor a write-in response). Of the 80% of records that had some type of major information, 73% had a valid CIP code and 7% had either a missing or invalid CIP code but had a write-in response to which a valid CIP code could potentially be assigned.
• We used a crosswalk based on information from enrollment records that had both a valid CIP code and a write-in response to assign a six-digit CIP code for enrollment records that possessed only a write-in response. For cases in which more than one valid CIP code accompanied a unique write-in response, we selected the CIP code that was most frequently paired with that write-in response. Using this process, we were able to assign a valid six-digit CIP code to 74% of the enrollment records in which a CIP code was previously missing or invalid. This increased the share of ACT-tested enrollment records that possessed a valid CIP code from 73% to 78%. Recall that only 80% of enrollment records had any major information; therefore, 98% of cases with any major information had or were assigned a valid CIP code.
• The following decisions decreased the share of ACT-tested enrollment records from 78% with a valid CIP code to 60% with a valid and usable CIP code:
~ We examined the range of CIP codes and types of write-in responses used by colleges, and we realized that colleges have different practices with regard to the assignment of CIP codes to undecided or undeclared students. In particular, we were not able to distinguish between an assignment of undeclared or undecided that was based on students’ intent versus one that was based on an institutional practice, such as assigning a student to “university college” or “general studies” until the student met the necessary criteria to enter a particular program of study. Given these complexities, we elected to remove from our analyses any student who was undecided or undeclared during their first year of college, including those assigned to the two-digit CIP code “24. Liberal Arts and Sciences, General Studies and Humanities.” As a result, we also removed from our analyses students who selected a planned major of “170 Liberal Arts and General Studies” when they registered for the ACT.
~ We elected to remove students with the two-digit CIP code “30. Multi/Interdisciplinary Studies” from our analyses given our inability to determine the various programs of study that could fall within this area. As a result, we also removed students who selected a planned major of “190 Multi/Interdisciplinary Studies” when they registered for the ACT.
~ We elected to remove students with the following valid two-digit CIP codes from our analyses, as these courses of study did not fall within the scope of this report: “32. Basic Skills and Developmental/Remedial Education,” “33. Citizenship Activities,” “34. Health-Related Knowledge and Skills,” “35. Interpersonal and Social Skills,” “36. Leisure and Recreational Activities,” “37. Personal Awareness and Self-Improvement,” “53. High School/ Secondary Diplomas and Certificates,” and “60. Residency Programs.”
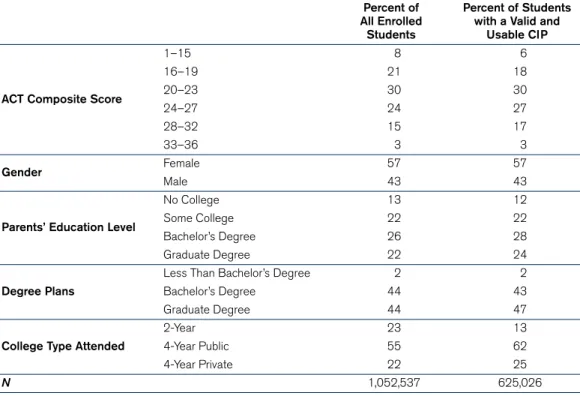
~ We compared the representativeness of students with valid and usable CIP codes against all ACT-tested students who were enrolled for a second year of college and found some differences between the two groups. In particular, students with valid and usable CIP codes were more likely to have higher ACT Composite scores and higher degree aspirations, and they were more likely to attend a four-year college than a two-year college (see Table 6).
• When determining whether students declared a major that was consistent with their planned major area, we found 17 planned majors (e.g., Osteopathic Medicine) for which few undergraduate degree programs were offered by colleges. For these planned majors, we used the data on the majors that these students most often declared during the first year of college along with our judgment of the typical paths to graduate or professional study in these areas
to determine which of the declared majors would be consistent with their planned major area. A list of the 17 planned majors and the three-digit codes for college majors that we considered to be consistent with their major plans is provided:
~ 480 Counseling and Student Services: 454, 480, 500, 510, 512, 513, 899
~ 490 Educational Administration: 490, 500, 510, 513, 516, 517
~ 511 Curriculum and Instruction: 413, 510, 511, 513
~ 515 Postsecondary Education: 510, 515, 520, 524, 526, 533, 590, 895 ~ 630 Chiropractic (Pre-Chiropractic): 421, 422, 630, 670, 860 ~ 650 Dentistry (Pre-Dentistry): 640, 650, 670, 860, 861, 873 ~ 690 Medicine (Pre-Medicine): 690, 860, 861, 873, 899 ~ 720 Optometry (Pre-Optometry): 670, 720, 860, 861, 873 ~ 730 Osteopathic Medicine: 421, 690, 730, 860, 861 ~ 740 Pharmacy (Pre-Pharmacy): 740, 860, 861, 873 ~ 750 Physician Assisting: 421, 670, 710, 750, 860
~ 763 Mental Health Counseling: 454, 767, 899
~ 765 Physical Therapy (Pre-Phys Therapy): 421, 422, 531, 624, 670, 671, 765, 860
~ 766 Psychiatric/Mental Health Technician: 454, 766, 767, 860, 899
~ 770 Veterinary Medicine (Pre-Vet): 117, 625, 770, 860, 867
~ 882 Law (Pre-Law): 442, 444, 882, 884, 895, 897, 899
~ 898 Psychology, Clinical and Counseling: 450, 454, 761, 763, 898, 899
A list of ACT’s college majors and respective codes can be found in the ACT Student Information Booklet (www.act.org/aap/infosys/recordinfo.html).
Table 6. Comparison of Key Characteristics Across Data samples Used in Determining Declared Major in the second year of College
Percent of All Enrolled
Students
Percent of Students with a Valid and
Usable CIP
ACT Composite Score
1–15 8 6 16–19 21 18 20–23 30 30 24–27 24 27 28–32 15 17 33–36 3 3 Gender Female 57 57 Male 43 43
Parents’ Education Level
No College 13 12
Some College 22 22
Bachelor’s Degree 26 28
Graduate Degree 22 24
Degree Plans
Less Than Bachelor’s Degree 2 2
Bachelor’s Degree 44 43
Graduate Degree 44 47
College Type Attended
2-Year 23 13
4-Year Public 55 62
4-Year Private 22 25
N 1,052,537 625,026
Definition of Interest-Major Fit
College majors have different academic cultures. Selecting a college major that is rewarding—that provides opportunities to do preferred activities and express one’s values—is an example of Interest-Major Fit. While many students gravitate toward majors that fit their interests, many do not. This has important implications. Evidence is accumulating that the fit between students’ interests and their college major is important in understanding and predicting student outcomes. Research at ACT and elsewhere suggests that if students’ measured interests are similar to the interests of people in their chosen college majors, they will be more likely to:
• remain in their major
• persist in college
• complete a college degree in a timely manner
Interest-Major Fit clearly benefits both students and the colleges they attend: students engaged in good-fit majors are more likely to stay in college, stay in their major, and finish sooner.
The ACT Interest-Major Fit score is derived from two data elements that are collected during ACT registration: (1) the student’s ACT Interest Inventory scores and (2) the student’s intended major from a list of 294 college majors. The Interest-Major Fit score used here measures the strength of the relationship between the student’s profile of ACT Interest Inventory scores and the profile of student interests in a given major. Interest profiles for majors are based on a national sample of undergraduate students with a declared major and a GPA of at least 2.0. Major was determined in the third year for students in four-year colleges and in the second year for students in two-year colleges.
The Interest-Major Fit score ranges from 0–99, with values of 80 and higher indicating good fit, values between 60 and 79 indicating moderate fit, and values less than 60 indicating poor fit.
An Interest-Major Fit score can be calculated for only 281 of the 294 planned major alternatives. Planned majors for which an Interest-Major Fit score cannot be calculated are indicated by an asterisk on the List of College Majors and Occupational Choices provided at the end of this report.
AGRICULTURE & NATURAL RESOURCES CONSERVATION
Agriculture, General
Agribusiness Operations
Agricultural Business & Management Agricultural Economics
Agricultural Mechanization Agricultural Production Agronomy & Crop Science Animal Sciences Food Sciences & Technology Horticulture Operations & Management Horticulture Science
Natural Resources Conservation, General
Environmental Science Forestry
Natural Resources Management Wildlife & Wildlands Management
ARCHITECTURE
Architecture, General
Architectural Environmental Design City/Urban/Regional Planning Interior Architecture Landscape Architecture
AREA, ETHNIC, &
MULTIDISCIPLINARY STUDIES
Area Studies, General (e.g., African, Middle Eastern)
Asian Area Studies European Area Studies Latin American Area Studies North American Area Studies
Ethnic & Minority Studies, General
African American Studies
American Indian/Native American Studies Latino/Chicano Studies
Women’s Studies
Liberal Arts & General Studies* Library Science
Multi/Interdisciplinary Studies*
ARTS: VISUAL & PERFORMING
Art, General
Art History, Criticism & Conservation Fine/Studio Arts
Cinema/Film
Cinematography/Film/Video Production
Dance
Design & Visual Communications, General Fashion/Apparel Design Graphic Design Industrial Design Interior Design Music, General Music, Performance Music, Theory & Composition
Photography Theatre Arts/Drama
BUSINESS
Accounting Accounting Technician Business Administration &
Management, General
Hotel/Motel Management
Human Resources Development/Training Human Resources Management International Business Management Labor/Industrial Relations Logistics & Materials Management Marketing Management & Research Office Supervision & Management Operations Management & Supervision Organizational Behavior
Purchasing/Procurement/Contracts Management
Restaurant/Food Services Management Small Business Management/Operations Travel/Tourism Management Business/Management Quantitative Methods, General Actuarial Science* Business/Managerial Economics Finance, General
Banking & Financial Support Services Financial Planning & Services
Investments & Securities
Management Information Systems Real Estate
Sales, Merchandising, & Marketing, General
Fashion Merchandising Tourism & Travel Marketing
Secretarial Studies & Office Administration COMMUNICATIONS Communications, General Advertising Digital Communications/Media Journalism, Broadcast Journalism, Print Mass Communications Public Relations & Organizational
Communication
Radio & Television Broadcasting
Communications Technology, General
Graphic & Printing Equipment Operation* Multimedia/Animation/Special Effects Radio & Television Broadcasting
Technology*
COMMUNITY, FAMILY, & PERSONAL SERVICES
Family & Consumer Sciences, General
Adult Development & Aging/Gerontology Child Care Services Management Child Development
Consumer & Family Economics Food & Nutrition
Textile & Apparel
Parks, Recreation, & Leisure, General
Exercise Science/Physiology/Kinesiology Health & Physical Education/Fitness Parks/Rec/Leisure Facilities
Management
Sport & Fitness Administration/ Management
Personal Services, General*
Cosmetology/Hairstyling* Culinary Arts/Chef Training Funeral Services & Mortuary Science
Protective Services, General
Corrections Criminal Justice
Fire Protection & Safety Technology Law Enforcement
Military Technologies*
Public Administration & Services, General
Community Organization & Advocacy Public Administration
Public Affairs & Public Policy Analysis Social Work
COMPUTER SCIENCE & MATHEMATICS
Computer & Information Sciences, General
Computer Networking/ Telecommunications
Computer Science & Programming Computer Software & Media Applications Computer System Administration Data Management Technology Information Science Webpage Design Mathematics, General Applied Mathematics Statistics EDUCATION
Counseling & Student Services Educational Administration Special Education Teacher Education, General
Curriculum & Instruction Early Childhood Education Elementary Education
Junior High/Middle School Education Postsecondary Education Secondary Education
Teacher Assisting/Aide Education
Teacher Education, Subject-Specific*
Agricultural Education Art Education Business Education Career & Technical Education
Education
English/Language Arts Education Foreign Languages Education Health Education
Mathematics Education Music Education
Physical Education & Coaching Science Education
Social Studies/Sciences Education
ENGINEERING Engineering (Pre-Engineering), General Aerospace/Aeronautical Engineering Agricultural/Bioengineering Architectural Engineering Biomedical Engineering Chemical Engineering Civil Engineering Computer Engineering Construction Engineering/Management Electrical, Electronics & Communications
Engineering
Environmental Health Engineering Industrial Engineering
Mechanical Engineering Nuclear Engineering
ENGINEERING TECHNOLOGY & DRAFTING
Drafting/CAD Technology, General
Architectural Drafting/CAD Technology Mechanical Drafting/CAD Technology
Engineering Technology, General
Aeronautical/Aerospace Engineering Technologies
Architectural Engineering Technology Automotive Engineering Technology Civil Engineering Technology Computer Engineering Technology Construction/Building Technology Electrical, Electronics Engineering
Technologies
Electromechanical/Biomedical Engineering Technologies Environmental Control Technologies Industrial Production Technologies Mechanical Engineering Technology Quality Control & Safety Technologies Surveying Technology
ENGLISH & FOREIGN LANGUAGES
English Language & Literature, General American/English Literature Creative Writing Public Speaking Foreign Languages/Literatures, General
Asian Languages & Literatures Classical/Ancient Languages &
Literatures Comparative Literature French Language & Literature German Language & Literature Linguistics
Middle Eastern Languages & Literatures Spanish Language & Literature
HEALTH ADMINISTRATION & ASSISTING
Health Services Administration, General
Hospital/Facilities Administration Medical Office/Secretarial Medical Records
Medical/Clinical Assisting, General
Dental Assisting Medical Assisting
Occupational Therapy Assisting Physical Therapy Assisting Veterinarian Assisting/Technology
HEALTH SCIENCES & TECHNOLOGIES
Chiropractic (Pre-Chiropractic) Dental Hygiene
Dentistry (Pre-Dentistry) Emergency Medical Technology Health-Related Professions &
Services, General*
Athletic Training
Communication Disorder Services (e.g., Speech Pathology)
Health/Medical Technology, General
Medical Laboratory Technology Medical Radiologic Technology Nuclear Medicine Technology Respiratory Therapy Technology Surgical Technology Medicine (Pre-Medicine) Nursing, Practical/Vocational (LPN) Nursing, Registered (BS/RN) Optometry (Pre-Optometry) Osteopathic Medicine Pharmacy (Pre-Pharmacy) Physician Assisting
Therapy & Rehabilitation, General
Alcohol/Drug Abuse Counseling Massage Therapy
Mental Health Counseling Occupational Therapy
Physical Therapy (Pre-Physical Therapy) Psychiatric/Mental Health Technician Rehabilitation Therapy
Vocational Rehabilitation Counseling
Veterinary Medicine (Pre-Veterinarian)
PHILOSOPHY, RELIGION, & THEOLOGY Philosophy Religion Theology, General Bible/Biblical Studies Divinity/Ministry Religious Education
REPAIR, PRODUCTION, & CONSTRUCTION
Aviation & Airway Science, General
Aircraft Piloting & Navigation Aviation Management & Operations
Construction Trades (e.g., carpentry, plumbing, electrical)
Mechanics & Repairers, General
Aircraft Mechanics/Technology Autobody Repair/Technology Automotive Mechanics/Technology Avionics Technology
Diesel Mechanics/Technology Electrical/Electronics Equip Installation
& Repair
Heating/Air Cond/Refrig Install/Repair
Precision Production Trades, General
Machine Tool Technology Welding Technology
Transportation & Materials Moving (e.g., air, ground, & marine)
SCIENCES: BIOLOGICAL & PHYSICAL
Biology, General
Biochemistry & Biophysics Cell/Cellular Biology Ecology
Genetics
Marine/Aquatic Biology Microbiology & Immunology Zoology
Physical Sciences, General
Astronomy
Atmospheric Sciences & Meteorology Chemistry
Geological & Earth Sciences Physics
SOCIAL SCIENCES & LAW
Legal Studies, General*
Court Reporting* Law (Pre-Law)
Legal Administrative Assisting/ Secretarial*
Paralegal/Legal Assistant
Social Sciences, General
Anthropology Criminology Economics Geography History
International Relations & Affairs Political Science & Government Psychology, Clinical & Counseling Psychology, General
Sociology
Urban Studies/Urban Affairs
policymakers with the information they need to inform education and workforce development policy and to give educators the tools they need to lead more students toward college and career success. What follows are some of ACT’s recent and most groundbreaking research studies.
College Choice Report 2012
Part 1: Preferences and Prospects
A Profile of 2012 ACT-TesTed high sChool grAduATes
College Choice Report Part 1 Preferences and Prospects
Contains the self-reported college preferences and EOS participation rates of the ACT-tested high school graduating class of 2012.
Part 2: Enrollment Patterns
A Profile of 2012 ACT-TesTed high sChool grAduATes
College Choice Report
Part 2
Enrollment Patterns
Examines college enrollment trends of the ACT-tested high school graduating class of 2012, focusing on student mobility, how college choices match preferences, and student enrollment rates.
Part 3: Persistence and Transfer
A Profile of 2012 ACT-TesTed high sChool grAduATes
College Choice Report
Part 3
Persistence and Transfer
Reports on student persistence within postsecondary education and examines the relationships between students’ reported college preferences and their transfer patterns.
College Choice Report 2013
Part 1: Preferences and Prospects
A Profile of 2013 ACT-TesTed high sChool grAduATes
College Choice Report
Part 1
Preferences and Prospects
Focuses on students’ choice and certainty of planned major, Interest-Major Fit, best-fitting major, and selection of major.
Part 2: Enrollment Patterns
A Profile of 2013 ACT-TesTed high sChool grAduATes
College Choice Report
Part 2
Enrollment Patterns
Focuses on college enrollment, consistency of college major choice, persistence within majors, and changes in Interest-Major Fit.
Part 3: Persistence and Transfer
A PROFILE OF 2013 ACT-TESTED HIGH SCHOOL GRADUATES
College Choice Report
Part 3
Persistence and Transfer
Focuses on student persistence within majors between the first and second year of college, changes in Interest-Major Fit among students who changed majors, and the relationship between Interest-Major Fit and student persistence.
The Condition of College & Career Readiness
The Condition of College & Career Readiness 2014
National
Highlights the college and career readiness of the ACT-tested high school class of 2014. This report is updated annually. www.act. org/newsroom/data/2014/
College Choice Report 2014
Part 1: Expanding Opportunities
Expanding Opportunities
A College Choice Report for the Graduating Class of 2014
Part 1: Preferences and Prospects
Focuses on testing behaviors that may expand college opportunities available to students, covering such topics as the grade level in which students test, the timing and number of score reports students send to colleges, and their participation in the ACT Educational Opportunity Service.
In addition to the printed national reports for this series, we are providing interactive charts and maps online that allow you to view and compare information. This interactive format gives you an opportunity to customize
Iowa City, Iowa 52243-0168 Telephone: 319.337.1000