Thomas Chatzopoulos Thomas Fellmann Hans Jensen
Proceedings of the
October 2016 workshop
EU commodity market development:
Medium-term agricultural outlook
2016
This publication is a Conference and Workshop report by the Joint Research Centre (JRC), the European Commission’s in-house science and knowledge service. It aims to provide evidence-based scientific support to the European policymaking process. The scientific output expressed does not imply a policy position of the European Commission. Neither the European Commission nor any person acting on behalf of the Commission is responsible for the use which might be made of this publication.
Contact information
Name: Edificio Expo. c/ Inca Garcilaso, 3. E-41092 Seville (Spain) Address: [email protected] E-mail: +34 954488318 Tel.: +34 954488300 JRC Science Hub https://ec.europa.eu/jrc JRC104101 EUR 28248 EN
PDF ISBN 978-92-79-63969-2 ISSN 1831-9424 doi:10.2791/157002 Luxembourg: Publications Office of the European Union, 2016
© European Union, 2016
Reproduction is authorized provided the source is acknowledged.
How to cite: Chatzopoulos, T., Fellmann, T., Jensen, H. (2016): EU commodity market development: Medium-term agricultural outlook. Proceedings of the October 2016 workshop. JRC Conference and Workshop Reports, European Commission, JRC104101, doi:10.2791/157002.
All images © European Union 2016, except those on cover page: top left © pwollinga - Fotolia.com; top middle (excl. top right with olive oil) © JPchret - Fotolia.com; top middle (only top right with olive oil) © Dušan Zidar - Fotolia.com; top right © helenedevun - Fotolia.com; bottom left © Fabien Faber - Fotolia.com; bottom middle © Beboy - Fotolia.com; bottom right © Željko Radojko - Fotolia.com
Abstract
The workshop on the 'EU commodity market development: Medium-term agricultural outlook' is an integral part of the intensive validation procedure of the results of the European Commission’s report on 'Prospects for EU agricultural markets and income'. It provides a forum for presentations on preliminary 10-year-ahead projections in EU agricultural commodity markets, and discussing in-depth the EU prospects in a global context. This year the workshop was held on October 25-26 in Brussels. The workshop was jointly organized by the Joint Research Centre (JRC) and the Directorate-General for Agriculture and Rural Development (DG AGRI). Participants included policy makers, modelling and market experts from various countries, as well as stakeholders of the agri-food industry. This document summarizes the presentations and discussions on the macroeconomic and energy assumptions associated with this outlook, and on each of the EU agricultural markets addressed (arable crops, biofuels, sugar, fruits/vegetables/olive oil/wine, milk and dairy, meat).
EU commodity market development:
Medium-term agricultural outlook
Proceedings of the October 2016 workshop
Thomas Chatzopoulos, Thomas Fellmann, Hans Jensen
Disclaimer:
The views expressed are those given and presented at the workshop and may not in any circumstances be regarded as stating an official position of the European Commission or
5
Table of contents
Foreword... 7
Acknowledgements ... 8
Workshop agenda ... 10
Abbreviations and acronyms ... 12
1 Introduction ... 13
1.1Agricultural policies at a crossroads - Global challenges and drivers for change: any lessons from the CAP? ... 13
1.2The EU agricultural outlook process ... 14
2 Macroeconomic and energy context ... 16
2.1Preliminary EU outlook, 2016-2026 ... 16
2.2Presentations by invited experts and discussion ... 17
3 Cereals and oilseeds ... 21
3.1Preliminary EU outlook, 2016-2026 ... 21
3.2The uncertain effects of the stockpiling policy reform in China: hard- or soft-landing for maize stocks? ... 22
3.3Presentations by invited experts and discussion ... 23
4 Sugar ... 27
4.1Preliminary EU outlook, 2016-2026 ... 27
4.2Presentations by invited experts and discussion ... 27
5 Biofuels ... 31
5.1Preliminary EU outlook, 2016-2026 ... 31
5.2EU biofuel policy reform: what are the alternatives for biofuel mandates after 2020? ... 32
5.3Presentations by invited experts and discussion ... 33
6 Fruits, vegetables, olive oil and wine ... 35
6.1Preliminary EU outlook, 2016-2026 ... 35
6.2Presentations by invited experts ... 36
7 Milk and dairy ... 38
7.1Preliminary EU outlook, 2016-2026 ... 38
7.2Dairy market development at the MS level ... 39
7.3Presentations by invited experts and discussion ... 40
8 Meat ... 45
8.1Preliminary EU outlook, 2016-2026 ... 45
8.2GHG emission reduction targets in agriculture: how could EU meat markets be affected? ... 46
6
9 Agricultural income, and environment ... 51
9.1Preliminary EU outlook, 2016-2026 ... 51
9.2Environmental analysis of the 2016 baseline... 52
9.3Discussion ... 52
Annex 1: List of participants ... 54
Annex 2: Workshop presentations ... 58
Session: Introduction ... 58
Session: Macroeconomic and energy context ... 61
Session: Crops and oilseeds ... 69
Session: Sugar ... 75
Session: Biofuels ... 81
Session: Fruits, vegetables, olive oil and wine ... 87
Session: Milk and dairy ... 94
Session: Meat ... 102
Session: Agricultural income, and environment ... 112
7
Foreword
The workshop on the ‘EU commodity market development: Medium-term agricultural outlook’ is part of an annual workshop series on market modelling and development1.
The workshop is an integral part of the intensive validation procedure of the results of the European Commission’s report on ‘Prospects for EU agricultural markets and income’. It provides a forum for presentations on preliminary 10-year-ahead projections in EU agricultural commodity markets and for discussing in-depth the EU prospects in a global context.
This report contains a summary of the presentations and subsequent discussions from the 2016 workshop, held on October 25 and 26 at the Museum of Natural Sciences in Brussels, Belgium. The workshop was jointly organized by the Sustainable Resources Directorate (D.4) of the European Commission’s Joint Research Centre (JRC) and the Directorate-General for Agriculture and Rural Development (DG AGRI).
Participants in this year’s workshop included high-level policymakers, modelling and market experts from various countries, stakeholders from the agri-food industry, and representatives from international organizations, such as the Organization for Economic Co-operation and Development (OECD), the Food and Agriculture Organization of the United Nations (FAO), and the World Bank. Special attention was given to the sensitivity of the projections to different settings and assumptions (e.g., uncertainties regarding macroeconomic conditions, specific policies, supply and demand drivers).
Comments made during the workshop have been taken into account to improve the final version of the ‘Prospects for EU agricultural markets and income, 2016-2026’. The final outlook report, previous versions, and background information on the baseline construction and uncertainty analysis are available online:
http://ec.europa.eu/agriculture/markets-and-prices/medium-term-outlook/
8
Acknowledgements
We would like to acknowledge contributions made by all participants (see Annex 1 and 2) and their consent to share their expertise and comments, as well as the JRC staff involved in the organizational arrangements, particularly Leonor Rueda. We thank all contributing and participating colleagues from JRC (Giampiero Genovese, Ignacio Pérez Domínguez, Jesus Barreiro-Hurlé, Simone Pieralli, Silvia Kanadani Campos, Els De Rademaeker, Jean-Michel Terres, Maria Bielza, Maciej Krzysztofowicz) and DG AGRI (Fabien Santini, Tassos Haniotis, Pierluigi Londero, Sophie Hélaine, Koen Dillen, Koen Mondelaers, Benjamin Van Doorslaer). Finally, we thank the following invited external experts who were involved in the chairing of sessions, formal presentations and discussions:
Invited participant Affiliation
Mamoun Amrouk Food and Agriculture Organization of the United Nations (FAO)
Alexander Anton European Dairy Association (EDA)
John Baffes World Bank
Jack Baines European Association of Dairy Trade (Eucolait) Elie Bellevrat International Energy Agency (IEA)
Pablo Bernardos Hernández Spanish Ministry of Agriculture (MAGRAMA) Philippe Binard European Fresh Produce Association (Freshfel)
Richard Brown GIRA
Philippe Chotteau Institut de l'Elevage
Patty Clayton Agriculture and Horticulture Development Board (AHDB)
Christophe Cogny Tallage
Rafael del Rey Observatorio Español del Mercado del Vino (OeMv)
Louisa Follis Bunge
Li Ganqiong Chinese Academy of Agricultural Sciences (CAAS) Stephan Hubertus Gay Organization for Economic Co-operation and
Development (OECD)
Carole Gendron Agriculture and Agri-Food Canada (AAFC)
Roel Jongeneel Wageningen Economic Research, and AGMEMOD Consortium
Ad Klaassen Dutch Produce Association (DPA)
Jaimie Lillo International Olive Council
9
Timothé Masson Confédération Générale de la Betterave (CGB) Holger Matthey Food and Agriculture Organization of the United
Nations (FAO)
Seth Meyer US Department of Agriculture (USDA)
Thordis Möller BayWa AG
Markus Neundörfer Südzucker AG
Arnaud Petit COPA-COGECA
Francis Reid Fonterra
Christian Renault AND International
Matthew Stone PRIMA
10
Workshop agenda
DAY 1 - 25 OCTOBER 2016
08:30 Registration and welcome coffee
9:00 – 9:30
Session 1 Background of the workshop
Welcome and background Tassos Haniotis, DG AGRI
Giampiero Genovese, JRC 9:30 – 11:00
Session 2
Macroeconomic and energy context Chair: Seth Meyer (USDA) (20 min)
(30 min)
(40 min)
Baseline macro and policy assumptions Presentations
Open discussion
Pierluigi Londero, DG AGRI Elisabeth Waelbroeck-Rocha, IHS Elie Bellevrat, IEA
John Baffes, World Bank All participants
11:00 – 11:30 Coffee break
11:30 – 13:00 Session 3
Cereals and oilseeds Chair: Silke Boger (DG AGRI) (20 min) (30 min) (40 min) EU agricultural outlook Presentations Open discussion
Koen Mondelaers, DG AGRI Simone Pieralli, JRC
Louisa Follis, Bunge François Luguenot, InVivo Ganqiong Li, CAAS
All participants
13:00 – 14:00 Networking lunch
14:00 – 15:30 Session 4
Sugar
Chair: Mamoun Amrouk (FAO) (15 min) (30 min) (45 min) EU agricultural outlook Presentations Open discussion
Koen Dillen, DG AGRI
Markus Neundörfer, Südzucker Timothé Masson, CGB All participants 15:30 – 16:00 Coffee break 16:00 – 17:15 Session 5 Biofuels
Chair: Holger Matthey (FAO) (20 min) (20 min) (35 min) EU agricultural outlook Presentations Open discussion
Koen Dillen, DG AGRI
Silvia Kanadani Campos, JRC Christophe Cogny, Tallage Matthew Stone, PRIMA All participants
17:15 – 18:15 Parallel sessions - Detailed discussions on EU prospects
Arable crops (Room A)
Moderator: Arnaud Petit (COPA-COGECA)
Sugar and biofuels (Room B) Moderator: Thordis Möller (BayWa)
18:15 – 18:30 Wrap-up parallel sessions
11
DAY 2 - 26 OCTOBER 2016
08:30 - 09:00 Registration and welcome coffee
Warm-up Maciej Krzysztofowicz (JRC)
9:15 – 10:20 Session 6
Fruit and vegetables, olive oil, wine Chair: Joao Onofre (DG AGRI) (10 min) (30 min) (25 min) EU agricultural markets Presentations Open discussion
Fabien Santini, DG AGRI
Ad Klaassen, Dutch Produce Association Philippe Binard, Freshfel
Jaime Lillo, International Olive Council Rafael del Rey, OeMv
All participants
10:20 – 10:45 Coffee break
10:45 – 12:30
Session 7 Chair: Carole Gendron (AAFC) Milk and dairy markets
(30 min) (30 min) (45 min) EU agricultural outlook MS results Presentations Open discussion
Sophie Hélaine, DG AGRI
Roel Jongeneel, AGMEMOD consortium Jack Baines, Eucolait
Francis Reid, Fonterra Patty Clayton, AHDB All participants
12:30 – 13:30 Networking lunch
13:30 – 15:00 Session 8
Meat markets
Chair: Stephan Hubertus Gay (OECD) (20 min) (30 min) (40 min) EU agricultural outlook Presentations Open discussion
Benjamin Van Doorslaer, DG AGRI Ignacio Pérez Domínguez, JRC
Philippe Chotteau, Institut de l’Elevage Pablo Bernardos Hernández, MAGRAMA Christian Renault, AND International All participants
15:00 – 15:45
Session 9 The outlook in terms of income and environment Chair: Mauro Poinelli (DG AGRI)
(10 min) (10 min) (25 min) Income Environmental effects Open discussion
Koen Mondelaers, DG AGRI Jean-Michel Terres, JRC All participants
15:45 – 16:15 Coffee break
16:15 – 17:30 Parallel sessions - Detailed discussions on EU prospects
16:15 – 17:15 Milk and dairy (Room A)
Moderator: Alexander Anton (EDA)
Meat (Room B)
Moderator: Richard Brown (GIRA)
12
Abbreviations and acronyms
ASEAN Association of Southeast Asian Nations
AWU Annual working unit
CAP Common Agricultural Policy of the EU CO2 Carbon dioxide
cwe Carcass weight equivalent
DDGs Dried distillers grains
DG AGRI Directorate-General for Agriculture and Rural Development
EFA Ecological Focus Area EU European Union
EU-N13 EU member states that joined in 2004 or later
EU-15 EU member states before 2004
EU-28 EU member states (2016)
EUR Euro (currency of the Eurozone)
FAO Food and Agriculture Organization of the United Nations FTA Free-trade agreement
GDP Gross domestic product GHG Greenhouse gas
GMO Genetically modified organism JRC Joint Research Centre
MENA Middle East and North America
MS EU member state
OECD Organization for Economic Co-operation and Development OPEC Organization of the Petroleum Exporting Countries
PO Producer Organization
RED Renewable Energy Directive
RMB Renmibi (currency of the People's Republic of China) SMP Skimmed milk powder
UAA Utilized agricultural area
UK United Kingdom
US United States of America USD US dollar
VCS Voluntary coupled support WMP Whey milk powder
13
1 Introduction
Tassos Haniotis (DG AGRI) and Giampiero Genovese (JRC) set the scene for the workshop by presenting challenges and drivers for the Common Agricultural Policy (CAP) of the EU and providing background information on the EU agricultural outlook and its construction process.
1.1 Agricultural policies at a crossroads - Global challenges and
drivers for change: any lessons from the CAP?
Tassos Haniotis (DG AGRI) highlighted the importance of the agricultural outlook exercise, in particular the annual definition of a baseline and the use of scenarios in answering policy questions. He started his keynote by emphasizing that as a result of dynamically changing commodity markets, the EU agricultural policy faces a number of challenges. He used developments in the EU dairy sector to exemplify this point. After periods of seasonal variability in the farm-gate milk price up to 2007, the EU intervention price decreased and the world price rose. EU and world prices eventually converged, and from that moment the EU market has been characterized by volatility. Co-moving with world prices, EU milk prices reached a peak in 2013-2014 and have displayed a downward trend since then. The latter can be attributed to both internal and external factors, such as the increase in the global and EU milk production, the Russian import ban, and slow growth in Chinese import demand. It is, therefore, a big challenge for the EU agricultural policy to tackle internal issues (e.g., productivity and sustainability) simultaneously with price volatility, trade, and competitiveness issues. In the context of evolving economies around the globe, several developments in the EU agricultural sector can be observed. Examples include the closed price gap between EU and world market prices for wheat and milk, a decreasing price gap for sugar and beef, the turning of agri-food trade deficits into surpluses during the last decade, and the stabilization of EU farm income. These developments are attributable to structural changes in farm costs and revenues.
Mr. Haniotis took the audience through the historical evolution of the CAP reform path in line with policy changes. In the 1980s, CAP spending focused heavily on export subsidies that rose by the end of the decade due to agricultural surpluses. With the MacSharry reform in 1992, market price support was replaced by direct producer support. With the Fischer reform in 2003, most direct payments were decoupled from production as they were based on historical farm receipts. Rural development expenditure continued to rise and market support to decrease with the 2008 Health Check. Although CAP expenditure has stabilized in nominal terms, it has in fact declined as a share of GDP from 0.66% in the 1990s to 0.39% in 2015.
The CAP has evolved considerably in recent decades to support farmers in facing new challenges. The successive CAP reforms of the past mean that EU farmers now better react to price signals and base their production decisions on market demand. Overall, recent reforms shift the policy focus towards (i) a fairer support system for farmers, (ii) risk management, (iii) greener farming practices, and (iv) the promotion of rural development and growth. These challenges will be successfully addressed only with the recognition of the agricultural sector as a multi-service system; agriculture may have a low sectorial weight in the total economy, but it can synergistically address numerous economic, environmental, and social challenges through linkages with other sectors of the economy.
14
1.2 The EU agricultural outlook process
As an introduction to the workshop, Giampiero Genovese (JRC) provided background information on the EU agricultural outlook and its construction process, emphasizing the importance of this workshop in the overall validation process of market projections. Receiving feedback from market experts allows for the development of a realistic starting point for the design and update of EU agriculture and rural development policies. The European Commission has annually published the EU outlook on medium-term agricultural market developments since 2008. In essence, the aim of this outlook is the consolidation of a 10-year-ahead reference timeline for the purpose of counterfactual policy analysis at the EU level. This timeline comprises sets of baseline projections that are derived under assumptions governing macroeconomic factors (e.g., GDP, inflation, oil prices, exchange rates, consumer prices, population growth) and EU and non-EU region-specific policy settings. The baseline assumes normal weather conditions and the absence of production disruptions due to plant and animal diseases, deviations from which can be assessed with scenario analysis.
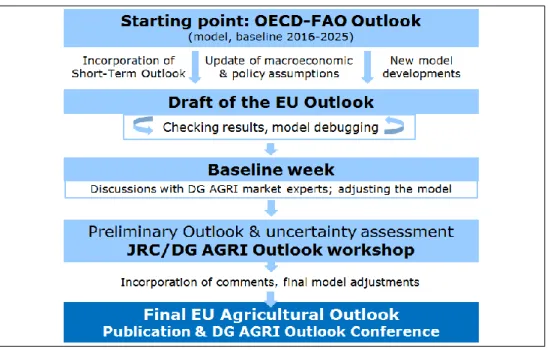
After the publication of the OECD-FAO medium-term outlook on July 4 but before the publication of the EU outlook on December 6, the OECD-FAO outlook is revised and updated by the European Commission in-house (Figure 1). These adjustments pertain to the EU part of the outlook. With a close collaboration between DG AGRI (Agricultural Modelling and Outlook Unit) and JRC (Economics of Agriculture Unit, former AGRILIFE Unit), new model developments and the latest EU agricultural short-term figures are incorporated, macroeconomic factors and oil prices are updated, and further information and feedback from market experts is included into the medium-term baseline. At the core of this process is the so-called baseline week; an intensive technical exercise organized on a yearly basis in early October in Brussels. During the baseline week, JRC and DG AGRI examine and consolidate a preliminary baseline using the Aglink-Cosimo model. This is accomplished with consistency checks, model re-fitting, as well as subsequent feedback from the DG AGRI market units until consensus on the preliminary projections across markets is achieved.
Figure 1: Construction of the EU outlook process
15
The preliminary agricultural market projections are presented in the EU outlook validation workshop, which is documented herein, in late October. Comments made during the outlook workshop are then taken into account to further improve the market projections. The final version of the ‘Prospects for EU agricultural markets and income’ is published and presented in December at the EU Agricultural Outlook Conference in Brussels (this year taking place on December 6 and 7).
The core tool used to generate the medium-term projections is the European Commission's version of Aglink-Cosimo2. Aglink-Cosimo is a recursive, dynamic, partial
equilibrium model for global agricultural commodity markets3. It covers 40 agricultural
commodities and produces annual supply, demand, price, and trade estimates for 44 individual countries and 12 regions. It is developed, maintained, and funded by the OECD and the FAO Secretariats with a defined group of users from national administrations and research institutes in member countries.
The standard version of Aglink-Cosimo facilitates the elicitation of a deterministic baseline that serves as best-guess market developments 10 years ahead. To take into account unequivocal uncertainties that accompany agricultural markets, the EU outlook is supplemented with a partial stochastic analysis module that is maintained at the JRC. This year's workshop presentations included variability ranges in commodity price projections that consider alternative macroeconomic environments, yield levels, and oil prices.
In addition to the partial stochastic analysis, deviations from the baseline are examined with a series of deterministic counterfactual scenarios where assumptions with respect to major drivers of the EU agricultural markets are altered and model variables are shocked exogenously. This year's workshop included presentations of alternative scenarios pertaining to (i) the reform of the maize stockpiling policy in China, (ii) post-2020 alternative EU biofuel policies, and (iii) the effects of agricultural GHG emission targets on EU meat markets. Finally, this year's workshop included presentations with two other partial equilibrium models that focus on the member-state (MS) and regional levels respectively: AGMEMOD (milk and dairy; Section 7) and CAPRI (meat and environmental indicators; Sections 8 and 9).
2 See http://www.agri-outlook.org/abouttheoutlook/
3 See model documentation at
16
2 Macroeconomic and energy context
Macroeconomic factors such as GDP growth, exchange rates, trade agreements, and energy prices are important elements in the generation of the baseline. This year's presentations on macroeconomic and energy projections, given by Pierluigi Londero (DG AGRI), Elisabeth Waelbroeck-Rocha (IHS), Elie Bellevrat (IEA), and John Baffes (World Bank), are documented below.
2.1 Preliminary EU outlook, 2016-2026
In his presentation, Pierluigi Londero (DG AGRI) mentioned the assumptions made regarding trade relationships. The EU outlook assumes that the 2014 Russian ban on imports of agricultural products (incl. pigmeat) will remain in place until the end of 2017, and thus EU exports to Russia will start recovering in 2018. However, since it takes time for markets to re-establish, the actual timing of the temporary ban and scale of EU recovery are uncertain. Furthermore, only ratified free-trade agreements (FTAs) are considered in the baseline.
With regard to the CAP, on the one hand, voluntary coupled support (VCS) is integrated on the basis of MS declarations. The integration of greening measures (i.e., area-based payments owing to beneficial for the environment practices) is more complex. The impacts of the greening requirement for crop diversification are assumed to balance out at the aggregated level, although it is recognized that country-level impacts may differ. Permanent grassland is assumed to remain stable throughout the projection horizon (33% in total arable land), whereas fallow land will decrease from 6.7% (2015) to 6% (2026). The requirements on Ecological Focus Areas (EFAs) are taken into account thanks to increasing planting of catch crops, protein crops, and soybeans.
Figure 2: Oil prices in the EU outlook (2016-2026)
Source: Slides of Pierluigi Londero (DG AGRI)
The sharp drop in oil prices since mid-2014 can be attributed to a slowing world demand, record supply increases (e.g., shale oil from North America), and the decision by the Organization of Petroleum Exporting Countries (OPEC) to leave its production target unchanged. In the EU outlook, projected oil prices rebound faster than the respective OECD-FAO and World Bank figures but slower than what the IHS and IEA conclude. After 2021, it is assumed that oil prices will keep rising, albeit at a lower speed. In nominal
17
terms, oil price per barrel is expected to go up from 44 USD (2016) to about 93 USD (2026), thus underpinning rising commodity prices (Figure 2).
In the current outlook, an appreciation of the EUR/USD exchange rate is expected with a subsequent stabilization at 1.22 USD/EUR by the end of the projection period. GDP growth in the EU is expected to remain stable at 1.6% (EU-15) and 2.8% (EU-N13). China’s economic growth is expected to slow down (6%), whereas Brazil and Russia will likely soon recover from recession and stabilize at 3%, slightly above the projected US economic growth.
World population growth is driven by developing countries and particularly Africa (2.5%). Asia will soon account for nearly half of the world’s population, and India's population may overtake China's over the next decade. The EU population is projected to grow slowly (0.1% p.a.).
2.2 Presentations by invited experts and discussion
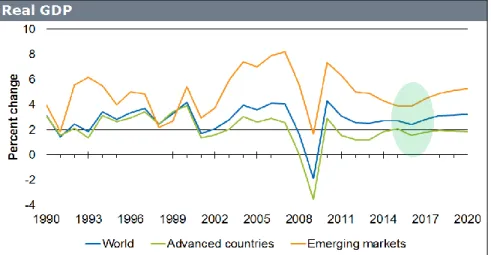
In her presentation, Elisabeth Waelbroeck-Rocha (IHS) laid stress on the fast-evolving macroeconomic environments that complicate projection exercises. While emerging countries were pushing world economic growth to the benefit of advanced economies a few years ago, the picture is now changing: Brazil, Russia, and other emerging economies (e.g., Eastern Europe, Sub-Saharan Africa) show signs of recovery from recession, Asia-Pacific (excl. Japan) approaches remarkable real GDP growth (6% in the medium term), and economic growth in China is slowing down due structural overcapacity and credit imbalances. US economic growth is expected to pick up from 1.5% (2016) to 2.4% (2017), whereas EU growth is assumed first to decelerate (from 1.6% in 2016 to 1.3% in 2017) due to political uncertainties and then recover. This background shapes an expected world GDP growth of 3% p.a. in the coming decade (Figure 3).
Figure 3: Real GDP growth: advanced vs. emerging economies
Source: Slides of Elisabeth Waelbroeck-Rocha (IHS)
With regard to oil, the modest supply deficit of 2016 will be followed by sporadically rising prices and then production recovery, the latter owing to the key producing regions (Russia, Gulf-5, US). Crude oil prices are projected to reach 80 USD per barrel in 2020. Demand will likely keep increasing despite China’s reduced growth. However, it remains to be seen whether upside risks (e.g., unexpected supply disruptions, increasing costs of oil exploration) will prevail over downside risks (e.g., high inventories) and, thus, whether future demand will be accompanied by price increases.
18
According to Elie Bellevrat (IEA), the links between global economic growth, energy demand, and energy-related emissions seem to weaken: main current energy consumers break the historical link between economic growth and energy demand growth (e.g., EU, US, Japan), others are expected to undergo structural changes in their economies (e.g., China), while all adopt more energy-efficient technologies. Clearly, such structural changes will reshape energy markets. With looming energy security and environmental challenges, international cooperation on energy has never been more vital.
China is projected to transit to a more diversified and less carbon-intensive economy, thus slowing energy-related CO2 emissions in the medium term. India's energy demand
is extremely high and is projected to increase over 1 billion tonnes of oil equivalent by 2040, even though demand per capita remains substantially below the world average. The EU is projected to experience a large reduction in demand that amounts to about 200 million tonnes of oil equivalent (2014-2040). Broad-based growth in global natural gas demand is led by China and the Middle East. By 2040, oil and coal will collectively still represent about 50% of the global energy mix but will lose 9% of the market share. The share of renewable energy will grow by 5%, while gas and nuclear shares will increase by 2% each.
Figure 4: Energy related CO2 emissions in a post-COP21 world
Note: The New Policies Scenario takes into account energy-related policies and implementing measures that had been adopted as of mid-2015 together with relevant declared (adopted or not) policy intentions. The 450 Scenario depicts a pathway to the 2°C climate goal that can be achieved by fostering technologies that are close to becoming commercially available.
Source: Slides of Elie Bellevrat (IEA)
Being the largest source of global greenhouse gas (GHG) emissions, the energy sector must play a central role in tackling climate change. However, despite the signs that a low-carbon transition is underway, energy-related CO2 emissions are projected to
increase by 2040 (Figure 4). As a consequence, greater efforts in efficiency, renewables, nuclear power, and other low-carbon technologies would be required to achieve a below-2°C pathway. The build-up of renewable energy capacity, deployment of increasingly efficient end-use technologies, and policy initiatives (e.g., fossil fuel subsidy reform in India) are positive signs towards a greener future for the energy sector.
John Baffes (World Bank) discussed two broad points in his presentation: the energy/non-energy commodity price link and the oil price forecasts. These are summarized below.
19
Previous research suggests that high energy prices lead to an increase in non-energy commodity prices. Based on a time-series analysis (1960-2005) of energy and non-energy prices, Baffes' long-run estimate of the transmission elasticity from non-energy to agricultural commodity prices equals 0.20; that is, a 100% increase in energy prices is associated with a 20% increase in agricultural commodity prices. He argued that this estimate can still be deemed relevant today because the medium term is likely to resemble the prior-2005 world picture in many respects. For example, biofuel production displayed marginal growth over the last decade and is expected to be less important in the medium term, energy prices are characterized by a tendency of co-movement similar to the one before the 2007-2008 global financial crisis, and the 2014-2015 oil price drop shares similarities with the 1985-1986 oil price crisis (e.g., abandonment of price targeting by OPEC).
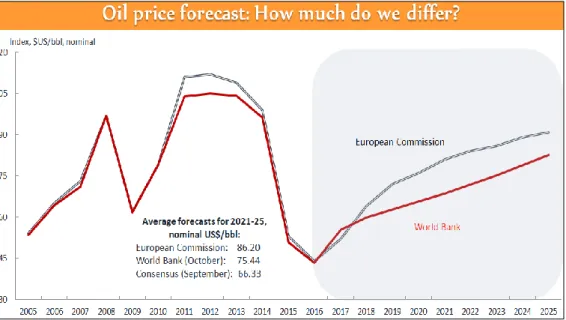
Figure 5: Oil prices in the medium term: World Bank vs. preliminary EU baseline
Source: Slides of John Baffes (World Bank)
Oil prices are expected to average 55 USD per barrel in 2017 thus reflecting OPEC’s intention to limit output. Figure 5 shows the difference between the World Bank and the European Commission projections: while both prices initially increase, they diverge after 2017 with an average difference of 9 USD per barrel. Upside risks to the oil price forecast include supply disruptions among key producers (e.g., Russia, Saudi Arabia, US, China, Canada, Iran, Iraq) and unexpected (further) OPEC production cuts. In contrast, greater-than-expected supply may lower oil prices in the medium term.
Following the presentations, the audience questioned the impacts of a systematic devaluation of the Chinese currency. Ms. Waelbroeck-Rocha argued that a continuous RNB devaluation, albeit uncertain, seems rather unlikely because it would lead to larger capital outflows from China and monetary policy reforms in Asian countries. Exchange-rates simulations performed at the IHS showed that if China devaluated, other Asian countries whose currencies are currently floating would tend to devaluate their currencies in response, thus leading to inflation and trade distortions at least in the short term. Therefore, a scenario of competitive devaluations, however uncertain, is not deemed likely.
Another issue raised by the audience was the treatment of the potential exit of the UK from the EU in the 2016-2026 baseline generation process. Mr. Londero clarified that since Brexit has not taken place, the current EU outlook assumes an EU-28 till 2026.
20
This is not necessarily the case in projections produced by other organizations (e.g., IHS).
The third issue raised was how the amount of methane emissions from oil and gas production compares with that from the dairy sector. Mr. Bellevrat clarified that a special IEA report on this comparison will be released in 2017.
Finally, a participant questioned the treatment of Sustainable Development Goals (SDGs) in the outlook. Mr. Londero clarified that simulations of agricultural, supply, demand, prices, and trade are at the core of the EU agricultural outlook, and thus SDGs are not explicitly modelled.
At the end of the session, participants were asked to answer the following question: ‘The USD/EUR exchange rate currently equals 1.1 (20/10/2016). What will the average exchange rate equal in 2026?’ The responses of 36 participants are shown in the Figure below.
Figure 6: Summary of the participants' answers to the question: ‘The USD/EUR exchange rate currently equals 1.1 (20/10/2016). What will the average exchange rate equal in 2026?’
21
3 Cereals and oilseeds
The global market for arable crops has been marked by consecutive years of record supply that have led to stock replenishment and declining prices. In this context, projections, possible medium-term developments and scenario analyses were presented by Koen Mondelaers (DG AGRI), Simone Pieralli (JRC), Louisa Follis (Bunge), François Luguenot (InVivo), and Li Ganqiong (CAAS).
3.1 Preliminary EU outlook, 2016-2026
Koen Mondelaers (DG AGRI) presented the EU outlook on crop markets. Utilized agricultural area (UAA) in the EU is expected to decrease at a slower pace than in the previous decade, from 177 million hectares (2016) to 173 million hectares (2026). In absolute terms, the largest decrease is projected for arable crops (2 million hectares) whereas in relative terms for fallow land (14%) and oilseeds (9%), the latter being driven by slowing biofuel demand.
Good consecutive harvests over the last few years built up stocks that pushed prices downwards particularly in 2014 and 2015. Prospects for yield growth over the medium term are more modest than in the past. Higher annual yield growth is foreseen for maize (1.5%), which is mainly used as animal feed, while rice is the only crop for which yield is expected to slip back (-0.09%). Harvested area in the EU is generally projected to decline except for soybean (0.2%), common wheat (0.15%), and maize (0.07%).
Figure 7: Cereal prices in the EU outlook (2016-2026)
Source: Slides of Koen Mondelaers (DG AGRI)
Cereal prices are currently depressed. Once the record wheat availabilities are absorbed by the market, EU wheat prices are expected to recover faster than the prices of other cereals, clearing at about 172 EUR per tonne in 2026. Barley may suffer a lower demand growth which is, nevertheless, expected to pick up at the end of the projection horizon (Figure 7).
Oil meals will become relatively more important in the EU oilseed complex as domestic meat production is increasing. As a result, soymeal imports will go up by about 3 million tonnes. Given that soybean areas have been granted VCS in several MS and are eligible
22
for EFA measures, they are expected to stabilize at the expense of rapeseed, which will likely undergo negative area growth.
Oilseed prices are assumed to recover in the medium term mainly due to increasing production costs. A positive difference is expected between the domestic price and the import price of soybean because EU production is free of Genetically Modified Organisms (GMOs). Protein crops are likely to benefit from a dynamic demand for animal feed, VCS, and the eligibility under EFAs. At the end of the projection period, field peas and beans will reach an all-time area peak (over 1.8 million hectares).
3.2 The uncertain effects of the stockpiling policy reform in China:
hard- or soft-landing for maize stocks?
Simone Pieralli (JRC) presented a scenario analysis with regarding the Chinese maize stockpiling policy. China has become a big importer of maize in the global market in recent years. In light of supply-side reforms that were implemented on October 1, 2016, China is facing growing pressure to reduce maize inventories and domestic support prices. Maize in China is mainly used for feed (60%), but other coarse grains are also imported for this purpose {e.g., barley, sorghum, cassava, distilled dried grains (DDGs)}.
The EU outlook predicts a smooth decrease of Chinese maize stocks. Two counterfactual scenarios of faster stock decrease down to 48 million tonnes4 were presented in this
analysis: a soft-landing scenario, where maize stocks decrease linearly till 2020, and a hard-landing scenario, where stocks decrease abruptly in 2017 (Figure 8).
In the soft-landing scenario, net trade is consistently negative across years, albeit less negative than in the baseline up to 2020. The Chinese maize price is expected to decline by 10%. EU net trade of maize is positive over the first years.
Figure 8: Projected net trade in China: EU baseline vs. maize destocking
Source: Slides of Simone Pieralli, Silvia Kanadani Campos and Ignacio Pérez Domínguez (JRC)
In the hard-landing scenario, there are notable changes. In 2017, China will become a net exporter of maize, with domestic prices decreasing by 51%, world prices dropping by 4%, and world prices of substitutes declining by 3% (barley) and 7% (DDGs). Chinese
4 In consultation with experts, this stock size was selected to be prepared for any short-term food
23
prices of maize substitutes are projected to decrease more than world prices (5% for barley, 11% for DDGs), whereas EU prices decline modestly (2% for barley, 5% for DDGs). In general, EU trade effects are limited due to the activation of the maize import duty.
Given that maize becomes less competitive, there is an increase in the soybean area up to 4% compared with the EU baseline in 2017 under the hard-landing scenario. As no major changes in yields are evidenced, maize production in the projection period changes proportionally to area.
Overall, soft-landing of Chinese maize stocks would have a less disruptive but more prolonged markets effects than a hard-landing scenario. Given the latter, however, China could return as a (temporary) net exporter of maize. Finally, the short-term price effects on maize substitutes should not be neglected.
3.3 Presentations by invited experts and discussion
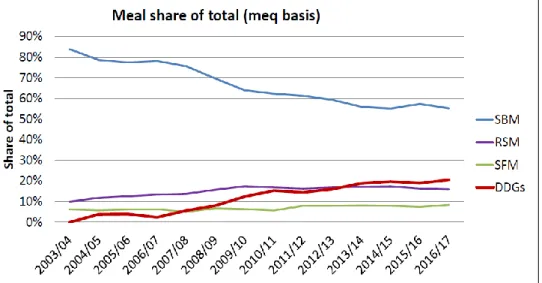
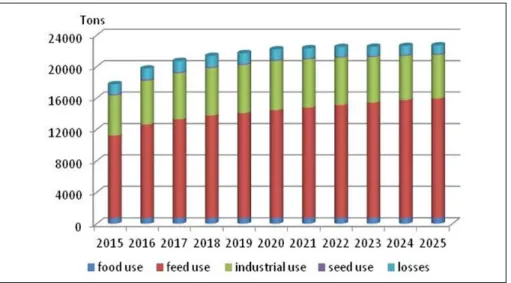
According to Louisa Follis (Bunge), whose presentation was based on early-2016 information, overall consumption volumes of wheat, maize, and barley are fairly stable in the EU. The feed demand indicates growth particularly with regard to corn-based DDGs, as a by-product of energy and biofuel policies. Soybean meals remain by far the main source of protein in the feed sector (Figure 9).
Figure 9: EU protein demand
Note: Estimates are based on early-2016 prices Source: Slides of Louisa Follis (Bunge)
The Bunge estimates suggest a modest supply growth in 2026 compared with the 2012-2015 average (about 5% for wheat, about 15% for maize, and about 10% for sunflower seed and rapeseed). Yield and area changes are also expected to be fairly small. Wheat shows little change in acreage and yield with the exception of the Danube region. Maize shows a notable increase of about 10% in yield but simultaneously a small area decrease. Sunflower seed and rapeseed show yield gains of about 15% and small area reductions.
Other parts of the world with big growth and high expected output are Eastern Europe and South America. In particular, wheat production is expected to rise in Ukraine and Russia, whereas corn and soybean production is expected to increase in Argentina and
24
Brazil. The Bunge projections generally foresee higher maize imports into the EU (driven by feed demand) and lower wheat exports compared with the EU figures.
In his speech, François Luguenot (InVivo) highlighted the main drivers of oilseed production: domestic policies, trade policies, and agronomy. The initial purpose of using oilseeds in the EU was as high-protein supplements in livestock production; however, they ended up being driven by the EU biofuels policy (e.g., rapeseed and biodiesel production), whose medium- and long-term future seems questionable by many. Trade policy is important considering the China-US example: driven by rapid economic growth, the Chinese demand has absorbed over 50% of the US soybean exports over the last years driving an expansion of US soybean production. Third, Mr. Luguenot believes that oilseed production does not have a bright future in the EU because it cannot compete with domestic wheat, barley, and maize yields. The picture may be reversed, however, in regions where the yield gap between cereals and oilseeds can be minimized (e.g., Black Sea).
In presenting the main developments on crop markets from the Chinese perspective, Li Ganqiong (CAAS) briefly discussed the macroeconomic environment underlying the Chinese outlook. With an annual GDP growth rate of 6.2% over the next decade, which is about 35% lower than the rate of the previous decade, the Chinese economy will stabilize at 6% by 2025. The total population in China will continue to grow by 0.3% p.a., reaching an estimated 1.42 billion people by 2026. Urbanization will accelerate, and urban population will account for about 60% of the total. As a consequence, agricultural labour force will slightly decrease. The consumer price index will reach 3% by 2025, while RMB exchange rates will stabilize with a slight depreciation.
Against this background, supply and demand for rice and wheat will maintain a basic balance due to governmental legislation on grain security. While rice and wheat growing areas will keep decreasing by 0.3% and 0.1% p.a. respectively, yields are expected to keep improving by up to 0.3%. The undergoing supply-side reform is expected to reduce the sown area of maize (1.8% p.a.) in the next 5 years, oilseed production will recover, and oilseed imports will decrease. Overall, Mr. Li argued that the decreasing maize production and increasing soybean production in China will have limited impacts on the EU cereals and oilseed markets because trade between China and EU boils down mainly to horticultural, meat, and dairy commodities.
Figure 10: Projected maize consumption in China (Chinese outlook, 2016-2025)
Source: Slides of Li Ganqiong (CAAS)
In the next decade, China will pay more attention to the balanced use of domestic and international resources and markets. The resource-intensive imports of oilseeds, fruits,
25
meats, and dairy products will expand from the traditional Americas, Australia, and Southeast Asia to Central Asia and the EU.
Following the presentations, questions were raised on the role of crop rotation in the baseline. Crop rotation is important to retain soil organic carbon levels and to make soil more responsive to fertilizer application. Mr. Mondelaers clarified that crop rotation is not taken explicitly into account in the EU outlook due to the global (vs. farm-level) nature of the Aglink-Cosimo model.
Another question raised by the audience was whether, following the liberalization of the EU sugar market, land competition between cereals and sugar beet is taken into account. Mr. Mondelaers explained that area substitution is explicitly modelled, and the area devoted to sugar production is indeed reduced post-quota. Overall, EU crop area allocation in Aglink-Cosimo is driven by the competitiveness of each crop relative to soft wheat.
An issue concurrently discussed was the contribution of extreme weather to yield fluctuation and price volatility. Participants recognized that yield fluctuation due to uncontrollable weather conditions may affect crop production in either direction, possibly even to a greater extent than energy prices or exchange rates. Therefore, projected crop supply and prices should ideally include abrupt changes. The 2003 European heat wave, for example, had a tremendous impact on wheat and maize production in some MS (e.g., France), thus increasing significantly commodity prices in the EU. In essence, extreme weather impacts can be coarsely examined with scenario analysis and through the partial stochastic module. With scenario analysis, yields are typically shocked exogenously and arbitrarily, whereas stochastic analysis allows for random yield variation to be taken into account but without identifying the impacts of extreme weather. In essence, the absence of weather variables from the supply core system of a deterministic economic model leaves weather impacts out of the baseline. Mr. Pieralli explained that ongoing work at JRC will allow us to better investigate the possible impacts of extreme weather events on agricultural markets.
Overall, it was mentioned that it is important to look at prices at the time of planting and harvest. Grain prices may fluctuate all year along but they do so particularly in the beginning and end of the growing season, when supply expectations are heavily dependent on growing conditions. Aglink-Cosimo does not include seasonal price fluctuations; instead, current and lagged prices along with their elasticities drive the supply system.
Finally, the future use of fertilizers in crop production was raised. The projections do not explicitly model fertilizer application, but fertilizer costs are accounted for through the use of a production cost index. The participants agreed that the future use of fertilizers will depend on political decisions and the fertilizer industry.
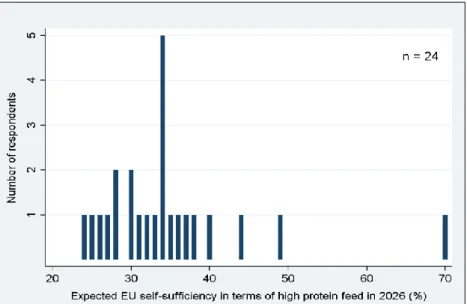
At the end of the session, participants were asked to answer the following question: ‘EU self-sufficiency in terms of high protein feed currently reaches 33% (expressed in protein content). What will this level be in the coming decade?’ The responses of 24 participants are shown in the Figure below.
26
Figure 11: Summary of the participants' answers to the question: ‘EU self-sufficiency in terms of high protein feed currently reaches 33% (expressed in protein content). What will this level be in the coming decade?’
27
4 Sugar
The EU sugar market is entering a transition period due to the impending expiry of sugar quotas in 2017. The EU projections and possible developments beyond the quota abolition were addressed by Koen Dillen (DG AGRI), Markus Neundörfer (Südzucker), and Timothé Masson (CGB).
4.1 Preliminary EU outlook, 2016-2026
According to Koen Dillen (DG AGRI), strong prices during 2015 and 2016 are driven by a structural shortage in the EU production that has reversed the secular oversupply and stock levels prior to 2015. Against this situation, and the EU price being below than the world price since May 2016, the EU sugar industry is in a position to compete for market shares thanks to longer campaigns and storing and trading capacities. EU sugar production is expected to increase. The abolition of sugar quotas (2017) will happen in a moment where farmers have incentives to continue producing due to low commodity prices for alternative crops, depreciated specialized machinery, and widespread VCS. Moreover, farmers will be willing to sign long-term contracts to ensure the product is rolled out. Sugar prices will follow world prices and will clear at 400 EUR per tonne in 2026, slightly above the world price.
Figure 12: Sugar prices (EUR/tonne) in the EU outlook (2016-2026)
Source: Slides of Koen Dillen (DG AGRI)
Per capita consumption is expected to decrease as the share of isoglucose (i.e., corn-based sweetener) is projected to escalate to unprecedented consumptions levels (9%) following the expiration of the corresponding quota. This will lead to a situation where the EU becomes a net exporter of sugar as the World Trade Organization (WTO) export limits are phasing out.
4.2 Presentations by invited experts and discussion
In the beginning of his presentation, Markus Neundörfer (Südzucker) highlighted the sustainable but also dynamic nature of the sugar sector. Within the existing regulatory framework, the EU sugar industry has managed to steadily increase its productivity in
28
terms of yield (2.5% p.a.) and production per factory (5% p.a.). For the past 50 years, the regime of quotas and minimum beet prices has secured stable sugar supply from growers and factories to consumers at reasonable prices. The EU and the OECD-FAO foresee that, in the long run, EU sugar production and exports will slightly go up with domestic prices remaining above world prices.
Figure 13: Future world sugar demand
Source: Slides of Markus Neundörfer (Südzucker)
Mr. Neundörfer argued that another scenario pertains to world prices exceeding domestic prices (as it observed recently). In that case, projected imports (exports) based on the current outlook would be overestimated (underestimated). Therefore, the possibility of the EU facing a deficit due to the rising attractiveness of exports (or unattractiveness of imports) should not be neglected. This is to be seen in a context where only a few players seem to have the potential to raise production to cope with the increasing world demand. Former excess demand used to be covered by cane sugar mainly from Brazil. Brazil is a particular case where production costs may exceed world market prices for sugar but, owing to various governmental support measures, the country sets de facto the world price for this commodity. Therefore, Mr. Neundörfer pointed out that a close monitoring of the individual sugar politics in the world is a key topic for policymakers and market participants to provide a level playing field in the future.
Timothé Masson (CGB) began his presentation with remarks on the EU outlook. He expressed doubts regarding the assumptions on the Brazilian Real/USD exchange rate, which drives world prices. Furthermore, he noted that more studies are needed on the drivers of declining sugar consumption in the EU (e.g. sugar for direct consumption, soda, bakery, green chemistry, etc.). He also pointed out that there is still uncertainty regarding the medium-term future of biofuel policies and FTAs. Finally, Brexit would lead to significantly increased imports because the UK owns 25% of the sugar refining capacity of the EU.
Sugar beet yield has increased by 2.4% p.a. during the last decades. Due to regional climate change –mainly realized as warmer springs and summers–, sugar yields have doubled over the last 25 years. The role of genetic engineering is also crucial. Nowadays, seeds account for at least one-third of the variable costs, and low sugar beet prices may lead farmers to reduce these costs, thus impacting yields. Regulating plant protection
29
products (e.g., neonicotinoids, endocrine disruptors) would increase further production costs. Sugar beet prices are dependent on the sugar. Currently in France, for instance, a sugar price at 404 EUR per tonne represents a sugar beet price of 25.4 EUR per tonne. In order to maintain production at current levels, a sugar price between 450 EUR and 500 EUR would have to be realized, whereas a price beyond 500 EUR per tonne would be a prerequisite for production expansion. Overall, it is very difficult for farmers to remain on the market with prices below 400 EUR per tonne. Mr. Masson concluded his presentation by mentioning that the persistence of the sugar sector will depend on how sugar factories and growers handle risk management.
Following the presentations, participants expanded on Mr. Masson's comment regarding the lack of data on production costs at the MS level. It was pointed out that the unavailability of such data may render the outlook exercise substantially more difficult. Having said that, several publications hint at the location of inefficient factories, and hence we can expect where production will most likely decline post-quota.
Liberalization of the EU market is expected to lead to a stronger integration with the world sugar market and induce greater price volatility. Given the deregulation of the domestic market, participants mentioned the need to implement a safety net to protect farmers from income losses and enable sugar production in the EU to be maintained. Doubts were raised about the projected net exporting position of the EU in a situation with lower world prices. Mr. Dillen clarified that since the average nature of figures masks variation at more disaggregated levels, not all EU producers will be competitive at world prices. Another participant mentioned that, owing to the production of high-quality sugar, the EU may be able to export sugar even if domestic prices are high.
The end of the quota regime will add volatility to the market and change the fundamentals of the price ratio of sugar beet to sugar. However, it was recognized that due to the fact that sugar beet prices originate from accounting data on sugar prices (i.e., the sugar beet price is not model-based), quantifying sugar beet price volatility is not an easy task.
Some participants highlighted the role of investment funds in determining the current situation of high world prices. In general, investment funds affect to a greater extent short-term outcomes than medium-term outcomes. Future investments in capacity in the sugar industry are observed in Thailand and India but not so much in Brazil. Assuming that banks will not be willing to provide credits, Brazil will likely invest in existing infrastructure that will allow for the production of more sugar (instead of more ethanol).
Considering a world price of around 14 cents per pound, it was argued that it would be very difficult for the EU to compete against Brazil on world markets. However, with investment mainly going to the most efficient sugar refineries and given favourable prices, the picture may change and the EU may be able to fill production gaps on the global market over the next decade.
At the end of the session, it was clarified that the different uses of sugar (e.g., processed food or beverages) are not differentiated in the EU outlook. Therefore, only white sugar that is used domestically or exported is considered. Furthermore, differences between this and last year’s projections (e.g., higher sugar exports in the current outlook) boil down to the assumptions made on the price gap between the EU and world markets; that is, large price differences lead to imports, and small price differences do not exclude exports. Compared with 2015, the price difference between the EU and the world markets is reduced. This reduction is driven by macroeconomic assumptions within the OECD-FAO outlook (e.g., depreciation of the Brazilian Real).
Participants were asked to answer the following question: ‘At a world price of 360 EUR per tonne, how much sugar (in million tonnes) will the EU export in 2020?’ The responses of 25 participants are summarized in the Figure below.
30
Figure 14: Summary of the participants' answers to the question: ‘At a world price of 360 EUR per tonne, how much sugar (in million tonnes) will the EU export in 2020?’
31
5 Biofuels
The development of the biofuel market in the EU is relatively recent. It emerged in the early 2000s in order to comply with biofuel consumption mandates defined by EU legislation. The mandates will likely remain a driving force of this market until 2020. The post-2020 period is more uncertain in the absence of clarity on future targets. Against this background, the discussants tried to disentangle the likely medium-term impacts from a policy perspective.
5.1 Preliminary EU outlook, 2016-2026
In presenting the prospects for EU biofuel markets, Koen Dillen (DG AGRI) argued that the current rate of increase in domestic biofuel consumption will not be sufficient to fulfil the mandate of the Renewable Energy Directive (RED) by 2020. Therefore, the baseline scenario assumes a rising consumption of biofuels in the next 4 years, capped at 6.5% of the energy used in transport by 2020 (status quo with respect to the previous outlook).
Accordingly, the share of fuel attributed to first-generation biofuels will be limited to 4.4%, which is far below the recently established EU-level threshold (7%). After 2020, total domestic use of diesel and gasoline is expected to further decrease owing to legislation on energy efficiency in the transport sector. However, much is unknown about the biofuel policy context. Thus, the baseline scenario assumes that EU consumption will remain stable in terms of the share of total energy used for transport after 2020 (Figure 15).
Figure 15: Assumed share of biofuels in EU transport energy
Source: Slides of Koen Dillen (DG AGRI)
Over the 2016-2026 period, the rising ethanol consumption will translate into an intensified use of maize for biofuels. The higher price of raw materials after the quota abolition is expected to trigger a decrease in the share of sugar beet used for ethanol production.
Compared to other biofuel markets, biodiesel (especially from domestic rapeseed) dominates the EU market. The initial increase in biodiesel consumption over the
32
projection period will be principally sourced from non-agricultural sources, particularly waste oils and second-generation biodiesel.
5.2 EU biofuel policy reform: what are the alternatives for biofuel
mandates after 2020?
Biofuels production in the EU has been promoted since the early 2000s based on the Renewable Energy and the Fuel Quality Directives. A part of this legislation gives biofuels a tax exemption and includes mandates ensuring that biofuels should make up at least a fixed share of total annual sales of fuel. In an alternative scenario, the EU biofuel mandates after 2020 are envisaged to be removed and the tax exemption lifted.
According to Silvia Kanadani Campos (JRC), removal of the mandates would lower the volume share of biodiesel in diesel from 7% to about 4.5%. Lifting the tax exemption at the same time would reduce the biodiesel content to 4%. Similarly in the case of ethanol, the initial volume share of 6% would decline to 5% if mandates were removed and to 4.5% if taxes were reintroduced. This would reduce domestic production (consumption) of biodiesel by 33% to 39% (34% to 40%) with smaller reductions in ethanol production (Figure 16).
Figure 16: Production and consumption impacts for biodiesel and ethanol
Note: NBM is the 'no biofuel mandate' scenario, and NBP is the 'no biofuel mandate and no biofuel tax exemption' scenario.
Source: Slides of Silvia Kanadani Campos (JRC), Ignacio Pérez Domínguez (JRC), Simone Pieralli (JRC), and Koen Dillen (DG AGRI)
The lower production is caused by a decline in biofuel prices when the mandates and tax exemptions are removed, as the biofuel price has to adjust to the relative fossil fuel price. Biodiesel prices decline by 25% to 30% in the EU, and this decline is transmitted to the vegetable oil sector where prices decline by 15% to 20%. Domestic rapeseed production is expected to decline by 2.5% to 3%. World market prices of biodiesel decline by roughly 2% while vegetable oil prices drop by about 4%. On the ethanol market the 3% to 7% reduction in production represents a price reduction of 12% to 22% in the EU where the abolition of the tax exemption has a relatively larger impact than in the biodiesel industry. The reduced ethanol price has no major influence on the prices or production of feedstock (maize, coarse grains, wheat, sugar beet).
33
5.3 Presentations by invited experts and discussion
Christophe Cogny (Tallage) believes that the EU biofuel mandate post 2020 is unlikely to be agreed upon at the MS level in the absence of a common goal. National policies prevail with some countries keeping their incentive laws in place. For example, Germany sets its own rulebook towards GHG savings, France sticks to the 7% incorporation target, and Spain should increase mandates moderately (up to 8.5% by 2020). Therefore, the EU biofuel market will likely keep increasing over time (Figure 17). The consequences of low crude oil prices in Germany, for example, resulted in a lower biodiesel share than diesel share (5.4% in 2015 to 5.1% 2016), but higher diesel consumption this year (7%) mitigated the lower share. The higher biodiesel consumption relies on changes in the legal framework with Germany increasing its GHG savings to 4% from 2017.
Figure 17: Tentative medium-term projections of biofuel consumption
Source: Slides of Christophe Cogny (Tallage)
According to Matthew Stone (PRIMA), the signals sent by the European Commission about the post-2020 period could indicate that the biodiesel sector is going to have the biggest fallout in terms of lost demand and declining production. He pointed out that the EU baseline assumes steady oilseed/vegetable oil demand through 2026 as a biodiesel input. He questioned this assumption given that the post-2020 period is more uncertain in the absence of clarity on future targets.
Mr. Stone also stated that countries are stimulating increased demand for biodiesel as we move towards 2020. For example, Germany is moving towards a 4% GHG reduction next year increasing to a 6% by 2020. This would increase the German biodiesel demand moving forward to 2020. He pointed out that in the post-2020 period, the EU transportation policy has huge CO2 reduction ambitions taking Germany as an example
with a 20% GHG cut in 2030 (Figure 18). A large proportion of this target (12%) is expected to be achieved through reductions in carbon use and increased vehicle efficiency, leaving 6% to 8% cuts to be made by other means. It is questionable how this target will be met if support to first generation biofuel production is removed.
Mr. Stone also pointed out that crop-based biofuels can supply up to 7% of road fuel with GHG savings exceeding 60%, however, with no post-2020 support. He then emphasized that there is only one viable advanced biofuel available, waste oils, which could replace crop-based biofuels in the medium term. However, policy developments in other parts of the world will potentially also impact EU advanced biofuel supply as, for example, aggressive low-carbon mandates in North America would likely impact the availability of wastes assumed in the EU projections towards carbon reduction targets.
Consumption (Mtoe) 2005
Gasoline 115,2
Bioethanol 0,5
Bioethanol content in gasoline 0,5%
Diesel 183,2
Biodiesel 2,3
Biodiesel content in diesel 1,2%
Biofuels content in fossil fuels 0,9%
2010 97,4 2,7 2,8% 206,4 10,4 5,0% 4,3% 2015 83,3 2,8 3,3% 212,5 10,4 4,9% 4,4% 2020 2021 2022 81,0 79,7 79,3 3,3 3,3 3,3 4,0% 4,1% 4,1% 217,9 218,6 219,2 11,6 11,6 11,7 5,3% 5,3% 5,3% 5,0% 5,0% 5,0%
34
Figure 18: Post-2020 CO2 ambitions in transport
Source: Slides of Matthew Stone (PRIMA)
Following the presentations, the audience pointed out that the EU baseline projects stable biodiesel production but feedstock changing considerably. Imports of palm oil are expected to slightly increase while EU rapeseed production is reduced. Mr. Dillen argued that there was no major expected change in feedstocks, but when countries are moving to GHG mandates the use of palm oil gives higher GHG savings.
With regard to the EU biofuel reform scenarios, it was questioned whether rapeseed production could be viable in the absence of a biofuel mandate. Some participants expressed their doubts about the development of second generation biofuels.
At the end of the session, participants were asked to answer the following question: ‘The EU biofuel share in the transport mix is 5.5% in 2016 (incl. RED). How much will it be in 2020?’ The responses of 23 participants are shown in the Figure below.
Figure 19: Summary of the participants' answers to the question: ‘The EU biofuel share in the transport mix is 5.5% in 2016 (incl. RED). How much will it be in 2020?’
35
6 Fruits, vegetables, olive oil and wine
Fruits, vegetables, and permanent crops comprise a new addition to the EU agricultural outlook. The most notable difficulty in developing a robust market outlook for fruits, vegetables, olive oil, and wine pertains to the lack of relevant and comprehensive country-level data. Consequently, the analysis provided in this outlook does not rely on modelling tools but on trend analysis and experts’ opinion.
6.1 Preliminary EU outlook, 2016-2026
According to Fabien Santini (DG AGRI), olive oil groves are expected to increase in Spain and Portugal. Annual production follows an upward moving trend in Spain and Portugal, remains stable in Greece, and is slightly declining in Italy (Figure 20). Adverse weather conditions from 2012 to 2014 period have led to a drop in harvested quantities and higher prices. In conjunction with the economic crisis, this has resulted in decreasing per capita consumption in producing MS. On the other hand, consumption follows an increasing trend in the rest of the EU and the world. Exports are generally expected to rise, but some competition with third countries is also foreseen.
Figure 20: Production of olive oil in the EU
Source: Slides of Fabien Santini (DG AGRI)
With regard to wine, a slight decline in production and consumption is expected resulting in an increase of net exports. Even with stable production prospects, European wine production may vary from year to year due to seasonal weather fluctuation and unfavourable sanitary conditions.
Increasing supply is expected with regard to apples, particularly due to increasing production in Poland. This coincides with a reduction in the consumption of fresh apples thus leading to increased processing and a stronger net exporting position. The quantity of fresh tomatoes produced and consumed is projected to slightly decrease in the EU, with a stable net importing situation.
36
6.2 Presentations by invited experts
Philippe Binard's (Freshfel) presentation focused on the main factors that determine the development of a market outlook for fruits and vegetables. Fruit and vegetable prices are shaped by multiple factors such as production volume, weather, packaging, freshness, quality, size, certification, and destination, which are difficult to analyse simultaneously. In addition to that, given the diversity and perishability of fresh products, market reports are usually conducted with a considerable time lag. MS data are often incomplete and difficult to access, and official data sources such as Eurostat and FAOSTAT need up to two years to collect and report the relevant market information. Therefore, analysts would have to rely on generic online consultation databases or product-specific seasonal trade reports.
Ad Klaassen (Dutch Produce Association, DPA) presented some interesting facts on tomatoes. He stressed the fact that nowadays many more tomato varieties are offered to the consumer than in the past. This, in conjunction with high price variability due to weather fluctuation, has gr