Claremont Colleges
Scholarship @ Claremont
Scripps Senior Theses
Scripps Student Scholarship
2015
Price, Perceived Value and Customer Satisfaction:
A Text-Based Econometric Analysis of Yelp!
Reviews
Eleanor A. Dwyer
Scripps CollegeRecommended Citation
Dwyer, Eleanor A., "Price, Perceived Value and Customer Satisfaction: A Text-Based Econometric Analysis of Yelp! Reviews" (2015). Scripps Senior Theses.Paper 715.
Price, Perceived Value and Customer
Satisfaction: A Text-Based Econometric
Analysis of Yelp! Reviews
Eleanor A. Dwyer
Kerry Odell, Advisor
Christopher Towse, Advisor
Roberto Pedace, Reader
Winston Ou, Reader
Copyright c�2015 Eleanor A. Dwyer.
The author grants Scripps College and the Claremont Colleges Library the nonex-clusive right to make this work available for noncommercial, educational pur-poses, provided that this copyright statement appears on the reproduced materials and notice is given that the copying is by permission of the author. To disseminate otherwise or to republish requires written permission from the author.
Abstract
We examine the antecedents of customer satisfaction in the restaurant sec-tor, paying particular attention to perceived value and price level. Using Latent Dirichlet Allocation, we extract latent topics from the text of Yelp! reviews, then analyze the relationship between these topics and satisfac-tion, measured as the difference between review rating and user average review rating.
Acknowledgments
First, I would like to thank my readers, Professor Pedace and Winston Chei-Wei Ou, for bearing with me through this process. Professor Ou was thefirst to suggest that I attempt a machine-learning thesis, and that
sug-gestion initiated a fantastic journey of discovery.
I also extend my deep gratitude to my parents, Mark Joseph Dwyer and Marion Rupp Dwyer, who have nurtured and supported me in all aspects of life, and without whom I would not be attending Scripps. I hold you both dearly in my heart and my mind as I finish my time at Scripps and
embark upon my journey into real life.
Finally, I thank Corey Hayes. Your constant encouragement, freely-given tech support, and continued interest in myfindings (feigned or not)
Contents
0.1 Introduction . . . 2 0.2 Literature Review . . . 3 0.3 Model Selection . . . 13 0.4 Methodology . . . 17 0.5 Results . . . 21 0.6 Conclusion . . . 300.1
Introduction
Imagine yourself, content and perhaps a bit over-full, basking in the afterglow of a lovely meal at a local restaurant. Then, the extravagant bill arrives. Does this high cost reenforce your belief that this meal was valuable and thereby improve your recollection of it? Or does the cost of the meal overshadow your enjoyment of it and leave you wishing you had chosen a simple meal at a bet-ter price point? For that matbet-ter, what features must an expensive restaurant provide you over a bargain one to justify the extra cost? In this thesis we hope to examine questions like these and determine the effect of restaurant price on customer satisfaction by performing text-based analysis of Yelp restaurant re-views in several U.S. cities.
In order to distill the reviews into more informative data, we will use a Latent Dirichlet Allocation (LDA) model to classify each review word’s likely topic (eg. food, service, price, ambience, anecdotes, miscellaneous). Then, using linear regression, we will reveal the topics that most inform customer satisfac-tion (defined as the difference between a review’s star rating and the reviewer’s average star rating), and examine how the factors that influence customer sat-isfaction differ across restaurant price levels.
Both theory and research suggest that perceived value (perceived
bene-fits relative to perceived costs) should have an effect on costumer satisfaction. But because perceived value is such a tricky parameter to measure, marketers, restauranteurs and economists often overlook it, instead focusing on objective restaurant price and quality’s effect on customer satisfaction. Thus, with access to the actual text of Yelp reviews written by customers, we have a somewhat novel opportunity to evaluate how subjective perceptions of restaurant value combined with actual restaurant price inform customer satisfaction. Moreover, because customer satisfaction and perceived value are such inherently
subjec-tive matters, a machine-learning approach is particularly suited to this task. Traditional data analysis methods would have explicitly selected key words to represent expected satisfaction-influencing factors, and survey methods would have explicitly selected attributes to inquire about. By using LDA to extract factor keywords, we hope to more accurately capture reviewers’ subjective ex-pression of their experiences in our analysis.
0.2
Literature Review
Traditional economic thought revolves around the downward-sloping de-mand curve. Ceteris paribus we tend to assume that inexpensive goods are always preferable to apparently similar expensive goods. A buyer’s willingness to pay for any of a set of comparable goods is thought to be fixed; thus, the larger the gap between price willing to pay and price paid, the larger the con-sumer surplus and the greater the concon-sumer’s satisfaction. However, price may serve as an indicator of quality, leading customers to subjectively evaluate more expensive products as superior and thus, preferable. Both theory and empirical evidence fromfields such as behavioral economics, psychology, psychophysiology, and marketing suggest that there is a more complicated relationship between price and costumer satisfaction than itfirst would seem.
The most salient theory we must consider is that of price-dependent pref-erences, which suggests that preferences are influenced by price even outside of the budget constraint. Pollak (1977) provides a survey of the price-dependent preference literature and also constructs demand models predicated on price-dependent preferences. According to Pollak, the snob hypothesis that high prices might be attractive to snobbish consumers was popularized by Thorstein Veblen (1899). Veblen suggested that more expensive objects carry added value
due to the social status that their purchase conveys, and particularly focused on Veblen goods: luxury goods whose demand is proportional to their price. If expensive restaurant meals are Veblen goods, then “snobbish” customers might prefer expensive dinners simply because they enjoy the social status their pur-chase conveys. Scitovsky (1951) extended this idea beyond luxury items, theo-rizing that because consumers are not experts on the goods they purchase they rely on price to indicate quality. While market prices are the prices customers consider in their budget constraint, Pollak definesnormal prices as the subjec-tively perceived prices which influence preferences. The author suggests a nor-mal price function that constructs nornor-mal prices from a combination of current and past prices. Thus, normal prices are relative to the prices of other goods, and money illusion does not impact price-dependent preferences. Moreover, Pollack outlines several demand functions incorporating nominal price, demon-strating that it is possible to incorporate this theory and preserve conventional demand function traits. Scitovsky’s theory suggests that inexpert restaurant customers’ expectations about food quality will be shaped by the restaurant’s normal price.
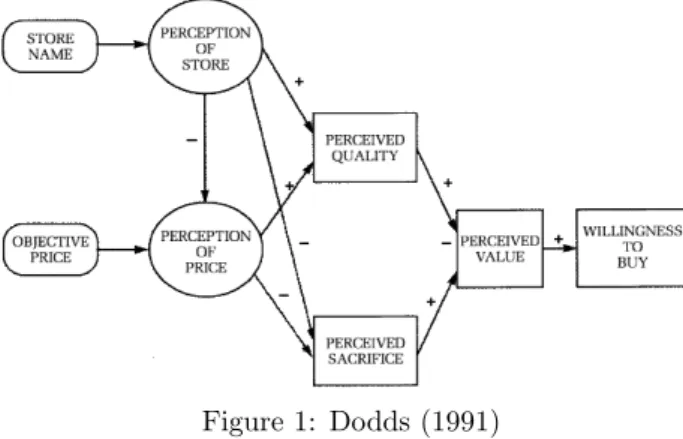
But how does the quality-signalling aspect of price interact with a con-sumer’s purchasing decision? Dodds (1991) constructs a theoretical model of consumer product quality evaluation and perceived value (as well as willingness to buy), dependent on product price and store name information. He assumes that buyers have some acceptable pricefloor as well as an acceptable price ceil-ing for a given item. Dodds proposes that this acceptable pricefloor stems from consumers’ perception of poor quality in items that seem too cheap. Echoing Sc-itovsky’s theory, he proposes that this can be explained by a rational belief that competitive market forces will tend to make better products more expensive, and inferior products less expensive. Thus, objective price increases willingness
to purchase by positively influencing perceived quality, while still decreasing willingness to purchase by increasing the perceived monetary sacrifice required to purchase the item. In his framework, Dodds unites these dual effects of price on willingness to purchase with the concept of perceived value, representing “the link between the cognitive attitudes of perceived quality and perceived monetary sacrifice.” Perceived value is then critical to our understanding of customer satisfaction in restaurants, because perceived value influences the cus-tomer’s willingness to pay when selecting a restaurant, while the cuscus-tomer’s post-meal valuation of their restaurant experience may differ from this initial perception. Thus, customers’ satisfaction is likely a measure of how well their initial perceived value of the restaurant, possibly signaled through restaurant price, is matched or exceeded by their experience.
Figure 1: Dodds (1991)
An illustration of Dodds’ framework around perceived value appears in Fig-ure 1, above. Note that the positive signs indicate substitutive relationships between variables, while negatives indicate complementary ones. While Dodds also discusses the impact of store name on perceived value (and ultimately, will-ingness to buy), in this paper we disregard this factor, as store name preference surely varies hugely across individuals, and thus our large-scale aggregation of data would not capture these preferences. Nevertheless, we expect to capture
some information about how restaurants’ brands are perceived via their average Yelp! Rating.
Dodds further posits that consumers only rely on price to infer quality in-formation because they have incomplete inin-formation of the product’s quality before purchasing it. This makes the issue of price quality signaling particu-larly interesting in the case of restaurants because consumers agree to purchase food for a given price before even seeing the food, reducing the factors that can inform their expectation of its quality. We would expect this to increase their reliance on price as an indicator of quality. On the other hand, restaurant pa-trons may obtain more quality information about restaurants and dishes from reviews, influencing their perceived value and therefore their baseline fair price. Moreover, as the data we are using in this paper are reviews written on Yelp!, it seems likely that the vast majority of review writers had looked at other Yelp! reviews before making the decision to eat at a particular restaurant. Addition-ally, repeat customers will likely rely entirely on past experiences for quality information. However, this is complicated by the fact that their past quality as-sessment might have originally incorporated price information. These exposures to non-price signals about the restaurant’s quality might lessen the dependence of perceived value (and consequent consumer satisfaction) upon perceived price. Anderson and Sullivan (1993) illuminate the role of perceived value as an an-tecedent of customer satisfaction. This study sought to test competing models of the determinants of customer satisfaction using a nationally representative database. The data consists of telephone survey results from customers of 57 prominent companies in Sweden (representing wide-ranging industries and cu-mulatively making up a 70% market share). Respondents reported values from 1 (low) to 10 (high) indicating their satisfaction, repurchase intentions, expec-tations, how much their expectations were fulfilled, how easy it is to evaluate
the quality of the good purchased, the good’s “quality given price”, and “price given quality.” Perceived quality was calculated as the square root of the prod-uct of the latter two variables. Since this measure incorporates both perceived costs and perceived quality, it is not the same perceived quality as previously discussed; rather, it is analogous to Dodd’s concept of perceived value. Thus, we will refer to this measure as perceived QUAL (the authors’ assigned variable name) from now on to avoid confusion with our more customary conception of perceived quality. The authors examine a multitude of hypotheses related to the determinants of customer satisfaction and repurchase intentions, but we will focus on those most directly relevant to our topic.
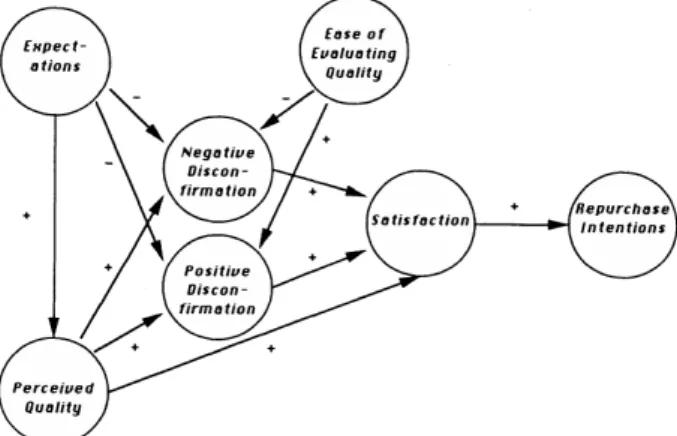
The authors begin by considering existing theories regarding satisfaction’s antecedents, including some of these theories in their model and using others as alternative hypotheses to those they select. First, they address the prevail-ing Expectancy-Disconfirmation model described by Oliver (1980), which sug-gests that consumers construct value expectations of a good or service before purchasing it, then conclude their perceived QUAL after consuming or expe-riencing it. The difference between post- consumption perceived QUAL and pre-consumption expectations of quality is disconfirmation, which is positive if the customers’ expectations were lower than their perceived QUAL and negative if the converse is true. Oliver’s Expectancy-Disconfirmation model essentially proposes that customer satisfaction is an increasing function of perceived QUAL and expectations. This is because it incorporates the idea of assimilation: when the difference between objective quality and expectations is relatively small, perceived QUAL is directly influenced by, and assimilates to, expectations. In other words, positive expectations will slightly increase perceived QUAL and negative expectations will slightly decrease perceived QUAL when actual qual-ity falls within an acceptable range of expectations. Evaluating previous studies’
evidence for and against the Expectancy-Disconfirmation hypothesis, Anderson and Sullivanfind insufficient support for the direct impact of expectations on satisfaction, and thus construct an alternative Quality-Disconfirmation hypoth-esis, which serves as the basis for their model.
Their model, pictured below in Figure 2, eliminates the direct link between expectations and satisfaction, positing instead that satisfaction is an increasing
Figure 2: Anderson and Sullivan (1993)
function of perceived QUAL and disconfirmation, which both incorporate the ef-fects of expectation. Moreover, the authors implement the Assymetric-Disconfirmation hypothesis in their model, suggesting that negative disconfirmation decreases satisfaction more than positive disconfirmation increases satisfaction. Addition-ally, the authors consider theories regarding the effect of quality ambiguity (the difficulty of definitively assessing product quality during and post-consumption) on perceived QUAL convergence to expectations. They ultimately decide to in-corporate the Evaluation hypothesis into their model. This hypothesis suggests that greater product quality ambiguity leads customers to rely on their expecta-tion more when constructing percepexpecta-tions of QUAL. Thus, assimilaexpecta-tion plays a greater role when quality is difficult to evaluate. Finding this to be a likely hy-pothesis, Sullivan and Anderson incorporate ease of evaluating quality in their
model as a factor that is positively correlated with the magnitude of
discon-firmation; in other words, as the ease of evaluating a good increases, negative disconfirmations become more pronouncedly negative, and positive disconfi rma-tions become more pronouncedly positive.
Finally, Anderson and Sullivan evaluated the strength of each component hypothesis of their model against alternative hypotheses. They do so by es-timating regressions for each hypothesis once for each year and each firm in the data. Because customers that report high good quality are more likely to also report positive disconfirmation and high satisfaction, the authors expect dependence of errors for these regressions. To correct for this, the authors use a SUR method proposed by Zellner (1963) for their regressions. The authors examine the data and find no strong evidence of bias in the data. Both a restricted-unrestricted Chow test and a likelihood-ratio test were performed for each regression, yielding the same resulting F statistics. These measures seem appropriate for ensuring quality statistical analysis.
As expected, the authors find that expectations are positively related to perceived QUAL. The Quality-Disconfirmation hypothesis was validated by the data, while the constraint imposed by the Expectancy-Disconfirmation hypoth-esis was rejected. Thus, expectations affect satisfaction primarily indirectly, through perceived QUAL, and satisfaction is positively related to both perceived QUAL and disconfirmation. To clarify, positive disconfirmation is positively cor-related with satisfaction, while negative disconfirmation is inversely correlated with it, as predicted. Nevertheless, perceived QUAL is more strongly correlated with satisfaction than either form of disconfirmation, across almost everyfirm’s regression. The Assimilation Hypothesis is weakly validated, as the constraint imposing no relationship between expectations and perceived quality is rejected after yielding an F statistic of 15.44. However, the authors caution that theR2
for the Assimilation Hypothesis model is only 0.08, implying that expectations only explain a small amount of the variation in perceived quality. Thisfinding is especially relevant to our inquiry, as it suggests that even if restaurant price signals quality and influences customer expectations, the customers’ ultimate evaluation of the value of their experience will only be slightly impacted by this quality expectation. The Assymetric-Disconfirmation hypothesis was also supported by the study’s findings in aggregate. This implies that restaurant patrons who enjoy their meal more than they expected to will not gain as much satisfaction as disappointed patrons lose. Finally, Anderson and Sullivan also
find that the data supports the evaluation hypothesis. This suggests that in the restaurant sector, where quality is multifaceted and relatively difficult to evalu-ate, customers’ perceptions of quality are more likely to be influenced by their quality expectations than in a sector with less ambiguity in quality evaluation. Unlike the previously discussed authors, McDougall (2000) does not consider price as a quality signal while empirically testing a model of customer satisfac-tion across four different service sectors. Nevertheless, this study lends support to Dodds’ proposition that perceived value influences customer satisfaction. Mc-Dougall’s model proposes two primary antecedents to customer satisfaction in service industries: perceived value and perceived service quality. He further breaks perceived service quality down into two components: customer percep-tions of core quality (the degree to which the service provider fulfills the basic promised service) and relational quality (the experience surrounding the fulfi ll-ment of the service). In the restaurant industry, for instance, core quality might encapsulate the flavor and quality of the food as well as whether it was deliv-ered in a reasonable timeframe, while relational quality might refer to ambience and waitstaff demeanor. McDougall selects the dissimilar restaurant, dentist, auto service, and hairstylist industries to ensure that they differ sufficiently to
allow generalizability of the study’s results; however, we will focus on the restau-rant sector results. Data was collected through questionnaires distributed to a large church congregation, and the restaurant survey had 133 responses (at a response rate of 81.1 percent). The survey asked questions about the respon-dents’ most recent restaurant experience, designed to measure their perception of core service quality, relational service quality, perceived value, satisfaction and future intentions. It also asked demographic questions and questions about past experience with the restaurant in question.
This survey methodology is problematic because it asks respondents to re-call a restaurant experience that they have had in the past, and their memories might not be true to their past experience. Moreover, the survey respondents are both geographically and demographically similar, leading to potential biases. Another potential issue emerged once the data was collected; 90 percent of re-spondents to the restaurant questionnaire based their responses on a restaurant that they went to about half the time they went out to eat. This fact sug-gests that the data might only be representative of good restaurant experiences, as most people will not repeatedly eat at a restaurant they did not enjoy the
first time. While McDougall’s findings thus do not tell us much about dissat-isfaction, they still may be able to reveal which of the considered factors most influence restaurant customer satisfaction. And indeed, after establishing a LIS-REL model to relate variables and testing the model’sfit, the author concludes that perceived value is the largest factor in determining restaurant customer sat-isfaction. Moreover, of the four service areas examined, restaurants exhibited the highest connection between perceived value and customer satisfaction.
Few studies have experimentally examined the relationship between per-ceived value (through perper-ceived price and quality) and customer satisfaction in the restaurant industry alone. One of the only statistically robust of these
studies was performed by Han and Ryu (2009). In this study, they investi-gate the relationship between customers’ price perception, various features of a restaurant’s physical environment, and customer satisfaction and loyalty. They measure price perception as the customer’s subjective evaluation of the appro-priateness of the price for the restaurant experience. Han and Ryu evaluate
Figure 3: Han and Ryu (2009)
perceived price both as a stand-alone factor and as a mediating factor between physical environment features and satisfaction and loyalty, as shown in thefigure to the left. It is reasonable to as-sume that customers’ percep-tion of price fairness is largely influenced by the restaurant’s appearance and physical environment, as restaurants of different price levels often cultivate par-ticular appearances to signal their price level. Unsurprisingly, then, confi rma-tory factor analysis revealed that this modelfit the data well.
Han and Ryu elicited survey data from customers at three geographically separated restaurants, and obtained a response rate of 58.74% (279 customers). They performed a battery of statistical tests, correcting for slight negative skew-ness in all variables using a square root transformation, after which their datafit the standard assumptions of normality, linearity and homoscedasticity. Finally, they use correlation measures between each pair of variables to test for relation-ships,finding the greatest correlation between customer satisfaction and price perception. They also conclude that physical environment factors influenced customer satisfaction and loyalty, largely through influencing price perception. Thesefindings suggest that perception of price appropriateness is a very useful
variable in measuring customer satisfaction, especially as it mediates several other influential variables. This is consistent with Dodds’ proposal that cus-tomers gain greater satisfaction from restaurant experiences whose prices fall within their acceptable range. While Han and Ryu took great care with their statistical analysis, their sample size is troubling as their data only incorporates information from three restaurants, which may not be enough to truly examine the wide range of price perceptions customers have at other restaurants. In this paper, we will not focus on the effect of physical restaurant environment on customer satisfaction; nevertheless, Han and Ryu’s research provides some support for the importance of restaurant price signaling in shaping customer satisfaction.
We hope to add to the existing literature by providing a statistically robust analysis of the antecedents of customer satisfaction in the restaurant industry. Unlike most other studies on this topic, we do not use surveys asking customers to quantify their perceived value, expectations and satisfaction. This means that no respondent misunderstandings of these concepts will cloud our data. Moreover, our dataset is far larger than a survey methodology would allow, giving our results more robustness. Nevertheless, we are limited in our approach, as we must use proxy variables to evaluate relationships between these factors of interest. By separately examining the determinants of customer satisfaction for expensive and inexpensive restaurants, we hope to clarify whether price acts as a quality signal to restaurant patrons, and whether expectations shaped by this signal are assimilated into post-consumption evaluations of value.
0.3
Model Selection
Latent Dirichlet Allocation (LDA) is a powerful topic modelling technique espe-cially well-suited to topic classification in text analysis. Blei et al. first proposed
LDA in 2003 as an improvement on Hofmann’s probabilistic Latent Semantic Indexing model. We will use the representations and variable names originally used by Blei et al. unless otherwise specified in this paper. Blei et al. use words as base-units, each represented as anN-dimensional vector (whereN is the number of words appearing in the corpus). For instance, the vth word is represented as a vector containing all zeroes, except for the vth entry, which takes on a value of 1. We will use the same representation in this paper. More-over, Blei et al. refer to documents (collections of text) and corpora (collections of documents). In our case, each document is a Yelp! Restaurant review, and our corpus is the amassed collection of reviews. Our base units are individual review words.
Essentially, LDA is a generative probabilistic model; this class of model is usually used to distill content from text. It is generative because it assumes that the document as a whole has a mixture distributionθgoverning the joint probabilities of someklatent (i.e. hidden) topics in the document, and that this mixture distribution is generated by some latent probability distribution. Specif-ically, LDA assumes that the frequency of topics in a document is sampled from a multinomial distribution withk-dimensional parameter vector θ, and thatθ
itself is sampled from a Dirichlet distribution prior with latent parameterαand known dimensionalityk. (The dimensionalitykrepresents the number of latent topics in the corpus; this is a parameter that we will select for our model.) This is convenient because the Dirichlet distribution is the conjugate prior for the multi-nomial distribution. This means that using the Dirichlet prior ensures that, after incorporating a new set of observations, the posterior distribution will also be Dirichlet. While generative models are often used to predict new observations given an underlying distribution, here we will do the converse, using LDA to perform latent factor analysis. Factor analysis uses previous observations of
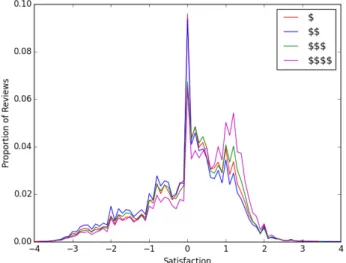
ran-dom variables to infer information about the latent distribution generating these random variables. We hope to discover the latent distribution that governs the probability mixture of review words. Moreover, LDA assumes that word prob-abilities for each topic are governed by a matrix of conditional probprob-abilities β, such that the (i,j)th entry is the probability that an observation is wordj, given that the topic of the observation is topici. Thus, LDA can be represented as a hi-erarchichal model (specifically a parametric empirical Bayes model) of a corpus.
Figure 4: Blei et al. (2003) Figure 3 reflects this
hierar-chical structure. The large outer box represents the col-lection of all M documents within a corpus, and the
smaller inner box represents the collection ofN words within a document. Ev-ery parameter in the figure is located at a particular level (corpus, document or word); any parameter at a given level is sampled once for each instance of that level (i.e. once for the corpus level, M times for the document level and N times for the word level). The parameterαis a corpus-level parameter govern-ing the Dirichlet prior for the joint topic probabilities represented by the vector
θ. Similarly, β is a corpus-level parameter, representing the matrix of word probabilities, given topics. Meanwhile, θ is a document-level variable, drawn from the Dirichlet distribution with parameterαonce for each of theM docu-ments. The value zrepresents a list of N vectors{z1, z2, . . . , zN}, so that the
vector zd includes kvalues {zd1, zd2, . . . , zdk} representing the topic variables.
TheN vectors{zd}then each contain the probabilities that thedth word is of
topic 1,2, . . . , k. TheN-length vector of wordswin the document has elements
{w1, w2, . . . , wN}. Both thezdnand thewnare considered word-level variables.
Finetti theorem, which states that exchangeable observations are conditionally independent, conditioning on a latent parameter of the observations’ probability distribution. In the case of text analysis, we view words as exchangeable, and thus conditionally independent and identically distributed, conditioning on the
β parameter governing the distribution of words within a topic, as well as the Dirichlet parameter α governing the distribution of topics within a document. Thus the de Finetti theorem suggests that the latent mixture distribution θ
that governs topic frequency can be estimated fairly accurately using only the observed frequency of words in a document.
Not only is LDA one of the most widely-used methods for general text clas-sification, but also extremely historically successful when applied to review text, specifically. Brody and Elhadad (2010) used an unmodified 3000-iteration LDA model with default parametersα= 0.1 andβ−0.1 to label each sentence of a review collection with an aspect (what we refer to as a topic). After running their model with varying values of k, they used cluster validation to evaluate which k yielded the most consistent clustering. While word-level LDA some-times focuses in onglobal topics that distinguish reviews from one another, the authors were able to improve local topic classification (where local topics are those that appear frequently within individual reviews), by classifying whole sentences with topics. Since the variables of interest in review analysis are mostly local topics (e.g. food, service, ambience) rather than globaxbl topics (cuisine type, etc.), this approach makes sense. However, it does lose some granularity of information, as sentences including multiple topics of interest (for instance the sentence “I really liked thefood, and theservicewas great.”) are labeled only with the most salient topic. Moreover, sentence-level classification requires more intensive semantic pre-processing. Thus, we do not implement this tactic. Nevertheless, Brody and Elhadad obtained impressive results, with
their LDA model inferring topics such as ambience, value, staff/service, main dishes, and wine/drinks.
Moreover, a winning entry in the 2013 Yelp! Dataset Challenge by Huang et al. successfuly implemented LDA topic classification with a corpus of reviews almost exactly like ours. The authors aimed to capture the latent topics in Yelp! restaurant review text to deduce what factors increase Yelp! review stars, and thereby increase restaurant revenue. Thus, their research is of great relevance to our investigation. Moreover, their definitions of the parameters of interest and their consideration of reviews as documents mirror our own. Huang et al. implement LDA using an Online Learning algorithm proposed by Hoffman et al. (2010). This implementation reduces memory requirements, as smaller batches of reviews are processed one at a time, then the LDA topic model incorporates information from each batch and updates. Further, the authors limit the review words considered to the 10,000 most frequently occuring words in the corpus. In implementing this model, the authorsfind that LDA reveals the most sensible topic distinctions using the parameterk= 50 for the number of latent topics. Thus, this is thefirst value we consider. The authors proceed to apply theirfindings to the task of predicting average restaurant review stars for each topic. We do not replicate this work, as predicted restaurant quality along topic dimensions is only tangentially related to our inquiry. Nevertheless, the success of this study, and the acclaim it garnered in the Yelp! Dataset Challenge, suggest that our LDA model will successfully uncover the latent topics we seek.
0.4
Methodology
We obtain our data as three .jsonfiles, containing information about the busi-nesses in the sample, the users in the sample, and the reviews in the sample. All of our data manipulation is performed using the pandas library for python.
Using pandas, we first convert these files to .csv files, then combine them as follows: we first limit the business data frame to those businesses located in Arizona, Nevada and Wisconsin, as these are the U.S. states included in the dataset. (In fact, the dataset is limited to businesses within the metropolitan areas of Pheonix, Arizona, Las Vegas, Nevada, and Madison, Wisconsin. We di-vide on state rather than city because businesses list neighborhoods and suburbs as their city, and we are concerned with the metropolitan area.) Next, we limit the business data frame to those businesses whosetype labels include “restau-rant”. Then, we include information from the business dataset in the review dataset, merging on business id, and insert information from the user dataset into the review dataset, merging on user id. Thus, each review constitutes an observation in our dataset.
Finally, we separate our data into three datasets, each encompassing one city. We retain 344,318 review observations across 4,655 restaurants for Las Vegas, and 324,468 review observations across 7,439 restaurants for Phoenix, but only 25,824 review observations across 916 restaurants for Madison. In light of this wide gap, we drop Madison from our analysis, focusing on Phoenix and Las Vegas, both of which have plenty of observations for our analysis. These two cities are relatively geographically similar, and thus we cannot be sure that our results are generalizable beyond the southwest United States. Nevertheless, the character of these two cities is somewhat distinct, in that Las Vegas is a major tourist and gambling destination, while Phoenix is not. Thus, we contend that the demographic constitution of these cities is sufficiently varied that any similarities between them will be generalizable.
In addition tostate,business id anduser id, our initial variables of interest include:
and discrete,
• average user stars, the user’s average number of review stars, ranging from one tofive and continuous,
• price range, the number of dollar signs Yelp! assigns the restaurant, based on the average cost of a meal there, and
• text, the text of the review.
We define a new variable,satisfaction as the difference betweenstars and
average user stars. This becomes the primary parameter of interest in our anal-ysis, as we propose that a user will rate a restaurant neutrally (the same as her average rating) if it exactly meets her expectations for it. Thus, we hope to capture a user’s satisfaction, relative to her expectations, with this variable. Ideally, we would like to measure satisfaction relative to her average stars for that restaurant’s price range, as this would account for differences in expecta-tion for expensive and inexpensive restaurants. However we are limited in this by the fact that we do not have separate user average ratings for each price range. Nevertheless, we tentatively assume that users scale their ratings with their expectations when they review a restaurant on Yelp!; in other words, if a user gives three stars on average, we assume that she awards a $$$$ restaurant three stars if it meets her expectations, just as she does a $, $$ or $$$ restaurant, even though her expectations for the $$$$ restaurant may have been higher than those for other price ranges. We examine the distribution ofsatisfaction in our analysis.
Finally, we begin our latent topic analysis for Phoenix and Las Vegas, using the gensim library’s LDA implementation. For each city, we construct a corpus from its review texts, restricting our dictionary to only the 10,000 most com-mon stemmed words in the corpus, after stemming words with Porter’s Snowball
Stemmer as implemented in the Natural Language Toolkit python library. To select the appropriate number of topicsk, we run the model using a variety of values ofk, ranging from 5 to 250. Following the selection process proposed by Huang et al. (2013), for each value ofkwe manually inspect the words associ-ated with each generassoci-ated topic,finding thatk= 56 yields the most apparently cohesive and informative topics. While some of these topics’ meanings are un-clear (partially due to word stem ambiguity), the majority of them have fairly obvious interpretations. For instance, here are a few LDA-generated topics for
k= 56, with their top 5 associated words:
City Topic # Top 5 Word Probabilities Our Label
Phoenix 4 0.051*clean 0.047*decor 0.037*modern 0.028*grand 0.028*trendi
ambience
Phoenix 54 0.063*the 0.059*good 0.031*price
0.030*food 0.021*portion
Value
Las Vegas 50 0.092*wait 0.037*minut 0.032*line 0.028*get 0.028*long
Service
Note that the probability associated with each word is the value zdk, whered
is the index of that word in the dictionary of 10,000 words, andk is the topic number. Further, note that these words are presented here in their stemmed forms.
We obtain θ, the topic probability distribution for each review from our LDA models, and augment our dataset with 56 columns, each containing the probability that a given review is about that topic. These probabilities serve as our independent variables in our statistical analyses, with satisfaction as our dependent variable. We standardize these variables by subtracting their means and dividing by their standard deviations. Moreover, we perform each statistical analysis separately for each price level in each city. Thus, we group
our observations by price level.
Finally, we perform ordinary least-squares linear regression. Although the variablesatisfactionis not normally distributed and thus does not entirely sat-isfy linear regression’s assumptions, it does have a strong central tendency, so linear regression seems fairly appropriate. We use thestatsmodels python pack-age’s ols implementation. We examine the covariance of the data, and do not
find any significant multicollinearity concerns.
0.5
Results
To begin, we turn our attention to the distribution ofsatisfaction at each price level, as pictured in the charts below:
Figure 5: Distribution ofsatisfaction in Las Vegas, NV
These charts show thatsatisfaction is centered around 0, as expected since it is measured as the difference from a reviewer’s average star rating. Moreover,
satisfaction attains a local maximum around 1 and a less prevalent local maxi-mum around -1. Thus, reviewers tend to rate restaurants within a star of their
Figure 6: Distribution ofsatisfaction in Phoenix, AZ
average. The heavy left-tail of the distribution is partially due to the fact that average review stars are predominantly contained within the range [3,4], so the difference between a given review’s star rating and the user’s average rarely goes above 2. Nevertheless, the greater concentration of dissatisfaction lends some support to the Assymetric-Disconfirmation hypothesis.
We observe that the purple line representing $$$$ reviews lies above the rest for most of the positive values of satisfaction, and below the rest for most negative satisfaction values. Thus, $$$$ reviews are the most likely to exhibit satisfaction and the least likely to exhibit dissatisfaction. This trend is most likely due to $$$$ restaurants providing an objectively better restaurant experi-ence, on average. However, if we hold strongly to our assumption that reviewers calibrate their expectations, and therefore their rating, to the price level, there is another explanation. Under this assumption, this might provide support for the assimilation of perceived quality to expectations, as expensive restaurants signal high quality through price, raising expectations.
reviews that mirrors the $$$$ line. Even compared to $ reviews, $$ reviews are most likely to exhibit dissatisfaction and least likely to exhibit satisfaction. This unexpected trend indicates that satisfaction and perceived quality is primarily a function of disconfirmation for less expensive restaurants. Because expectations should be higher for a $$ restaurant than a $ restaurant, assimilation would predict that $$ reviews would be more satisfied, on average.
We turn now to our linear regressions. The adjustedR2
values of the linear regressions range from 0.237 to 0.296, meaning that variation in our 56 topic probabilities only accounts for 25-30% of the variation in satisfaction. Because our data is cross-sectional, rather than time-series, these values are sufficiently high to draw meaning from our results. We consider variables’ significance at theα= 0.05 significance level.
Topic
$
$$
$$$
$$$$
NV
110.2151
0.2074
0.2278
0.2082
NV
260.1500
0.1592
0.0968
0.0704
NV
430.0837
0.1232
0.1598
0.1699
NV
520.0985
0.1267
0.0870
0.0609
AZ
30.2472
0.2513
0.2702
0.2502
AZ
220.1016
0.0984
0.0619
0.0448
AZ
260.1798
0.1626
0.1120
0.0442
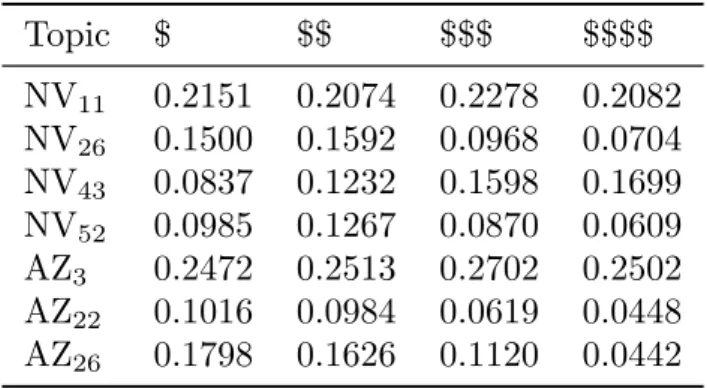
Table 1: “Positive” Coefficients
First, we examine the coefficients of topics we labeled “Positive”, all of which were significant at every price level. The coefficients associated with these topics
Topic $ $$ $$$ $$$$ AZ23 -0.2509 -0.2229 -0.2122 -0.2275
NV44 -0.1387 -0.1406 -0.1561 -0.1612 are, as expected, positive across all
price levels. We also examine the co-efficients of topics we labeled “Neg-ative”. These topics are significant,
with negative coefficients across all price levels. These results suggest
that our linear regressions do indeed fit the data as expected, and also cor-roborate our topic interpretations.
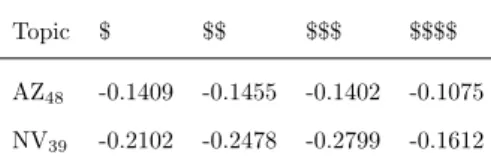
Next, we turn to the topics we labeled “Comparison and Evaluation.” These two topics seem to correspond well to each other, both associated with words
Topic $ $$ $$$ $$$$
AZ48 -0.1409 -0.1455 -0.1402 -0.1075
NV39 -0.2102 -0.2478 -0.2799 -0.1612
Table 3: “Comparison and Evaluation” Coefficients
such as would, better, much, like,
pretty, good,bad,taste,place. All co-efficients associated with these topics are negative, and these topics are sig-nificant across all price levels. This suggests that reviewers tend to use
comparison and evaluation words to describe a restaurant when they find it lacking, rather than when it excels in comparison to other experiences. Addi-tionally, both topics’ coefficients for $$$$ are significantly lower than those for other price level. We tentatively suggest that this provides support for the as-similation of perceived value to expectations when expectations are particularly high, as it demonstrates a reduced reliance on evaluation and comparison (and therefore, disconfirmation) for very expensive restaurants.
Examining the topics associated with the label “Service,” we observe that the coefficients for these topics are uniformly negative, and all significant. This
Topic $ $$ $$$ $$$$ AZ44 -0.0503 -0.0587 -0.0864 -0.1273 AZ53 -0.1758 -0.2192 -0.2051 -0.2241 NV22 -0.2600 -0.2488 -0.1896 -0.2081 NV38 -0.0415 -0.0763 -0.1072 -0.1322 NV50 -0.0346 -0.0503 -0.0365 -0.0481 suggests that reviewers primarily
dis-cuss service when it does not meet their expectations. Topics AZ44 and
NV38 are characterized by many of
the same general service words, such as order, table, ask, came, waitress,
didn’t, and back. Both these topics
grow increasingly negative as price level increases. These results suggest that expensive restaurant patrons are more displeased by unsatisfactory service than patrons of inexpensive restaurants. Moreover, AZ53 follows this pattern with
the exception that its coefficient for $$ is higher than that for $$$, and NV50
follows this pattern with the exception that its coefficient for $$ is higher than that for $$$$. Both these topics primarily correspond to wait-related words such aswait, time, took, and long, while also corresponding to general service words like order, table and service. These coefficients might suggest that $$ restaurant patrons, and to a lesser extent $$$ and $$$$ restaurant patrons are particularly bothered by slow service. We hypothesize that it is more likely that $$ restaurants simply have particularly slow or bad service, when compared to $$$ and $$$$ restaurants, while $ restaurants are unlikely to have waitstaff at all, reducing wait time as well as the importance of service. However, NV22,
complicates these results, with its most negative coefficient at $, then $$, then $$$$ andfinally $$$. This topic is associated with the normal service words, but it is also the most markedly negative of the ”Service” topics, with associated words like never, even, bad, horrible, didn’t and tip. Perhaps the discrepancy between this topic’s coefficients and the others’ is due to its extremity. Once again, the potential explanation that inexpensive restaurants actually have in-ferior service would make sense of this result; perhaps the other coefficients cap-tures service dissatisfaction rooted in price-driven expectation disconfirmation, while this variable captures universally displeasing service experiences. Thus, taken together, these topic coefficients do not definitively establish a relation-ship between restaurant price level and the importance of service. Nevertheless, they somewhat suggest that the negative impact of long waits and worse-than-expected service increases with price level, while the prevalence of truly awful
service does not.
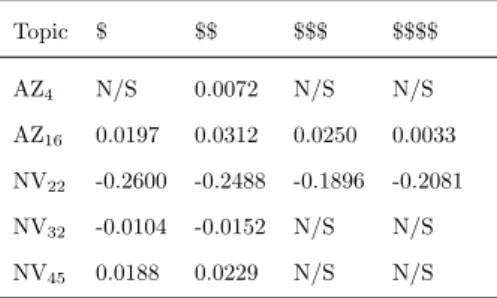
We now turn our attention to the topics relating to “ambience.” Both AZ16
and NV45 deal with outdoor restaurant spaces, sharing key words like patio,
Topic $ $$ $$$ $$$$ AZ4 N/S 0.0072 N/S N/S AZ16 0.0197 0.0312 0.0250 0.0033 NV22 -0.2600 -0.2488 -0.1896 -0.2081 NV32 -0.0104 -0.0152 N/S N/S NV45 0.0188 0.0229 N/S N/S
N/S = Not Statistically Significant atα= 0.05
Table 5: “Ambience” Coefficients
outside,nice andseat. While AZ16is
significant for $, $$ and $$$, NV45 is
significant only for $ and $$. Both topics’ coefficients are positive, and largest at $$ and smallest at $. This suggests that patrons of inexpensive restaurants gain considerable satis-faction from the availability of
out-door seating, while outout-door seating does not significantly impact satisfaction at expensive restaurants. Topic NV32is associated with words relating to
restau-rant layout such astable,room,seat,group, andview. Once again, it has limited significance, only statistically significant for $ and $$, with increasingly nega-tive coefficients. Thus, complaints about restaurant layout are only a predictor of dissatisfaction at inexpensive restaurants. Similarly, topic AZ4, associated
with general ambience words like clean, d´ecor, modern, grand and trendy, is only statistically significant at $$. Its coefficient is positive, suggesting that reviewers at this price level tend to gain satisfaction from notable ambience and d´ecor. Interestingly, the statistically significant coefficients for all of these “am-bience” topics are most extreme for $$. One might expect that ambience would be an important determinant of satisfaction at expensive restaurants, but that is not the case, according to our data. Perhaps this is because $$$ and $$$$ restaurants provide a universally better ambience, reducing variation across this dimension to such a degree that any small differences in ambience negligably affect satisfaction.
Next, we discuss the coefficients for topics relating to different meals. The topics labeled “Dinner” are both significant with positive coefficients across all price levels. Moreover, both topics’ coefficients increase with price level;
Topic $ $$ $$$ $$$$ AZ21 0.0102 0.0605 0.1075 0.1042
NV14 0.0153 0.0264 0.0331 0.0542
Table 6: “Dinner” Coefficients while AZ21’s coefficient for $$$ is
slightly larger than that for $$$$, the difference is negligible compared to the increase in coefficients from $ to $$ and from $$ to $$$/$$$$. These
coefficients suggest that reviewers who discuss dinner are more satisfied than patrons who do not across all price levels. Moreover, dinner experiences seem to grow more satisfying as restaurant price level increases.
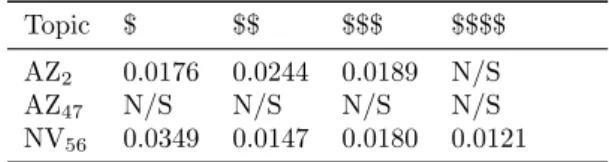
Topic $ $$ $$$ $$$$
AZ2 0.0176 0.0244 0.0189 N/S
AZ47 N/S N/S N/S N/S
NV56 0.0349 0.0147 0.0180 0.0121
N/S = Not Statistically Significant atα= 0.05
Table 7: “Lunch” Coefficients
On the other hand, the topics labelled “Lunch” are not all significant. In fact, AZ47is not significant at any price level. Meanwhile, AZ2and NV56’s p-values
Topic $ $$ $$$ $$$$ AZ36 N/S 0.0188 N/S N/S
NV49 N/S 0.0166 0.0285 N/S
N/S = Not Statistically Significant atα= 0.05
Table 8: “Breakfast” Coefficients increase with price level, remaining
significant except for $$$$. Where these topics are significant, their co-efficients are positive. While AZ2’s
coefficient is highest at $$, with the
coefficient for $$$ only slightly above that for $, NV56’s coefficients follow the
exact opposite of this pattern. Thus, we cannot infer a relationship between lunch-related satisfaction and price level from the coefficients. Similarly, of the
two topics labeled as “Breakfast”, AZ36 is significant only for $$, and NV49 is
significant only for $$ and $$$. Both topics’ significant coefficients are positive. The fact that all three meals have only positive coefficients implies that positive reviews tend to spend more space describing the meal in question: reviews with words clearly associated with breakfast, lunch, or dinner, are more likely to simply describe their individual restaurant experience, rather than universal restaurant topics such as service or ambience. Clearly, we cannot infer preferences for one meal over another at different price levels from these coefficients, as they are all positive. Nevertheless, the p-values do illuminate a certain relationship: while dinner is important at any price level, lunch is either not served, or not particularly appreciated at expensive restaurants, and breakfast is only relevant to satisfaction at $$ and $$$ restaurants.
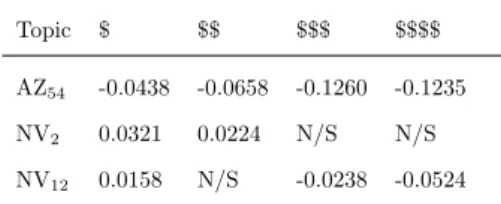
We turn next to some of the most relevant topics to our investigation, which we labeled “Value.” The words associated with NV12, like good, food, price,
Topic $ $$ $$$ $$$$ AZ54 -0.0438 -0.0658 -0.1260 -0.1235
NV2 0.0321 0.0224 N/S N/S
NV12 0.0158 N/S -0.0238 -0.0524
N/S = Not Statistically Significant atα= 0.05
Table 9: “Value” Coefficients
service,pretty,really, decent,quality,
average,cheap,expensedeal with the general perceived value of a restau-rant experience. An interesting pat-tern emerges from this variable’s co-efficients: at $, NV12 has a
statisti-cally significant, positive coefficient, losing significance at $$, then regaining significance for $$$ and $$$$ with increasingly negative coefficients. This re-veals an unsurprising trend: reviewers are more likely to comment positively on value-for-money at inexpensive restaurants, and negatively on value-for-money at expensive restaurants. Reviews evaluating perceived value relative to expec-tations demonstrate an inverse relationship betweensatisfactionand price level, while we expect that restaurant price level and expectations are positively
cor-related. Thus, this pattern suggests that perceived value does not assimilate to expectations, but rather is a function of the difference between experience and expectations, indicating that satisfaction is primarily a function of disconfi rma-tion.
The next variable of interest, AZ54, is associated with some of the same
words as NV12, likegood,price,food,service, anddecent, but also with
portion-size words like portion, little, size, and expect. This topic’s linear regression coefficients are all negative and statistically significant. As this topic clearly is associated with reviewers’ expectations relative to their experiences, the nega-tive sign of the coefficients supports the Assymetric-Disconfirmation hypothesis, which proposes that negative disconfirmation has a stronger effect on satisfac-tion than positive disconfirmation. Moreover, its coefficients grow increasingly negative with price level, with the exception that the coefficient for $$$ is very slightly larger than that for $$$$; nevertheless, both are almost 2 times greater than the coefficient for $$. This evidence corroborates half of the trend es-tablished from NV12, in that reviewers are more disappointed with insufficient
value and portion size for expensive restaurants.
Finally, topic NV2, associated almost exclusively with portion-size words like
portion,size,large,small, andshare, only attains significance at $ and $$, with decreasingly positive coefficients. This supports the other half of NV12’s
pat-tern, as it suggests that portion size only increases satisfaction for inexpensive restaurants. Perhaps these trends are simply due to expensive restaurants serv-ing less food than inexpensive ones. However, the strength of the trend across these variables suggests that there is more to it than that, and that this is due at least in part to a difference in perception. What is clear is that reviewers gain satisfaction from value-for money at inexpensive restaurants, while tending towards dissappointment in the value they get from expensive restaurants.
0.6
Conclusion
We determine several factors that exhibit price level-dependent correlations with satisfaction. Unsurprisingly, dissatisfaction correlates more strongly with poor service and long wait times at expensive restaurants. On the other hand, the impact of ambience on satisfaction is inversely correlated with price level. We
find that satisfaction is more strongly correlated with lunch for inexpensive restaurants, dinner at expensive restaurants, and breakfast at moderately priced restaurants, while dinner remains the most important meal for satisfaction over-all.
There is mixed evidence for the relationship between price level and sat-isfaction. On one hand, some of our results provide limited evidence for the neoclassical model and the negative impact of price level on perceived value. Our analysis of “Value” topic results finds a distinct increase in value-related dissatisfaction, as well as a decrease in value-related satisfaction, with price level. We find that “Comparison and Evaluation” topics are least strongly correlated with dissatisfaction at very expensive ($$$$) restaurants, suggesting that reviewers of these restaurants are less likely to derive dissatisfaction from comparing their actual experience to their expectations and previous experi-ences. In other words, reviewers of expensive restaurants seem less susceptible to disconfirmation. A likely explanation for this phenomenon is that expen-sive restaurants simply measure up to expectations more than their inexpenexpen-sive counterparts. However, it is also possible that perceived value assimilates to expectations more at extremely expensive restaurants; this might be because individuals who partake in an unusually expensive meal are more reluctant to acknowledge that they “wasted” money than patrons at more moderately priced restaurants. Moreover, the distribution ofsatisfaction itself for different price levels suggests that assimilation may play a role in constructing perceived value,
as satisfaction is higher for more expensive restaurants. This is complicated by the fact that $ reviews exhibit higher average satisfaction than $$ reviews; per-haps disconfirmation plays a greater role when choosing between cheap and inexpensive restaurants. Indeed, it is likely that bargain-conscious patrons of $$ restaurants expect a better experience than they would at a $ restaurant, and are disappointed when these expectations are disconfirmed. The fact that ”Service” topic coefficients are most strongly associated with dissatisfaction at $$ restaurants corroborates this interpretation. Meanwhile, $$$$ restaurants yield distinctly more satisfaction than their $$$ counterparts, suggesting that, for expensive restaurants, perceived value assimilates to increased expectations, formed by a higher price-level.
Ultimately, we tentatively conclude that perceived value, and thereby sat-isfaction, are more likely to assimilate to high expectations at particularly or unusually expensive restaurants. Correspondingly, wefind that perceived value and satisfaction are most negatively impacted by disconfirmation of expectations for inexpensive to moderate restaurants. We suggest that future research con-sider low-to-mid-priced restaurants separately from mid-to-high-priced restau-rants in order to more accurately assess the relationship between restaurant price level and satisfaction. Moreover, we posit that this effect may carry over into other goods with large price and quality ranges, and suggest this as another area for future inquiry.
List of Figures
1 Dodds (1991) . . . 5 2 Anderson and Sullivan (1993) . . . 8 3 Han and Ryu (2009) . . . 12 4 Blei et al. (2003) . . . 15 5 Distribution ofsatisfaction in Las Vegas, NV . . . 21 6 Distribution ofsatisfaction in Phoenix, AZ . . . 22
List of Tables
1 “Positive” Coefficients . . . 23 2 “Negative” Coefficients . . . 23 3 “Comparison and Evaluation” Coefficients . . . 24 4 “Service” Coefficients . . . 24 5 “Ambience” Coefficients . . . 26 6 “Dinner” Coefficients . . . 27 7 “Lunch” Coefficients . . . 27 8 “Breakfast” Coefficients . . . 27 9 “Value” Coefficients . . . 28
Bibliography
[1] Eugene W. Anderson and Mary W. Sullivan. The antecedents and conse-quences of customer satisfaction for firms. Marketing Science, 12:125–143, 1993.
[2] David M. amd Andrew Y. Ng Blei and Michael I. Jordan. Latent dirichlet allocation. The Journal of Machine Learning Research, 3:993–1022, 2003. [3] Samuel Brody and Noemie Elhadad. An unsupervised aspect-sentiment
model for online reviews. In In Human Language Technologies: The 2010 Annual Conference of the North American Chapter of the Association for Com-putational Linguistics, pages 804–812, Stroudsburg, PA, 2010. Associ-ation for Computer Linguistics ’10.
[4] William B. Dodds. In search of value: How price and store name information influence buyers’ product perceptions. Marketing Science, 5:27–36, 1991. [5] Han, Heesup, and Kisang Ryu. The roles of the physical environment, price
perception, and customer satisfaction in determining customer loyalty in the restaurant industry. Journal of Hospitality & Tourism Research, 33:487–510, 2009.
Topics for Phoenix, AZ 1: steak / meat?
0.204*steak + 0.075*rare + 0.067*medium + 0.038*cook + 0.037*cart + 0.025*nacho + 0.024*durant + 0.022*california + 0.020*pink + 0.017*done + 0.017*vega +
0.017*rail + 0.016*filet + 0.015*maggiano + 0.014*lentil + 0.013*king + 0.012*well + 0.012*such + 0.011*persian + 0.010*ear
2: Lunch / Italian
0.135*salad + 0.031*pasta + 0.025*chicken + 0.024*the + 0.024*tomato + 0.019*dress + 0.019*fresh + 0.017*lunch + 0.017*chees + 0.013*italian + 0.012*also +
0.011*bread + 0.011*spinach + 0.011*soup + 0.010*side + 0.010*delici + 0.010*lettuc + 0.010*order + 0.009*grill + 0.009*great
3: positive
0.052*love + 0.040*amaz + 0.035*place + 0.034*best + 0.032*the + 0.025*delici + 0.023*ever + 0.021*tri + 0.018*great + 0.016*food + 0.013*everyth + 0.013*favorit + 0.012*perfect + 0.012*one + 0.012*awesom + 0.012*this + 0.011*absolut +
0.011*recommend + 0.011*time + 0.010*friend 4: ambience / decor
0.051*clean + 0.047*decor + 0.037*modern + 0.028*grand + 0.028*trendi +
0.025*bright + 0.024*interior + 0.023*restaur + 0.021*bathroom + 0.017*bonus + 0.015*upscal + 0.014*courteous + 0.012*nice + 0.012*tourist + 0.011*southern + 0.011*nonetheless + 0.011*the + 0.010*mmm + 0.010*korean + 0.009*rough
5: sushi
0.202*roll + 0.181*sushi + 0.032*tuna + 0.021*teriyaki + 0.018*spici + 0.016*fish + 0.016*fresh + 0.014*chef + 0.012*salmon + 0.011*california + 0.010*sapporo + 0.010*the + 0.009*rice + 0.009*wasabi + 0.007*piec + 0.007*octopus +
0.007*construct + 0.007*avocado + 0.006*restur + 0.006*hawaii 6: middle eastern food
0.073*pita + 0.065*hummus + 0.040*gyro + 0.036*greek + 0.025*jungl + 0.024*chicken + 0.023*platter + 0.018*plate + 0.016*middl + 0.015*eastern + 0.014*express + 0.014*meat + 0.014*lamb + 0.013*mediterranean + 0.013*falafel + 0.013*panda + 0.012*tammi + 0.011*baba + 0.011*wrap + 0.010*coe
7: bbq / meat / comfort food
0.034*the + 0.028*chicken + 0.028*meat + 0.027*bbq + 0.026*rib + 0.026*pork + 0.023*chees + 0.023*sauc + 0.015*beef + 0.015*side + 0.014*mac + 0.014*flavor + 0.011*good + 0.011*corn + 0.011*tender + 0.010*like + 0.009*brisket + 0.009*fri + 0.008*tast + 0.008*grill
8: past visits and plans to visit in the future
0.064*had + 0.052*look + 0.047*back + 0.039*forward + 0.034*tri + 0.024*groupon + 0.023*went + 0.022*next + 0.019*away + 0.019*time + 0.018*will + 0.016*soon + 0.016*go + 0.015*first + 0.014*return + 0.013*blown + 0.012*grandma + 0.011*trip + 0.011*tonight + 0.011*flatbread
9: purchases
0.080*store + 0.050*groceri + 0.044*coupon + 0.043*buy + 0.042*ring + 0.033*gift + 0.028*deli + 0.026*product + 0.025*cupcak + 0.025*card + 0.024*onion + 0.022*squar + 0.018*period + 0.017*bought + 0.016*use + 0.013*cannoli + 0.012*bewar +
0.011*shop + 0.011*slam + 0.010*bang 10: dessert
0.010*cinnamon + 0.010*gelato + 0.010*chip + 0.009*almond + 0.009*shop + 0.008*bread + 0.008*tiramisu + 0.008*croissant + 0.008*cafe
11: holiday/ show/ theme
0.062*it + 0.042*dont + 0.029*cant + 0.024*cowboy + 0.023*vacat + 0.023*yard + 0.023*holi + 0.023*crappi + 0.021*killer + 0.021*ive + 0.021*knock + 0.020*crap + 0.020*downsid + 0.018*sing + 0.018*wont + 0.018*packag + 0.016*drank + 0.015*hurt + 0.015*devour + 0.013*sooo
12: yelp review / service
0.027*review + 0.019*restaur + 0.019*owner + 0.014*custom + 0.013*make +
0.012*experi + 0.012*new + 0.011*visit + 0.010*year + 0.009*know + 0.009*staff + 0.008*see + 0.008*manag + 0.008*feel + 0.007*star + 0.007*thank + 0.007*establish + 0.007*busi + 0.007*read + 0.007*say
13: twenty-somethings
0.055*school + 0.053*lol + 0.041*parent + 0.034*rock + 0.034*tequila + 0.031*organ + 0.022*shake + 0.021*cloth + 0.021*creme + 0.020*key + 0.020*low + 0.018*yay + 0.015*regret + 0.014*mmmm + 0.013*legit + 0.012*pretend + 0.011*starbuck + 0.011*old + 0.011*brule + 0.010*suit
14: family
0.095*mom + 0.079*quesadilla + 0.035*mother + 0.034*dad + 0.032*brother +
0.027*terrif + 0.027*mari + 0.025*bloodi + 0.020*law + 0.018*gotta + 0.016*gringo + 0.015*everytim + 0.014*boot + 0.014*lil + 0.013*camelback + 0.011*arcadia + 0.010*lisa + 0.010*southwestern + 0.009*proud + 0.009*paradis
15: Mexican food
0.054*mexican + 0.046*taco + 0.038*salsa + 0.035*chip + 0.030*bean + 0.026*the + 0.024*food + 0.023*margarita + 0.022*burrito + 0.018*tortilla + 0.018*enchilada + 0.017*good + 0.015*rice + 0.013*chees + 0.012*sauc + 0.012*chicken + 0.009*red + 0.009*chile + 0.009*flavor + 0.009*order
16: outdoor spaces / ambience
0.036*patio + 0.034*the + 0.030*outsid + 0.024*park + 0.023*seat + 0.020*nice + 0.020*insid + 0.018*sit + 0.017*bar + 0.017*area + 0.015*tabl + 0.014*place + 0.013*lot + 0.010*outdoor + 0.010*great + 0.009*littl + 0.009*enjoy + 0.008*there + 0.008*cool + 0.008*friend
17: flavor / food quality
0.073*fresh + 0.066*fish + 0.053*ingredi + 0.032*dish + 0.030*chef + 0.029*cook + 0.028*qualiti + 0.026*prepar + 0.022*oven + 0.019*flavor + 0.015*tast + 0.014*the + 0.012*perfect + 0.011*brick + 0.011*signatur + 0.010*kitchen + 0.010*serv + 0.010*japanes + 0.009*char + 0.009*present
18: chicago style hot dogs / smoking ?
0.136*hot + 0.050*dog + 0.037*chicago + 0.025*guac + 0.016*tempura + 0.012*cigar + 0.011*truth + 0.011*ideal + 0.010*pipe + 0.009*del + 0.009*capit + 0.009*generic + 0.009*creation + 0.008*tacki + 0.008*tucson + 0.008*style + 0.008*factori +
0.007*squash + 0.007*butternut + 0.007*lousi 19: ?
0.053*duck + 0.037*spring + 0.032*peanut + 0.027*yelper + 0.026*train + 0.024*pomegran + 0.021*hasn + 0.021*fellow + 0.019*trader + 0.018*eateri + 0.017*def + 0.017*butter + 0.012*cuban + 0.012*poblano + 0.011*colleagu +
0.071*pie + 0.046*crepe + 0.033*rosemari + 0.029*jam + 0.028*rosa + 0.025*appl + 0.024*inexpens + 0.023*meatbal + 0.022*nutella + 0.021*sprout + 0.019*snickerdoodl + 0.018*pistachio + 0.015*cilantro + 0.014*yogurt + 0.013*rustic + 0.012*banana + 0.012*thanksgiv + 0.011*subway + 0.011*exot + 0.011*lime
21: fancy dinner words / ositive
0.040*wine + 0.028*the + 0.027*dinner + 0.022*menu + 0.020*great + 0.018*restaur + 0.017*night + 0.016*servic + 0.013*dine + 0.013*excel + 0.013*glass + 0.013*enjoy + 0.012*experi + 0.011*food + 0.011*select + 0.010*date + 0.010*list +
0.009*special + 0.009*server + 0.009*buffet
22: repeat customer / positive
0.078*alway + 0.045*time + 0.029*food + 0.026*get + 0.022*love + 0.022*year + 0.019*good + 0.018*never + 0.018*the + 0.017*locat + 0.017*favorit + 0.017*servic + 0.016*great + 0.015*come + 0.014*one + 0.014*usual + 0.014*everi + 0.013*place + 0.011*eat + 0.010*friend
23: negative
0.015*one + 0.013*like + 0.011*get + 0.010*would + 0.009*even + 0.009*eat + 0.009*place + 0.009*want + 0.009*know + 0.008*ask + 0.008*star + 0.008*the + 0.008*could + 0.007*never + 0.007*order + 0.007*give + 0.007*say + 0.007*food + 0.007*ever + 0.007*and
24:
0.036*asada + 0.031*carn + 0.029*los + 0.028*prosciutto + 0.027*band + 0.020*pear + 0.020*fav + 0.018*cave + 0.018*kobe + 0.018*deseo + 0.016*creek + 0.013*cracker + 0.013*angel + 0.012*guacamol + 0.012*execut + 0.012*festiv + 0.012*champagn + 0.011*jazz + 0.010*eleg + 0.010*goat
25: seafood
0.086*boyfriend + 0.074*salmon + 0.059*sangria + 0.046*pesto + 0.034*sea +
0.034*ahi + 0.027*tuna + 0.019*smoke + 0.016*bass + 0.015*stingray + 0.015*scallop + 0.013*babi + 0.012*sirloin + 0.012*wasnt + 0.011*risotto + 0.010*baja +
0.009*cellar + 0.009*sandwhich + 0.008*flip + 0.008*prix 26: positive
0.119*great + 0.074*food + 0.060*place + 0.053*good + 0.043*servic + 0.040*the + 0.035*friend + 0.022*atmospher + 0.020*love + 0.019*staff + 0.018*realli +
0.018*nice + 0.015*price + 0.014*awesom + 0.014*back + 0.012*this + 0.012*lunch + 0.011*excel + 0.009*recommend + 0.009*definit
27: ambience / anecdote
0.016*citi + 0.015*upon + 0.013*ride + 0.011*charm + 0.009*photo + 0.009*pretenti + 0.009*oper + 0.009*chain + 0.009*trick + 0.009*histori + 0.008*overlook +
0.008*old + 0.008*million + 0.008*stumbl + 0.008*success + 0.008*travel + 0.007*fool + 0.007*afraid + 0.007*rais + 0.007*weekday
28: TexMex food / fruit
0.108*green + 0.087*chili + 0.047*fruit + 0.035*juic + 0.031*mahi + 0.027*patti + 0.023*queso + 0.022*lime + 0.021*chile + 0.018*denni + 0.017*southwest +
0.017*natur + 0.016*stew + 0.016*machaca + 0.014*mango + 0.013*swim + 0.012*yellow + 0.012*orang + 0.012*pineappl + 0.010*pic
29: Italian / Olive Garden
0.010*mike + 0.009*arugula + 0.009*microwav + 0.008*cross + 0.008*class 30: seafood / sushi
0.099*shrimp + 0.046*crab + 0.039*seafood + 0.032*lobster + 0.022*bobbi + 0.014*fusion + 0.014*oyster + 0.014*fish + 0.013*ginger + 0.012*sauc +
0.012*sashimi + 0.012*sake + 0.011*scallop + 0.009*shell + 0.009*sesam + 0.009*leg + 0.009*dumpl + 0.009*rub + 0.008*soy + 0.008*clam
31: fast food
0.112*fez + 0.043*hype + 0.042*chino + 0.032*bell + 0.028*pollo + 0.025*dough + 0.022*bandido + 0.021*chipotl + 0.017*mcdonald + 0.015*anim + 0.015*sick + 0.013*chimi + 0.013*ill + 0.012*stomach + 0.012*finger + 0.012*current + 0.011*golf + 0.011*ultim + 0.010*soggi + 0.009*hmmm
32: elp website + ?
0.059*yelp + 0.054*com + 0.041*http + 0.040*select + 0.039*www + 0.034*scottsdal + 0.028*biz_photo + 0.026*airport + 0.026*club + 0.023*steakhous + 0.022*chris + 0.020*weak + 0.013*impecc + 0.012*wiseguy + 0.011*brazilian + 0.010*blt + 0.010*factor + 0.009*spell + 0.009*bucket + 0.009*spotti
33: food / flavor / positive
0.027*the + 0.025*ice + 0.022*cream + 0.021*sweet + 0.021*potato + 0.018*perfect + 0.016*dessert + 0.015*tea + 0.014*chees + 0.012*flavor + 0.010*delici + 0.009*top + 0.009*serv + 0.008*for + 0.008*meal + 0.008*cake + 0.007*start + 0.007*also + 0.007*butter + 0.007*sauc
34: location / directions / anecdote
0.068*drive + 0.067*local + 0.040*street + 0.038*market + 0.034*dive + 0.031*across + 0.028*downtown + 0.023*citi + 0.018*support + 0.018*thru +
0.018*phoenix + 0.017*glendal + 0.016*ale + 0.014*joe + 0.013*car + 0.011*worthi + 0.011*draw + 0.009*wide + 0.009*client + 0.009*artist
35: holidays / ?
0.077*indian + 0.041*san + 0.035*philli + 0.034*christma + 0.031*breweri + 0.022*gal + 0.022*chilli + 0.022*hospit + 0.019*diego + 0.017*eve + 0.016*4th + 0.016*blu + 0.016*udupi + 0.016*juli + 0.015*aka + 0.015*barbequ + 0.014*dosa + 0.013*naan + 0.012*masala + 0.011*german
36: breakfast (positive)
0.090*breakfast + 0.052*egg + 0.028*coffe + 0.027*brunch + 0.025*morn +
0.022*bacon + 0.022*toast + 0.020*pancak + 0.017*the + 0.014*sunday + 0.012*omelet + 0.011*brown + 0.011*potato + 0.010*muffin + 0.010*wait + 0.010*french +
0.009*gravi + 0.008*scrambl + 0.008*good + 0.008*fresh 37: Comfort Food
0.084*sauc + 0.079*bread + 0.038*garlic + 0.038*bianco + 0.037*the + 0.028*dip + 0.022*fri + 0.021*chicken + 0.014*pepperoni + 0.013*good + 0.013*calamari + 0.012*order + 0.012*son + 0.010*batter + 0.010*spaghetti + 0.010*greas + 0.009*marinara + 0.009*hubbi + 0.009*tast + 0.008*got
38: dietary restrictions / ?
0.182*free + 0.073*guacamol + 0.058*pho + 0.039*irish + 0.037*gluten +
0.034*resort + 0.031*fajita + 0.026*wheat + 0.019*broth + 0.013*noon + 0.012*cow + 0.012*allergi + 0.012*marg + 0.012*same + 0.011*dairi + 0.011*fleme + 0.010*code + 0.010*grain + 0.009*tripl + 0.009*option
0.019*gnocchi + 0.019*memor + 0.018*partner + 0.017*fox + 0.014*funki +
0.014*greatest + 0.013*gay + 0.013*marri + 0.012*scrumptious + 0.012*quarter + 0.012*winter + 0.012*mariachi + 0.012*steal + 0.011*flower + 0.010*towner
40: Chinese food / Asian Food / flavor
0.057*chicken + 0.042*rice + 0.028*chines + 0.026*dish + 0.024*the + 0.022*soup + 0.022*food + 0.019*fri + 0.018*order + 0.016*spici + 0.015*sauc + 0.013*thai + 0.013*bowl + 0.012*good + 0.012*noodl + 0.010*beef + 0.010*veggi + 0.010*flavor + 0.010*like + 0.009*asian
41: Happy hour / deals
0.220*hour + 0.213*happi + 0.046*drink + 0.027*special + 0.023*price + 0.017*great + 0.017*appet + 0.015*half + 0.014*bagel + 0.014*menu + 0.013*deal +
0.011*margarita + 0.010*martini + 0.009*bar + 0.008*app + 0.008*good + 0.008*day + 0.008*they + 0.007*get + 0.006*tuesday
42: comfort food / burgers
0.168*burger + 0.127*fri + 0.026*the + 0.022*waffl + 0.018*good + 0.017*chees + 0.016*order + 0.015*potato + 0.014*hash + 0.014*bun + 0.013*sweet + 0.013*onion + 0.012*french + 0.012*bacon + 0.012*grill + 0.009*get + 0.008*hamburg + 0.008*they + 0.008*chicken + 0.008*also
43: hours of operation / visit logistics
0.026*lunch + 0.025*get + 0.024*time + 0.023*order + 0.015*place + 0.014*call + 0.014*day + 0.013*work + 0.012*open + 0.012*close + 0.011*take + 0.011*they + 0.011*one + 0.008*vegan + 0.007*sinc + 0.007*next + 0.007*make + 0.007*still + 0.007*week + 0.006*right
44: service / negative?
0.033*order + 0.019*came + 0.015*ask + 0.013*back + 0.013*got + 0.012*tabl + 0.012*didn + 0.011*server + 0.011*said + 0.011*would + 0.009*friend + 0.009*went + 0.009*one + 0.009*the + 0.009*meal + 0.008*waitress + 0.008*our + 0.008*time + 0.008*took + 0.008*she
45: fast food? / ?
0.051*jerk + 0.048*sub + 0.041*mill +