
University of Tennessee, Knoxville
Trace: Tennessee Research and Creative
Exchange
Masters Theses Graduate School
5-2014
A Nuclear Solution for the Energy Security
Vulnerabilities of the Department of Defense:
Using a Small Modular Reactor to Power Military
Installations
Margaret Alva Kurtts
University of Tennessee - Knoxville, [email protected]
This Thesis is brought to you for free and open access by the Graduate School at Trace: Tennessee Research and Creative Exchange. It has been accepted for inclusion in Masters Theses by an authorized administrator of Trace: Tennessee Research and Creative Exchange. For more information, please [email protected].
Recommended Citation
Kurtts, Margaret Alva, "A Nuclear Solution for the Energy Security Vulnerabilities of the Department of Defense: Using a Small Modular Reactor to Power Military Installations. " Master's Thesis, University of Tennessee, 2014.
To the Graduate Council:
I am submitting herewith a thesis written by Margaret Alva Kurtts entitled "A Nuclear Solution for the Energy Security Vulnerabilities of the Department of Defense: Using a Small Modular Reactor to Power Military Installations." I have examined the final electronic copy of this thesis for form and content and recommend that it be accepted in partial fulfillment of the requirements for the degree of Master of Science, with a major in Nuclear Engineering.
Laurence F. Miller, Major Professor We have read this thesis and recommend its acceptance:
Ronald E. Pevey, Eric Lukosi
Accepted for the Council: Dixie L. Thompson Vice Provost and Dean of the Graduate School (Original signatures are on file with official student records.)
A Nuclear Solution for the Energy Security Vulnerabilities of the
Department of Defense: Using a Small Modular Reactor to Power
Military Installations
A Thesis Presented for the Master of Science
Degree
The University of Tennessee, Knoxville
Margaret Alva Kurtts May 2014
Acknowledgements
I am grateful to the support, assistance and guidance of Dr. Laurence Miller at the University of Tennessee. I am also grateful for the loving support of my family: Robert, Bridget and Teresa.
Abstract
Due to its reliance on the civil electrical grid, the Department of Defense has significant energy security vulnerabilities. DoD does not have energy production capabilities within its organization necessary to sustain the operations of a military installation. Its current installation energy strategy is a combination of energy reduction measures and
renewable production efforts. Therefore, increased threats from cyber attacks combined with an aging electrical infrastructure threaten DoD’s energy supply to its installations. The electrical grid provides aggressors an opportune target for weakening military response capabilities in the event of a natural or man-made disaster. While DoD is successfully using energy more efficiently, it is failing produce power on the scale needed to secure its energy future.
This paper examines the Department of Defense energy security strategy and identifies a sustainable solution using nuclear power. The increased interest in Small Modular Reactor (SMR) Technology presents the Department of Defense with a power solution that is adaptable to military installation use. This paper examines potential SMRs for commercialization and use on a military installation. It identifies what reactor
characteristics are important to the Department of Defense and selects an SMR design to fit DoD’s energy needs. The paper then presents an implementation strategy taking into consideration the unique aspects of siting a small nuclear power facility on a military base. It presents financing options for the facility as well as addressing staffing and management considerations.
Small modular nuclear reactor technology is ideally suited to fill the supply voids in DoD’s energy security portfolio. Through the adoption of reactor technology, DoD not only secures its ability to respond to man-made and natural threats, but it also secures the future of the American people it protects.
Table of Contents
Chapter 1: Introduction ... 1
Chapter 2: The Department of Defense Energy Demand ... 4
Operational Energy ... 4
Installation Energy ... 5
Chapter 3: Department of Defense Energy Strategy ... 9
Energy Security Defined ... 9
Operational Energy Strategy ... 11
Installation Energy Strategy ... 13
Energy Laws and Regulations ... 13
Chapter 4: Energy Security Programs ... 15
Net Zero: Background ... 15
The Army Net Zero Program ... 16
Department of the Navy: Large Scale Renewable Projects ... 19
Chapter 5: Energy Security Program Analysis ... 21
Energy Security: A Problem Unchanged ... 29
Chapter 6: Finding a Solution to Energy Independence ... 32
The Sustainable Definition of Renewable Energy ... 32
DoD Redefining Renewable Technology To Meet Its Needs ... 33
Renewable and Sustainable: Nuclear Power ... 34
Learning from the Past: The Army Nuclear Power Program ... 37
Chapter 7: Small Modular Reactor: A New Era With an Advanced Solution ... 40
Light Water Reactors ... 41
High Temperature Gas Reactors ... 43
Liquid Metal and Liquid Salt Cooled Reactors ... 43
SMR Applications of Advanced Reactor Technology ... 44
Description of SMRs Considered ... 44
Light Water SMRs ... 45
Liquid Metal ... 52
Assessment of SMRs using Evaluation Criteria ... 56
Safety ... 56 Power Output ... 57 Physical Size ... 57 Refueling Cycle ... 57 Licensing ... 57 Pubic Acceptance ... 58 Fuel Costs ... 59 Maturity of Technology ... 59
Process Heat Applications ... 59
The Small Modular Reactor For DoD ... 59
Chapter 8: m2Power: A Military Modular Reactor to Meet DoD’s Needs ... 66
Power Output ... 66
Process Heat Applications ... 68
Physical Size ... 71
Mission Impact ... 73
Security ... 75
Reactor Accident Impact on Military Operations ... 76
Military Accident Impact on Reactor Operations ... 77
Manning and Management ... 79
Transportation ... 81
Spent Fuel Management ... 82
Chapter 9: Implementation Strategy Building From a Proven Concept ... 84
The Collaborative Team ... 86
Program Organization ... 86
Financing Considerations ... 89
Chapter 10: Conclusion and Summary ... 90
References ... 92
Appendices ... 97
Appendix A: Army Nuclear Power Program ... 98
Appendix B: SMR Design Assessments ... 102
mPower ... 102
NuScale ... 104
PRISM ... 106
4S ... 109
Reactor Assessment ... 110
Appendix C: Technology Readiness Assessment for DoD Power Reactor and Combined Heat and Power Facility ... 112
Vita ... 113
List of Tables
Table 1: Energy Policy Act of 2005 Renewable Energy Goals ... 13
Table 2: FY 2012 Progress Report ... 21
Table 3: DoD Energy Production as a Percentage of Consumption ... 27
Table 4: Installation Energy Demand Analysis ... 28
Table 5: mPower SMR LWR Design Characteristics[43] ... 48
Table 6: NuScale Reactor Characteristic Summary[44] ... 51
Table 7: SMR Assessment Criteria Rating ... 64
Table 8: Technology Readiness Assessment for mPower use on DoD Installation ... 85
List of Figures
Figure 1: DoD Facility Energy Consumption and Cost[4] ... 7
Figure 2: DoD Facility Energy Consumption by Type[4] ... 8
Figure 3: Projected Growth in building energy use relative to other sector[12] ... 15
Figure 4: Army Net Zero Pilot Installations[15] ... 17
Figure 5: Net Zero Energy Hierarchy ... 18
Figure 6: Geothermal Plant at China Lake, CA[4] ... 20
Figure 7: FY12 Energy Project Appropriations[4] ... 22
Figure 8 Progress Toward Facility Energy Intensity Reduction Goals[8] ... 23
Figure 9: DoD Energy Efficiency Projects ... 25
Figure 10: Optimal Repayment Schedule For Efficiency Projects ... 26
Figure 11: FY2012 Utility Outages Lasting Longer Than 8 Hours[4] ... 29
Figure 12: Use of Renewable Energy as a Percentage of Electricity Use[8] ... 30
Figure 13: DoD Renewable Energy Projects by Type[4] ... 33
Figure 14: Ohio Class Submarine USS West Virginia [27] ... 35
Figure 15: AREVA La Hague Reprocessing Facility in France[29] ... 36
Figure 16: Smog Surrounding 2008 Olympic Facilities in China[31] ... 38
Figure 17: NuScale SMR LWR Concept[36] ... 42
Figure 18: Babcock and Wilcox mPower SMR[42] ... 46
Figure 19: B&W Coolant Flow Diagram[42] ... 47
Figure 20: NuScale DHRS[36] ... 49
Figure 21: NuScale ECCS[36] ... 50
Figure 22: 12 Module NuScale Reactor Facility Layout[36] ... 52
Figure 23: PRISM Coolant Loops and Balance of Plant[38] ... 53
Figure 24: 4S Fuel Pin Configuration with Gas Plenum[39] ... 54
Figure 25: 4S Passive Reactor Safety Systems IRACS and RVACS[39] ... 55
Figure 26: Coated Particle Fuel Development Lab at ORNL ... 60
Figure 27: Joint Network Node[47] ... 61
Figure 28: Select Installation Power Demands (MW) FY 2012 [4] ... 67
Figure 29: Chemical Production Process Heat Requirements [52] ... 69
Figure 30: Considerations for reactor placement; military helicopter training [60] ... 73
Figure 32: Paladin Weapon System[62] ... 78
Figure 33: Nuclear Energy Workers From Duke Energy[63] ... 80
Figure 34: Fuel Casks Being Shipped By Rail[30] ... 82
Figure 35: Dry Cask Storage for Spent Fuel[30] ... 83
Chapter 1: Introduction
Over the last decade, the threats to national security underwent a dramatic transformation. In addition to threats from direct aggressors such as those faced at Pearl Harbor or during the Cuban Missile Crisis, security professionals now face threats from a less overt enemy. A complicated network of loosely aligned, ideologically motivated activists, defines the threat environment today. At times these individuals act solely in support of their cause. In other situations, ideologues are used as weapons in a larger, state supported form of 21st century Cold War. While the threat of conventional terrorist attacks, such as the events of 9/11 or the Boston Marathon Bombing (2013), are still real and present, a more insidious and pervasive threat targets the national infrastructure. A new and dangerous weapon in the world of national security is the threat from cyber attacks.
In the 2010 Quadrennial Defense Review, Secretary of Defense Robert Gates described structuring the United States Military in order to be prepared to respond to the
complicated security environment of the 21st century.
“We must prepare for a broad range of security challenges on the horizon-ranging from the military modernization programs of other countries to the non-state groups developing more cunning and destructive means to attack the United States and our allies
and partners.”[1]
State and non-state actors realize that Americans enjoy a sense of security stemming from its physical isolation. America has clearly defined boarders and shares ideological ties with its neighbors to the North and South. Oceans separate Americans from the upheaval felt in volatile nations of Southeast Asia and the constant geopolitical uncertainty in Western Europe. The American sense of security is misplaced. The world is truly
interconnected. Oceans or fences no longer deter the threats to America. Terrorist groups travel easily across boarders or make attacks from remote locations with a computer and an Internet connection. Terrorists now target America by attacking its infrastructure networks. These attacks can be physical but more often are cyber based. Automation pervades society. The daily lives of Americans revolve around the use of technology for
even the most basic transactions. At the individual level, actions such as buying fuel for a car, picking up milk at the store or paying a mortgage payment are all done via digital transaction. On a community level, daily operations are equally automated.
Communities use automation to dispatch emergency services, warn residents of
threatening weather conditions and maintain a constant electrical supply. The increased automation in society promotes a feeling of security that stems from an expectation of quick and immediate reaction to problems of all kinds. However, Americans were stunned in 2013, when thousands fell victim to a cyber attack on the retail chain Target that resulted in loss of personal banking information. The size and scope of the attack were shocking, in part because Americans relied on a misplaced sense of security. As Secretary Gates noted, the Department of Defense is fully aware of the changing nature of the threat to national security. In an effort to combat this threat, DoD is moving aggressively to protect itself from cyber attacks. In 2010, DoD established US Cyber Command (USCYBERCOM) to specifically combat these threats. DoD utilizes extensive security protocols for communication and information transfer. It maintains and operates over 15,000 different computer networks across 4,000 military installations worldwide. Daily, DoD personnel use over seven million computers and telecommunications tools.[1]
Yet at home, DoD still relies entirely on the civilian power grid to provide sustaining electricity to its computer networks. Despite having an extensive network security system, any operation can be brought to complete stop by simple removing its power source. Without electrical power movement orders, resupply requests and battlefield tracking all stop. The civilian power grid provides aggressors a way to directly influence the response capability of the US Military without directly attacking it.
DoD defines threats to its energy supply as threats to its energy security. Over the last decade, DoD has tied energy security and climate change together. It sought solutions through a reduction and optimization of energy use. It sought energy independence using renewable energy projects. Each year, the Department of Defense directs billions of
dollars toward increasing its energy efficiency in order to establish a more robust energy security posture.
The purpose of this paper is to propose a new approach to installation energy security using a nuclear small modular reactor (SMR) solution. This paper first examines the current DoD energy security strategy with a focus on installation energy security. It analyzes the combination of reduction initiatives and renewable production measures to determine if DoD is successfully securing its installation energy needs. The paper reveals a significant gap between the reduced energy demanded by DoD and the power that is supplied by its renewable energy projects. To fill the energy demand gap, the paper proposes the use of a small modular nuclear reactor. After a brief overview of SMR technology, the paper compares four proposed SMR designs and evaluates them for use on a military installation based on reactor characteristics. It then proposes an
implementation strategy detailing how to most effectively utilize SMR technology to meet the energy demands of a military installation. The implementation strategy includes detailed siting considerations based impact to mission performance. A staffing solution is proposed that combines internal military nuclear specialists with external reactor
operators. Finally, a technology readiness assessment is used to identify the steps still required to implement a nuclear reactor energy security solution.
Chapter 2: The Department of Defense Energy Demand
The mission of the Department of Defense is “to provide the military forces needed to deter war and to protect the security of our country.”[2] The structure required to support the mission is enormous. DoD employs over 2.1 million military and civilian personnel who operate from several hundred thousand buildings located at one of over 5000 different locations. The total geographic footprint of DoD is over 30 million acres of land.[2] As such, DoD has at its command human and physical resources that rival all private sector organizations. DoD is one of the largest departments of the United States government. Furthermore, the US spends more than any other nation-state on defense, committing 4.4% of its annual GDP on DoD.[3]
In order to meets its mission, DoD works to efficiently allocate and properly locate of its resources to facilitate swift and effective responses to threats to national security. Doing so requires incredible amounts of energy. In 2012, DOD spent a total of $20B on energy. DoD used the energy purchased for a wide range of applications from fueling vehicles to powering installations. The majority of use was for powering tactical equipment in the form of operational energy. Of the total energy consumed, 26% went toward use within buildings or installation power.[4]
Installation energy is the power needed to maintain the base infrastructure. Installation energy is primarily sourced from local commercial power distributors who sell to the DoD facility like any other customer. Operational energy is used to project forces forward on the battlefield. Operational energy comes in many forms. Petroleum is the largest form of operational energy used in DoD. DoD uses petroleum fuels to fly aircraft, power boats, drive vehicles and run generators. Other sources of operational energy include the nuclear power used on naval vessels and battery power for individual soldier equipment.
Operational Energy
DoD is heavily dependent on petroleum as its main fuel source for operations. In 2011, DoD used 116.8 million barrels of fuel (mbbls) at a cost of $17.2B. In FY 13 DoD
budged $16.3B (104 mbbls) for fuel purchases.[5] DoD has long recognized over-reliance on petroleum-based fuel products is a significant threat to operational force projection. DoD is actively seeking alternative fuel sources. In FY13, DoD allocated $1.6B for operational energy initiatives, including research and development into alternative fuel sources for both Naval and Air Force equipment. The Navy is exploring options to replace diesel with biodiesel in its petroleum-powered vessels. The US Air Force is looking for alternative fuels for jets and cargo aircraft. In the FY13 Operational Energy Budget Certification Report, Sharon Burke, the assistant Secretary of Defense for Operational Energy Plans and Programs, expressed significant concerns for all
departments of the military and their lack of “systems and tools required to incorporate energy security considerations in to their requirements and acquisition processes” All three major components lacked the ability to forecast into their acquisition programs the requirements needed to meet energy security needs. [6]
Installation Energy
DoD installation energy demand in FY2012 was 215 trillion BTU, which represents about 1% of the total US commercial sector energy consumption.[4] Unlike the operational energy needs, installation energy is used across the DoD vast physical footprint with the mission of sustaining, training, and equipping service members in preparation for their various military missions. DOD utilizes its installations in a variety of ways.
• Training: One of the single most important functions of military installations is to
provide service members a place to conduct training on their specific set of skills. Given that military service members use a skill set that is unique to their
organizations, the Department of Defense must have specialized locations to conduct training. For example, large plots of secluded land are required to conduct training on weapons systems larger than small arms. These types of systems include explosives, missiles, radar systems and many other large-scale weapons. DOD establishes a geographic footprint that allows its employees to train on the use of these weapons while keeping the civilian population safe from their effects.
• Operations: The operational infrastructure of DoD is vast. Traditional operational
units such as Army brigades or Air Force Squadrons require a footprint from which to plan their training, manage their people and prepare for deployed
operations. Command and control centers exist throughout the military providing continuous oversight of and communications capabilities for forces deployed and abroad. The command and control infrastructure of DoD requires continuous power supplies and communications channels to monitor operations worldwide and to be prepared to respond to national security threats.
• Sustaining: There are two major components to sustaining DoD forces;
Equipment Sustainment and Manpower Sustainment
o Equipment sustainment. This includes scheduled services and
maintenance as well as unscheduled repairs. The specialized equipment within DoD requires specialized facilities to conduct maintenance on equipment. The spectrum of equipment in need of maintenance is broad ranging from a Nimitz class aircraft carrier to an F18 fighter to an M4 Carbine rifle. All of these items require continuous support and maintenance to stay operational and DoD must have the infrastructure network to support that maintenance.
o Manpower Sustainment. Sustaining the employees of DoD includes a variety of infrastructure demands. Many service members and their families live on military installations. Housing for these individuals includes single-family homes, duplexes and barracks for single soldiers. In addition, the military has temporary housing for service members conducting training away from their home installations. To support the military manpower, there are extensive health and dental facilities as well as educational resources for employees and their families.
• Projection: DoD meets national security threats outside the contiguous United
States by projecting forces onto the battlefield. It does this primarily through sea and air projection as a first step and then land projection. Moving forces from stateside operations via land or air requires projection platforms be situated and postured for movement. Infrastructure that supports these types of movements is naval stations and air bases. These facilities are geographic cache of logistical supplies needed to move operational units forward from the United States to face threats in other places.
In 2012, DoD spent $3.8B on electrical power, heat and cooling for facilities. DoD consumed 215,100 BBtu (billion British thermal units) of energy requiring approximately 7 GW of power production.1 The largest consumer of facility energy within DoD is the Army, which accounts for 37% of the total facility energy consumed.[4]
Figure 1: DoD Facility Energy Consumption and Cost[4]
80% of the facility energy consumed by DoD goes toward natural gas and electricity. This is primarily used for power, climate control and water heating.
Figure 2: DoD Facility Energy Consumption by Type[4]
When looking across the spectrum of DoD fixed installations, there is a wide range in the amount of energy demanded. The demand is primarily influenced by the size of each installation, the environmental conditions surrounding the installation, its departmental mission and the square footage of buildings requiring energy. Thus DoD categorizes its energy usage using energy intensity. Energy intensity is measured in billion British thermal units per gross square foot of facility space (BBtu/Gsf). In an effort to identify the most energy consuming facilities, DoD began an aggressive campaign in FY2010 to monitor and track energy consumption at the installation level rather than as an aggregate whole. By measuring energy consumption at the installation level, DoD gained a more specific understanding of its energy uses and needs. For example, a small Naval Air Station in the Florida Keys will have a different energy consumption profile than a garrison army base in Fort Wainwright, Alaska. A large Air Force basic training facility in Texas will consume energy differently than Twenty Nine Palms, a remote weapons testing facility in the California desert. This data allowed planners to develop targeted energy reduction plans for each facility based on consumption, number of facilities, mission and the environment.[7]
Chapter 3: Department of Defense Energy Strategy
“Sustainability is not an individual Departmental program; rather it is an organizing paradigm that applies to all DoD mission and program areas”[8]
The Department of Defense outlines its strategic goals as an organization in the
Quadrennial Defense Review Report. The latest report was published in February 2010 (QDR 10). In that report, DoD specifically addresses energy security as “having assured access to reliable supplies of energy and the ability to protect and deliver sufficient
energy to meet operational needs.” [1] Further, DoD links, climate change and energy
security. It devotes considerable effort to increasing its energy security by reducing its environmental impact. Infrastructure (installation) and operational energy efficiency programs are foremost in DoD’s energy security strategies including alternative fuel sources, less pollutant fuel sources and the identification of new fuel-free technology. Domestically, DoD is looking to balance energy usage and production through reduction efforts as well as production initiatives. These efforts must be conducted without
sacrificing the mission capabilities of an installation. [1] Energy Security Defined
Energy security for the Department of Defense means always having an available supply of energy to conduct operations. Without power to conduct operations, the Department of Defense assets are useless. Energy is needed to maneuver, command and communicate and is essential to every element of every military operation. The energy itself is derived from many sources such as petroleum to power vehicles, aircraft and generators. It can also come from local commercial providers in the form of grid electricity and natural gas. One of the largest threats to energy security for DoD is its dependence on fossil fuels, particularly in operations. In the missions in Afghanistan and Iraq, for example, fuel convoys were essential to support operations and fuel trucks were literally everywhere. Attacks on these convoys caused significant delays and disruptions of the operational fighting capabilities of forces on the ground. [8] In addition, simply acquiring and
moving the petroleum to the necessary general location is often challenging as worldwide petroleum distribution networks are at increased risk for attack. Shipping lanes
transporting bulk oil to refineries face disruptions at choke points such as Strait of
Hormuz and Straits of Malacca. Pirates, regional political instability and military actions all threaten shipments of petroleum worldwide. Such instability can lead to drastic price fluctuations in the cost of oil. To counter instability in the petroleum market, DoD has chosen to acquire and store vast amounts of petroleum reserves.[8]
Energy vulnerabilities also exist within the U.S. Most electrical power and natural gas for fixed installations in the U.S. is sourced from local commercial suppliers. As Dr. Dorothy Robyn, Deputy Under Secretary of Defense for Installations and Environment acknowledges:
“Facilities energy is critical to mission assurance. Our fixed installations support combat operations more directly than ever before, and the serve as staging platforms for humanitarian and homeland defense missions. These installations are largely dependent on commercial power grid that is vulnerable to disruption due to aging infrastructure, weather-related events and a potential kinetic or cyber attack.”[8]
Military installations at home provide not just housing for service members and storage for equipment. They provide key strategic staging locations for military force projection operations in the form of railheads and runways. Installations are an essential network of communications, command and control centers providing real time monitoring of defense operations worldwide. Installations are staging locations for disaster relief efforts
following local natural disasters such as Hurricane Sandy and Hurricane Katrina. Yet these facilities are all vulnerable because they depend almost entirely on external sources of energy. In the event of a natural disaster or even just a simple outage, military
installations must wait, like any other customer, for the utility to restore power. Some critical systems have backup generators that provide short-term power in these situations. These generators are limited in number and cannot be expected to run for extended operations.
It is important to note that physical threats to the electrical grid impact not only DoD installations but the general public as well. For example, an April 2013, an attack on a California power transmission substation highlighted the vulnerabilities of America’s
power gird. During the 19-minute attack, assailants fired bullets into transformers that supplied power into Silicon Valley. The electric company was able to reroute power to prevent a blackout however the repairs to the substation took 27 days. Even more alarming was the relative ease with which the attackers executed the assault. The weapons used were not sophisticated. They faced no resistance or security at the substation. The assistants were able to methodically execute their attack exactly as planned with no interference from either the power company or local police agency. Across America, the electrical grid is no different from this California transmission station. Should America’s enemies seek to cripple the military infrastructure, the power network used to sustain an installation is an excellent domestic terrorism target. [9] Additionally, there are ever increasing concerns about the potential for a cyber attack on our nations electrical grid. A recent article by Dan Weissman of NPR describes an electrical grid security exercise conducted by North American Electric Reliability Corporation (NERC) called Grid Ex 2013 that took place in November of 2013. More than 2000 utilities workers, regulators and law enforcement officials participated in the exercise. While the results of this exercise have not yet been published, it is important to note that American utility companies are taking the treat of cyber security and kinetic attacks to the grid very seriously. Exercises such as this help to bring to light the true nature of our society in the event of a prolonged power outage.[10] In the event of a cyber or kinetic attack on the nations electrical grid, the military would be called upon to exercise its homeland defense mission and act as a staging location for relief and repair efforts. Unfortunately, due to its own dependence on commercial power, it is likely that military forces will be just as helpless as the average citizen in such a crisis.
Operational Energy Strategy
The three key operational energy goals of DoD were outlined in the May 2011 Operational Energy Strategy. [11]
1. More Fight, Less Fuel: Reduce the demand for energy in military operations
2. More options, less risk: Expand and secure the supply of energy to military operations.
3. More capability, less cost: Build energy security into the future force. The total budget for operational energy from FY13-17 included $9.0B for operational energy programs outside the purchase of bulk fuel. Of the $9.0B, 92% of the budget is directed toward research, development, testing and procurement in support of energy initiatives. 90% of the energy initiatives are specifically focused on demand reduction solutions. This results in $8.1B between FY2013 to 2017 being used to find technology to help reduce demand.[6]
However, $8.1B represents a fraction of the money projected to be spent on bulk fuel purchases. Using the fuel purchase projections from FY2013 OE Budget Cert Report and accounting for an estimated reduction in use of 5%, the total number of barrels of fuel purchased between FY13-FY17 will be 384.8 mbbls at a cost of $56.7B ($3.51 a gallon).2 DoD acknowledges the enormity of the energy resources:
“Our [energy] posture is imposing costs at all levels, strategic, operational, tactical and financial.” S. Burke, the Assistant Secretary of Defense for Operational Energy Plans and Programs [8]
The force projection capabilities of the US Military rely almost entirely on the use petroleum based fuel products. A significant technological shift is required to find alternative fuel sources for equipment such as helicopter’s, aircraft and tanks which rely heavy on combustion of petroleum fuel for power. In the 1950s, the Navy made a technological leap forward in reducing fuel costs by switching to a nuclear powered vessel. Possible alternatives being explored are hydrogen-powered vehicles and battery-powered vehicles. The Department must be careful when looking at alternatives that it does not sacrifice its force projection capabilities in the name of energy efficiency. Petroleum is a reliable, portable and powerful source of fuel. Yet it is also limiting in that it is expended quickly and requires an extensive supply chain. However, until technology
2
5% was chosen for a percentage reduction based on a projection report from the FY12 Operational Energy Annual Report. This report predicted a reduction of 5% from year FY13-14. I applied this reduction annually. The projection is purely an approximation. Factors such as the price of oil, the nature of military conflicts abroad and actually effectiveness of demand reduction initiatives will all impact usage.
evolves to replace petroleum, the Department of Defense looks to simply build
efficiencies into the current combustion technologies. While this efficiency will reduce the amount of operational energy used, there will not be significant reductions unless the base use of combustion power is changed.
Installation Energy Strategy
In an effort to reduce its vulnerability to energy supply disruptions, DoD is focusing on reducing its energy consumption through conservation and improved efficiency. More than $1.1B has been budgeted for energy conservation improvements to buildings. Upgrades to facilities include measures such as replacing windows, updating HVAC systems and improving lighting.
Additionally, DoD is looking at ways to produce its own energy on-site. On-site energy production is a key element in reducing the energy security vulnerabilities within DoD in the event of a commercial grid collapse or outage. Recognizing that energy independence is critical to ensure operational security, DoD is analyzing the feasibilities of various renewable energy sources coupled with the use of “micro-grid technology” to control and store on-site energy.[8]
Energy Laws and Regulations
The Energy Policy Act of 2005 sets goals for annual energy consumption guidelines, which increase the usage of renewable energy sources for all federal facilities and
agencies. Table 1 shows the required amount of energy consumed by federal agencies to come from renewable sources.
Table 1: Energy Policy Act of 2005 Renewable Energy Goals
Year Percent Consumption from
Renewables
FY07-‐09 3%
Additionally, the Energy Independence and Security act of 2007 (EISA 2007) and Executive Order 13423 (Strengthening Federal Environmental, Energy and Transportation Management) combine to set further goals for federal agency
consumption resulting in a 30% decrease by 2015 and an increase in renewable energy source consumption of 7.5% by FY2013. The regulations outline practices to enhance energy conservation and require the complete metering of all federal facilities for natural gas and electricity by given target years. Further, all new buildings must be constructed in accordance with energy efficient standards and equipment purchased for federal buildings to be energy efficient. Finally, by 2025, Federal regulations (10 U.S.C§2911e) requires 25% procurement of energy from renewable sources.[7]
Chapter 4: Energy Security Programs
Net Zero: Background
DoD is not conducting its research and implementing its energy programs in isolation. As early as 2006, the National Renewable Energy Laboratory (NREL), working with the Department of Energy, began using the term Net Zero to describe buildings and building construction that met certain characteristics related to cost effective, reduced energy use (NZEB). [12] According to the NREL, 40% of the primary energy used in the United States goes to commercial and residential buildings. 70% of the electricity used goes to these buildings. Due to increasing technological demands, the demand for electricity is only expected to rise in the future years. Figure 3 shows NREL’s estimate for the project grown in building energy consumption by sector.
Figure 3: Projected Growth in building energy use relative to other sector[12]
Nested under the concept of reducing the negative impact of energy production, the NREL sought to find ways to reduce building energy consumption by promoting NZEBs. NZEBs are buildings that significantly reduce their energy consumption needs through technologically efficient upgrades, behavior modification and the use of renewable
energy. Significant effort went into actually defining and categorizing the energy use of a building as well as working to reduce consumption through efficiencies. To reach Net Zero, companies are encouraged to first focus on demand reduction because this is most cost effective. Only once demand has been appreciably reduced does the company began pursuing renewable energy supply options. [12]
NREL’s study, Lessons learned from Case Studies of Six High-Performance buildings,
discussed the efforts to take six commercial buildings and make them NZEB. [13] The results were mixed. The study demonstrated that while technology can reduce energy costs, achieving Net Zero is very difficult. All six buildings used more energy than anticipated and produced less than anticipated. Failure to reduce energy usage was attributed to a number of factors including an overly optimistic projection about the ability to modify energy usage behavior of individuals. Additionally, some concepts such as day lighting failed to provide adequate lighting causing an increase beyond prediction of electrical lighting. Energy usage from plug loading was higher than forecast. There was also failure on the supply side of the model. Photovoltaic (PV) energy production was less than models forecast. Overall the study learned that there is no single solution to making a building reach Net Zero energy balance and it takes a whole building approach to solve the problem.[13]
The Army Net Zero Program
Since DoD is the largest energy consumer in the US government, [14] it and DoE began a joint initiative in 2008 to study the energy use of the military and identify methods for reducing demand and increasing use of renewable energy. The NREL conducted the study and used Marine Corps Air Station Miramar as its prototype installation. Based on that study, the NREL issued Net Zero Energy Military Installations: A Guide to
Assessment and Planning as a guide for the implementation of an energy conservation
strategy for a military installation.
A key factor to strategy development is recognizing some of the unique constraints of a military installation. A primary consideration is project and mission compatibility. Under no circumstances can an energy reduction project hinder the accomplishment of a
military mission. Thus special understanding of military operations is necessary in order to find the right solution for each installation. For example, at an installation with high levels of fixed or rotary wing aircraft traffic, one would not want to provide additional energy via wind turbine power as these devices present obstacles to air movement. The impact on the security of the installation is another key factor. Ideally the power generation source would be located on the installation premises. This increases
installation security as the logistics support for the power facility is contained within the parameters of the installation. An off-site power source forces the installation to be dependent on either a commercial electrical grid or constant supply lines such as fuel tankers. Installation environment will also play a role site selection and strategy. Military installations exist in a wide variety of climates so there is no single solution for all installations. Additional considerations include economic factors such as life cycle costs, storage costs and technology maturity. [14]
In 2011 the Army initiated its Net Zero Pilot program on 17 installations. Under this program, selected installations were provided assistance in achieving Net Zero in energy, water, waste or a combination of the three. In this paper, the focus will be on the Net Zero Energy programs rather than waste or water program. Figure 4 shows the locations of these installations and their Net Zero program
The Army Net Zero Energy goal is for an installation to produce as much energy as it uses. Within its pilot installations, the Army has made considerable effort to reduce energy demand. NREL theorizes that the most economic way to reach Net Zero energy is to reduce energy demand. Behavior modification accomplishes demand reduction without the need of capital expenditures and the use of energy efficient technology. [14] NREL calls upon installation leaders to find “opportunities for procedural, behavioral, process and operational energy saving actions (relying) on engaging the attention and creativity of personnel.” [14]
Figure 5: Net Zero Energy Hierarchy
The Army has taken this suggestion as its first and primary step to reaching a Net Zero energy security solution. Figure 5 illustrates the Net Zero Hierarchy. [14] The Energy Engineering Analysis Program conducted energy surveys of the pilot installations to determine baseline energy needs and identify inefficiencies in energy usage. [14] Energy surveys led to the development of the Army Meter Data Management System, which monitors installation energy usage at the individual building level and helps installation, appointed energy managers find solutions to energy waste at their location. The Army also built a robust staff of energy managers who monitor energy usage at each installation and provide reporting through the Army Energy and Water Reporting System. New buildings are required to following construction guidance with the aims of making them as energy efficient as possible. An award and recognition system was developed to recognize installation leaders who were innovators in energy reduction. These are all examples of procedural and policy measures aimed at simply reducing consumption. [16]
Additional energy reduction measures under Net Zero include building modernization projects. Improvements to HVAC systems, lighting systems, use of LED lights and improved control systems all helped reduce energy waste on military installations. Bases use thermal imaging technology to develop a building thermal envelope and find where buildings lack insulation. Energy managers improve control systems to allow for a more efficient use of building systems such as precooling buildings, automating lighting operations and optimizing the use of fans and blowers. [15] Many of these projects are paid for with all up front capital cost deferred from the military using unique financing options. One finance option is a utility energy service contracts (UESC) where a utility pays for the upfront capital costs of the project and is then repaid by the energy savings generated by the improvements. Energy saving performance contracts (EPSC) are arrangements between the Army and an energy service company where the company analyzes, develops, funds and manages energy savings projects and is repaid by the energy saved. [15]
The Army is aggressively pursuing a number of micro power renewable energy projects on its pilot installations. Most projects are solar photovoltaic projects producing between anywhere between 0.10 to 10 MW of energy. Most projects are small in scale and used to power outdoor lighting or heat water. Some projects use installation waste to produce energy to augment the base. The most successful installation is Fort Carson, which gets 3.5% of its total energy from renewable sources. [15]
Department of the Navy: Large Scale Renewable Projects
The Navy’s renewable energy program results in the production of 20% of the Navy’s electricity being produced from renewable sources, the majority from two large-scale projects: a 270 MW geothermal station at China Lake, CA and the Norfolk Naval Shipyard solid waste project in Portsmouth VA.
Figure 6: Geothermal Plant at China Lake, CA[4]
The China Lake Project produces 77% of the Navy’s total renewable energy and the NNSY solid waste plant produces 20%. At both facilities, the electricity produced is sold to the local utility and not used by the installation. Because it is not consumed by the installation, it is not counted toward the EPA 2005 act goal of consuming 7% of all electricity from renewable sources by 2013. [7]
Chapter 5: Energy Security Program Analysis
In addition to analyzing energy security in terms of reducing greenhouse gases and conservation, an assessment of security of supply and reliability of supply of energy is also necessary. To achieve energy security, DoD key infrastructure must have a constant supply of energy regardless of the source or the situational environment. This section provides an analysis of energy source and reliability of energy source in order to frame the effectiveness of DoD’s various energy programs in terms of energy security.
1. Will DoD meet its regulatory and legal energy efficiency requirements? 2. How effective are the energy reduction measures at optimizing the energy
need by DoD to operate?
3. How effective are the renewable energy measures at producing a reliable source of power that meets the operational needs of an installation?
1. Will DoD meet its regulatory and legal energy security requirements?
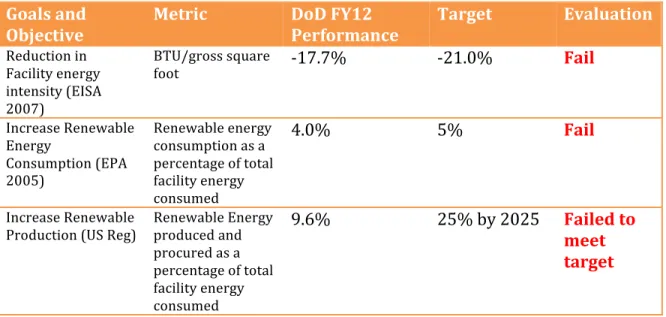
DoD established a timeline to meet its legally mandated energy security targets. This is the most basic metric of program evaluation in that it is a known and established metric for DoD to meet. Table 2 illustrates DoD’s internal analysis on its progress towards meeting its energy security goals. [4]
Table 2: FY 2012 Progress Report
Goals and
Objective Metric DoD FY12 Performance Target Evaluation
Reduction in Facility energy intensity (EISA 2007) BTU/gross square foot -‐17.7% -‐21.0% Fail Increase Renewable Energy Consumption (EPA 2005) Renewable energy consumption as a percentage of total facility energy consumed
4.0% 5% Fail
Increase Renewable Production (US Reg)
Renewable Energy produced and procured as a percentage of total facility energy consumed
9.6% 25% by 2025 Failed to meet target
Table 2 illustrates the DoD is not on track to meet any of its energy security goals. It is not in compliance with US law and regulation. The most significant failure is its goal to increase renewable energy production to 25% by 2025. Currently DoD is well below its target metric to be on track to meet that goal. Without a significant change in its
renewable energy production category it will not meet the goal.
2. How effective are the energy reduction measures at optimizing the energy need by DoD to operate?
There are two variables in evaluating this metric; optimal energy consumption and cost of optimization. The first is the effectiveness of the energy reduction measures to reach optimal consumption levels. In order to achieve energy security, DoD needs to be using its energy in the most efficient ways. Figure 7 shows that 91% of DoD’s energy project appropriations are aimed at reducing energy use.
Figure 7: FY12 Energy Project Appropriations[4]
Internal analysis from the Department shows that it does not forecast meeting this requirement. DoD argues a more realistic goal would have allowed for smaller target percentages earlier on in the program to allow for time for funding, design and
implementation of energy efficiency projects. It expects to meet the 30% goal by 2020 instead of 2015.[8]
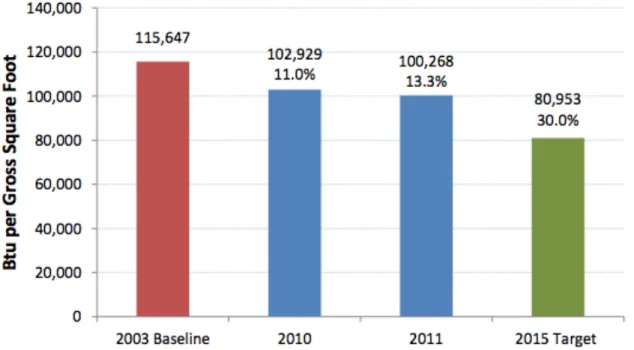
Figure 8 shows DoD’s progress in reducing its energy intensity footprint in order to meet the goals outlined in EISA 2007. Currently DoD must reduce energy intensity at a rate of 3% per year in order to meet the goal 30% reduction by 2015.
Figure 8 Progress Toward Facility Energy Intensity Reduction Goals[8]
While the Department has failed to meet the targeted reduction goals necessary to meet its targeted 30% reduction goal, it has been successful in reducing its installation energy use. It has instituted a robust system of procedural and technical tools to monitor consumption. EISA 2007 mandates a 30% reduction. This level of consumption might not be the optimal level of consumption for an origination as large and diverse as the Department of Defense. It has a unique mission and utilizes one of kind equipment in its day-to-day operations. It operates in a wide variety of physical environments.
Understanding its constraints and having accurate systems to measure consumption will allow DoD to establish its own estimate for optimal consumption levels. Further analysis is needed to determine the optimal level of energy consumption for DoD that may differ from the mandated 30% reduction. Despite not meeting its goals, the Department has been effective at curbing energy use.
The second measure of the energy reduction programs is cost versus return on optimization. However, this measure is difficult to quantify. By using an energy
performance savings contracts (EPSC) or utility energy service contracts (UESC) much of the up front cost is assumed by a contractor or utility. EPSC and UESC pass the cost of the project to the contractor or utility that is then repaid by the energy savings
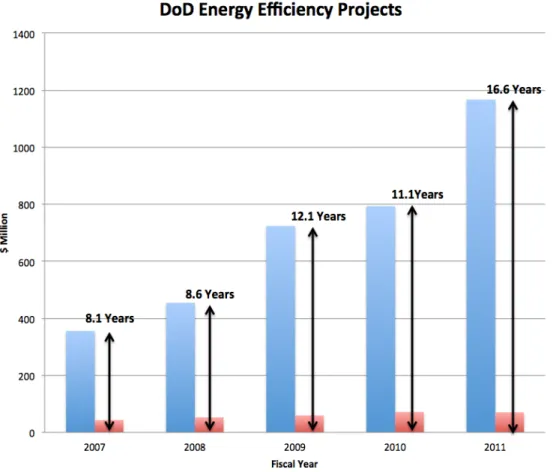
produced. DoD’s costs relating to these projects are deferred yet they are very real. While DoD has little to no upfront expense, it also does not recognize any gain until the contractor or utility has recouped its costs. An installation experiencing a demand reduction will pay a reduced power bill. The difference however, between the reduced bill and the old bill, is paid to the contractor. Thus, DoD does not actually recognize any savings until the contract is completely recouped, which could be years or even decades later. During that time, many systems will require routine repair and upgrades; those costs are passed on to DoD, but again, any benefits are not recognized until much later. In order to accurately analyze the cost effectiveness of energy reduction measures, all it is useful to assume to be incurred by DoD regardless if they are a direct procurement or on a delayed UESC/EPSC payment plan. Figure 9 illustrates the annual expense of energy efficiency investments (direct, EPSC, UESC) verse the annual energy savings from the projects FY2007 through FY2011.3 Energy savings estimates came from either actual savings, in BBtu, or those projected by the contract if actual savings was not reported. Using the average cost for a BTU of energy during the specified fiscal year was to calculate the total savings from the energy efficiency projects.
Figure 9 contrasts the expense with the anticipated annual return from the projects. Expenses include the amount of money either directly appropriated or awarded through UESC and EPSC during each fiscal year to energy reduction measures. Returns are based on the anticipated savings (in Bbtu) estimated by the contractor.4 Assuming that the savings realized from the project meet the anticipated goals, Figure 9 illustrates how long it will take each year’s group of projects to pay for themselves. Amortization of the
3
The data for figures 9 and 10 are from the Annual Energy Management Reports FY2007 to FY2011. 4Conversion of returns from Bbtu to dollars was done using DoD’s average price per Btu for the given fiscal year.
project cannot be done without knowing their expected life cycle. Thus, returns on a project in the form of reduced energy cost will only be recognized once it has paid its capital costs.
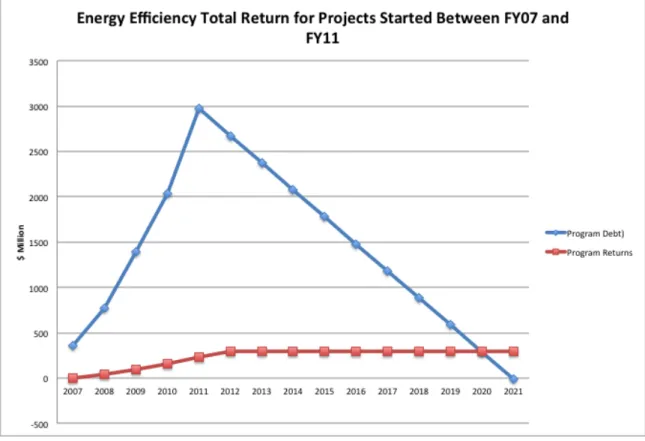
Figure 10 looks only at energy efficiency projects started in FY2007 to FY2011. It contrasts the debt DoD assumes against the projects with the anticipated returns. It assume energy savings returns consistent with the estimate provided by the contractor, Figure 10 approximates that projects started between FY2007 and FY2011 will have fully repaid their capital cost by FY2021. This simple analysis does not include additional costs incurred for maintenance and repair of the newly installed systems. It also does not include the impact on both cost and returns of projects that could be started after FY2011. It does not include changes in return based on drastic changes in the price of energy.
Figure 10: Optimal Repayment Schedule For Efficiency Projects
Figure 10 shows the large upfront costs of programs and the lengthy “payback” or “benefit” period. The benefit period is the number of years required for a project to “pay for itself” and DoD to recoup the upfront investment. Recoupment timelines are based on the extremely generous assumption that efficiency projects will return savings as
intended. As the NREL studies noted, however, many efficiency procedures do not result the predicted levels of reduction. Individual behavior is extremely hard to modify. Energy
audits of buildings might not accurately capture building energy usage or as building purposes change, energy usage will change. Additionally, deviations in standard
weather patterns and changes to the price of commercial energy will affect returns on the investments. Finally, expenditures for maintenance and repair of new technologies are not captured in the initial cost estimates. Therefore, one might conclude that Figure 10 represents an optimally or “best case” recoupment schedule.
3. How effective are the renewable energy measures at producing a reliable source of power that meets the operational needs of an installation?
Understanding the value of DoD’s renewable energy measures requires an understanding of the distribution of DoD’s renewable energy sources and the metrics being used to measure success. According to regulations, DoD will be required to produce 25% of its energy from renewable sources by 2025. At the present time, however, the energy produced from DoD’s two largest renewable energy projects (China Lake Thermal Plant and Norfolk Naval Shipyard Waste Facility) is not yet directly used by DoD but is
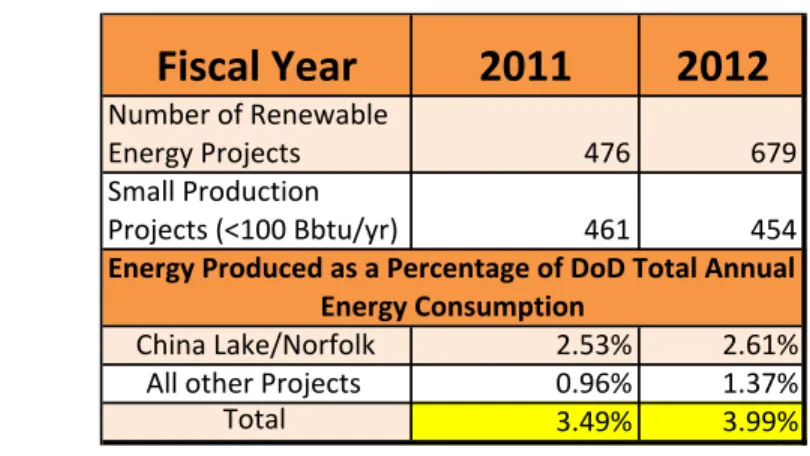
instead sold to local utilities. As a result, DoD is self-generating only a very small portion of its own energy. As illustrated in Table 3, many of the renewable energy projects produce small amounts of power. The first half of the table shows the total number of renewable energy projects in DoD as well as the total number producing less than 100 BBtu/year (4 MW). The second half of the table shows how much energy these projects produce in terms of percentage of DoD consumption.5
Table 3: DoD Energy Production as a Percentage of Consumption
5 The energy to power conversion rate is based on a 24-hour day, 365-day year and a production capacity of
Fiscal'Year
2011
2012
Number'of'Renewable' Energy'Projects 476 679 Small'Production' Projects'(<100'Bbtu/yr) 461 454 China'Lake/Norfolk 2.53% 2.61% All'other'Projects 0.96% 1.37% Total 3.49% 3.99% Energy'Produced'as'a'Percentage'of'DoD'Total'Annual' Energy'ConsumptionAs Table 3 further illustrates, the vast majority of DoD renewable energy projects are small and produce less than 100 Bbtu annually. Of the 454 small projects (producing less than 100 BBtu/year) in 2012, 91.9% produce less than 5 BBtu/year (0.19 MW). Most provide power to very small, ancillary pieces of equipment and thus do little, if anything to improve energy security. Major communication nodes, intelligence hubs, troop staging locations and operational installations still draw almost all of their power from conventional sources. Renewable sources are used sparsely to power a few outdoor lights or perhaps heat a single building.
Table 4 is a list of major installations and an analysis of their energy demands from FY 2012. The chart illustrates that most key operational installations could be fully powered by a facility the size of the China Lake thermal plant, which produced over 3600 Bbtu of energy in FY 2012. Conversely, if one uses the power from all 454 small energy projects in DoD (each producing less than 100 Bbtu/yr), the total energy produced in one year would be 1147 Bbtu. The combined output of all the small energy projects fail to meet the energy demands of most DoD installations.
Table 4: Installation Energy Demand Analysis
If DoD is to achieve energy security, it must produce energy on a scale that is usable. In an energy security crisis such as a grid collapse, a natural disaster or a cyber attack, DoD would depend on self-generated power. In the event of a crisis, DoD installations could
China&Lake& (3671&Bbtu) 454&Small& Projects& (1147&Bbtu) Emergency& Energy& (Bbtu) Energy& Source&<& 100&Bbtu Fort%Bragg,%NC 3491 Y N 873 N Fort%Campbell,%KY 1578 Y N 395 N Ft%Wainwright 3006 Y N 752 N Pearl%Harbor,%HI 846 Y Y 212 N Naval%Station%Norfolk 2032 Y N 508 N Florida%Keys%Air%Station% 199 Y Y 50 Y Twenty%Nine%Palms,%CA% 871 Y Y 218 N Lackland%AFB,%TX% 1994 Y N 499 N Peterson%AFB,%CO 2188 Y N 547 N NSA,%Various%Locations 3042 Y N 761 N Emergency&Energy& Viability&(25%) FY12&Energy& Consumption& (Bbtu) Installation,&Location Primary&Energy&Source& Viability
limit what facilities receive power and which do not. Table 4 shows the installation requirements for an emergency energy level set at 25% of normal demand. Assuming an emergency energy level of 25% consumption, military installations will need a reliable power source greater than 100 Bbtu/year. Most of DoD’s renewable energy projects produce less than 100 BBtu per year and 91% of these projects actually produce less than 5 Bbtu in a year. The current size and scale of DoD’s renewable energy project fails to provide an installation energy security in emergency situations.
Energy Security: A Problem Unchanged
DoD will continue it efforts to reduce energy consumption and find optimal consumption levels.. The focus of these efforts is continued improvements to existing buildings and building energy efficiency into new buildings. As the Defense Department restructures its force, however, consumption needs will change. A periodic assessment of power
demands and reevaluation of the 30% target goal will better aid in finding the optimal energy demand level for the department.
However, reduction in energy usage alone will not provide protection against energy attacks. To be secure and remain mission capable in a time of threat to national security, the Department of Defense must have an independent, reliable source of power. In FY2012, DoD conducted an analysis of utility outages across its installations and found 87 outages that each lasted longer than 8 hours. Figure 11 shows a breakdown of these outages and their financial impact. The largest contributor to significant loss of power to an installation is acts of nature. [4]
Figure 11 focuses on outages lasting longer than eight hours. However, eight hours, in a time of crisis, is an eternity. For example, the time from when United Airlines Flight 175 crashed into the south tower of the World Trade Center to the time the building collapsed was fifty-six minutes. Thirty minutes later the north tower collapsed.[21] During that time, every person in America and many millions across the world watch their televisions anxiously. New York’s first responders moved immediately, many to their own peril, to respond to the incident. Imagine if the response had been delayed 8 hours.
Figure 12 illustrates DoD’s use of renewable energy as a percentage of total electrical energy consumption.
Figure 12: Use of Renewable Energy as a Percentage of Electricity Use[8]
Not only is the overall percentage of renewable energy sourcing small, the majority of all renewable energy is produced at only two locations. Further, 61% of its renewable energy projects for FY2012 produced less than 5 BBtu/yr (0.19 MW). Given that the average residential house in the United States has an annual energy rate of 0.0013 MW, a single 5 BBtu/yr project can power about 143 homes.[22] Clearly, such projects are ineffective in improving energy security. Nonetheless, DoD continues to invest in micro-energy projects, allocating just under $80 million in FY2012 for this type of renewable energy project. The myriad of micro-energy projects not only failed to increase energy
production to target levels, but also failed to advance any real energy security improvements.[4]
Despite these failures in renewable energy procurement, DoD decided to embark on an ambitious plan to meet its goals. DoD is actively exploring ways to develop renewable energy on its installations instead of purchasing renewable energy credits. Each
department of the military (Air Force, Navy, Army) has set a goal of developing 1 GW of power from renewable energy by 2025. DoD plans to couple its goal of 3 GW of
renewable power with efficient distribution using micro grid technology. Micro grid technology allows an installation to not only generate its own power, but also control the distribution and storage of that power. DoD estimates that such a system would allow a military installation to achieve independence from conventional power resources and reduce energy vulnerabilities.[4]
Yet improvements in grid control will do little good if the power supply is neither constant nor sufficient. Achieving 3 GW of self-produced power is an unrealistic goal given the current energy production model. Unless the Department of Defense considers alterative sources of energy for on-site production, it will never achieve 3 GW of self-produced power. It will also never truly be postured to meet the basic mission
requirements needed to support the people of the United States in the event of a state side national crisis.
Chapter 6: Finding a Solution to Energy Independence
The Sustainable Definition of Renewable Energy
“The Department’s vision of sustainability is to maintain the ability to operate into the future without decline-either in the mission or in the natural and man-made systems that support it.” (DOD SSS FY12)
The Department’s definition of sustainability has two parts; (1) protecting its ability to operate and (2) protecting natural and man-made support systems. The World
Commission on Environment and Development describes sustainability as “meeting the needs of the present without compromising the ability of the future generations to meet
their own needs.” Hidden within this generalized definition of sustainable exist many
interconnect factors.[23] The first part of a sustainable energy solution for DoD is to meet its energy needs. While DoD’s current initiatives protect future generations they fail to allow the organization to function in the future. Failing to produce even 7% of its own power leaves DoD vulnerable to natural disasters, terrorist attacks and cyber threats. Increased energy production is vital to achieving energy security and to DoD developing a sustainability strategy that is both effective and lasting.
DoD’s recently added goal to produce 3 GW of is own power by 2025 is ambitious, given its current levels of self-generation. By comparison, Georgia Power announced in
February of 2013 that it would be shutting down 15 coal and oil fired units by April 2015. These facilities had a combined production capability of 2.016 GW.[24] That is an
average production loss of 134 MW per plant. Only DoD’s China Lake facility rivals the production levels of conventional plants. DoD’s current production ratio per renewable energy project, excluding China Lake and NNS Norfolk, is 0.21 MW per project. When only looking at small projects (less than 100 Bbtu/year produced), the ratio is even lower at .09 MW per project. Using the more generous ratio, DoD would need 14286 projects to produce 3 GW of power. The Department of Defense must close the gap between its current renewable energy production and its energy demands in order to be sustainable.
In order to accomplish this, a reexamination of the definition of renewable technology is needed.6
DoD Redefining Renewable Technology To Meet Its Needs
Under its current energy strategy DoD attempts to provide sustainability using renewable energy technology.
Figure 13: DoD Renewable Energy Projects by Type[4]
Figure 13 shows a breakdown of the renewable energy sources used by the Department of Defense in FY 2012 for its energy security projects. EPA 2005 defines renewable
technologies as “electric energy generated from solar, wind, biomass, landfill gas, ocean (including tidal, wave, current and thermal), geothermal, municipal solid waste or new hydroelectric generation capacity achieved from increased efficiency or additions of new capacity for an existing hydroelectric project” (EPA2005) The EPA 2005 definition is in regards to how the federal government defines power consumed that is creditably toward EPA 2005 goals. A broader definition of renewable energy comes from the Department of Energy (DoE). DoE defines renewable energy, as
“Energy derived from resources that are regenerative or for all practical purposes can not be depleted.” [25]
The DoE definition focuses on the sustainability aspects of renewable technology while the EPA2005 definition simply defines types of production. The EPA2005 definition is not intended to promote innovative and new technological developments. Instead it is
simply to be used for the purposes of the act, as a guide for how organizations receive renewable energy credit under the law. EPA2005 was never intended to promote energy security on a large scale. The intent of EPA 2005 was simple to promote conservation, reduce green house gas emissions and increase the use of currently recognized renewable energy platforms.
To be a sustainable organization, DoD much approach energy production with a much larger technological aperture of than limiting guidelines of EPA 2005. It must look to the root definition of renewable and apply it to technology promote its energy needs. DoD needs a source of power that is robust in energy output in order to sustain the small-scale cities, which are its installations. EPA2005 technologies do not produce power on the scale necessary to power a military installation. DoD needs a power source that operates in a variety of climates providing a consistent source of power year round. EPA 2005 technologies work in a spattering of climates with mixed rates of production dictated by seasonal conditions. DoD needs a technology that once in place, has a proven record of lasting for long durations providing consistent power with little overhaul or replacement of major components. EPA 2005 technologies are delicate and have not been shown to provide long lasting, consistent power outputs. Finally, DoD needs a power source that can operate in conjunction with the mission requirements of its installations without hindering operations. The use of EPA 2005 technologies will require a selective approach to technology implementation due to potential drastic impacts on mission performance. Thus, to truly meet its energy needs, the Department of Defense needs to re-evaluate its choice of renewable production technologies and find a source of long lasting, consistent, mission compatible power. To meet the spirit of EPA 2005, this power source must be renewable and reduce the production of green house gases.
Renewable and Sustainable: Nuclear Power
As the Cold War intensified in the later half of the twentieth century, the Navy sought a new source of power. The Navy needed a fuel for its submarine fleet so the vessels could travel long distances without the need for extensive supply chains. In the 1950s, Admiral H. V. Rickover of the US Navy pioneered an incredible new idea by applying atomic
![Figure 1: DoD Facility Energy Consumption and Cost[4]](https://thumb-us.123doks.com/thumbv2/123dok_us/1770384.2751713/16.918.142.779.548.741/figure-dod-facility-energy-consumption-cost.webp)
![Figure 3: Projected Growth in building energy use relative to other sector[12]](https://thumb-us.123doks.com/thumbv2/123dok_us/1770384.2751713/24.918.217.699.497.898/figure-projected-growth-building-energy-use-relative-sector.webp)
![Figure 6: Geothermal Plant at China Lake, CA[4]](https://thumb-us.123doks.com/thumbv2/123dok_us/1770384.2751713/29.918.137.833.107.464/figure-geothermal-plant-at-china-lake-ca.webp)
![Figure 13: DoD Renewable Energy Projects by Type[4]](https://thumb-us.123doks.com/thumbv2/123dok_us/1770384.2751713/42.918.158.761.333.497/figure-dod-renewable-energy-projects-type.webp)
![Figure 14: Ohio Class Submarine USS West Virginia [27]](https://thumb-us.123doks.com/thumbv2/123dok_us/1770384.2751713/44.918.233.688.329.651/figure-ohio-class-submarine-uss-west-virginia.webp)
