Enabling Real-time Pro-active Analytics on Streaming Graphs
Charith Wickramaarachchi, Marc Frincu,Viktor Prasanna
University of Southern CaliforniaLos Angeles CA 90089 USA {cwickram,frincu,prasanna}@usc.edu
Abstract—Massive growth in areas like social networks and cyber physical systems pushes the need for online analytics of high velocity graph structured data streams. Its intrin-sic velocity and volume challenges existing graph processing frameworks like Google Pregel and traditional stream process-ing systems. Consequently we need a shift in the way these systems are design and design new data and execution modes, and architectures. In this paper we propose and position a new analytical model for processing high velocity graph structured streaming data while providing an architecture and discussing some research challenges that need to be addressed before it can be accomplished. A couple of motivating use cases are mapped to the model and architecture are also discussed.
Keywords-graph streams;graph analytics; time series; elastic architectures; data models;
I. INTRODUCTION
The term Big Data was first referenced in 1997 by Cox and Ellsworth [1] and was used to refer to large data sets that do not fit the main memory or local disk. Even before that physical sensors or monitoring software were employed to gather data from various sources ranging from astronomical surveys and DNA sequencing to traffic monitoring and social networking. Gartner [2] defines Big Data as data having large volume, variety and velocity, although some have
added other vs such as veracity to it. Due to the nature of
the gathered datasets research in the past decades was more focused on the volume aspect. The current rate at which information from social media or cyber-physical is gathered brings velocity to the table. Many applications dealing with this kind of streaming data require real-time processing, e.g., threat prevention and real-time optimization. High velocity data processing systems Twitter Storm [3] and Amazone Kinesis [4] were introduced as a result of this.
Much of this Big Data streams exhibit structural patterns which can be naturally modeled as graphs – e.g., social media like Twitter or Facebook; road network traffic; smart grid power grid and customer network. Current systems, be they vertex (e.g., Pregel [5]) or subgraph (e.g., GoFFish [6]) centric are designed to deal with volume and variety. Currently however their is an increased need to process these high velocity data streams in real-time based on online model which notifies applications on occuring complex events within the graph structure. These can help users and applications in optimization decisions by investigating possible causality patterns between the detected patterns,
and by taking pro-active decisions on possible upcomming events – e.g., social network evolution based information coming from the Semantic Web and social networks; road network monitoring and traffic optimization; power manage-ment optimization in smart grids. The real-time constraint combined with a varying input rate and volume for the data streams brings to the table the need to elastically scale the execution/storage platform so that costs are minimized and the time constraint is satisfied. To date no suitable models for streaming graph processing in distributed elastic environments exist.
Real-time streaming graph processing requires an asyn-chronous push-based model designed for scalable archi-tectures. In this way users: (1) do not have to explicitly check for events at specific time stamps, instead they use a continuous query language based on a publish-subscribe model; (2) the real-time constraint of minimizing the late-ness of each event detection is achieved through graph aware online scaling; and (3) analytics on each job can run asynchronously with respect to the other jobs.
In this position paper we take a look at the main issues that arise in designing a platform for pro-active analysis of streaming graphs. In our context these graphs are defined as time-evolving graphs with a fast update rate of their vertices, edges and associated attributes. To better understand the challenges we first look at a possible model for this class of graphs and sketch out a platform architecture (cf. Sect. III). As seen in Sect. II no current system offers the full model and software stack to deal with these kind of graphs. While we make no assumption on the underlying platform the elastic nature of the applications makes it ideal for modern scalable infrastructures such as clouds. The model and architecture are mapped on a series of use-cases in order to prove their validity.
Our main contributions can be summarized as follows:
• we propose and discuss a novel pro-active push-based
analytic model for processing streaming graphs;
• we present a distributed scalable architecture that will
enable such a model and discuss its main components;
• we propose a continuous query language called CGQL
(Continuous Graph Query Language) for pro-active graph stream processing that enables users to perform real-time graph analytics without having to deal with the underlying graph structure or distributed system;
• finally, we identify a series of research challenges that arise from the above and related to: scalability, data partitioning, memory representation and storage, exe-cution model, and translation between abstract CGQL and concrete graph queries.
The remaining of the paper is structured as follows: Section II gives an overview of existing related work and its limitations for real-time streaming graph analytics; Sects. III and IV deal with the proposed model and architecture; Sect. V discusses CGQL; Sect. VI presents several use-cases based on the proposed model and maps them on the envisioned architecture; Sect. VII depicts the challenges set out by the future research directions; and finally Sect. VIII summarizes the main key-points of this research.
II. RELATEDWORK
Graph analytics and mining gained a lot of traction in both research and industry in the last few years due to rapid development in areas like social/communication networks and computational biology. Even though lot of work has been done on graph processing and management applying them in emerging domains such as real-time Big Data analytics becomes a challenge due to the volume, velocity, variety and veracity of the data [7].
Large scale graph mining. Processing of large scale graphs is a well studied problem. Both parallel and distributed algorithms have been developed for large scale graph pro-cessing. Due to the massive expansion of the web and social networks, large scale graph mining regained its momentum in last few years. With the introduction of Map Reduce framework [8] efforts have been made to come up with large scale graph processing frameworks which runs on commod-ity clusters and clouds, e.g., Google Pregel [5], Trincommod-ity [9], Pegasus [10], GraphLab [11]. All of these frameworks focus on large scale static graphs and not streaming graphs.
Time evolving graphs. Some graphs like social/communi-cation networks exhibit evolving characteristics over time. Managing and processing these dynamic graph-structured data started to get some attention in the research community [12] [13] [14] [15] [16] [17] [18] [19] [20]. Time evolv-ing graph processevolv-ing can be categorized into two ways: processing of graph snapshots, and processing of graph updates. In [12] [13] snapshots of time evolving graphs are created. Incremental algorithms and parallel algorithms and approaches mentioned in [14] [15] [16] [17] [18] [19] [20]. Our approach is to combine both in different phases of the process. For in-memory fast event detection in time evolving graphs we use incremental and distributed algorithms which process the unprocessed updates to the graph. We also create and persist temporal snapshots for offline batch processing of time evolving graph data.
None of the existing techniques work on fast complex event detection in large scale time evolving graphs and they do not consider attribute changes of the graph components
(vertices and edges) to do the analytics. We believe these to be important factors when it comes to social/interaction graph analytics. Another major difference is the targeted platform. The algorithms and methods proposed in [14] [15] [16] [17] [18] [19] [20] rely on high performance shared memory machines which can store the graph in-memory. We target cloud platforms due to their inherit elasticity. As a result, our work involves the development of distributed algorithms and models, some of which being possible ex-tensions (that support attribute changes) of existing parallel algorithms [15] [18].
Dynamic graph re-partitioning. Graph partitioning is a well studied problem in parallel graph processing area. The main idea is to assign vertices/edges in a graph to different parallel graph processing workers to minimize the communication between workers [21].
After the introduction of iterative graph processing pro-gramming models like Google Pregel [5] and its successors the problem of dynamically re-partitioning the graph has been studied [22]. Current studies on this problem is only done on static graphs where to the best our knowledge no prior work has been done for doing dynamic re-partitioning of time evolving graphs.
Complex event processing. Data stream processing systems are getting traction due to increase popularity and usage of sensor systems, social media streams, etc. As a result, we notice new emerging systems for handling this high data velocity [4] [3]. Data stream processing systems focus on doing calculations on the data streams [23]. SQL like languages have beeen proposed and implemented to input complex event matching queries, e.g., SASE and RAPIDE-EPL [24]. To the best of our knowledge, no system has been proposed to enable complex event processing on time evolving graphs which consider graph updates as events. Here the challenge lies in managing and processing the large underlying graph state to detect events. Where in existing CEP systems this state is very small and can be fit into the main memory of a single machine.
Graph queries and query languages. The relational database model was the de facto method for storing en-terprise application data in a decade back. But relational model and SQL do not have enough native support to efficiently represent and query graph structured data. With the increasing popularity of XML, social networks and the ontologies, graphical query languages and graph data man-agement systems have become a need. Examples of proposed graph query languages include GraphQL [7] GraphLog [25] and GraphDB [26].
To our best knowledge all the existing graph query models are based on a data pull model where user executes a query one time to pull the matching results. We believe that due to the fast changing nature of the targeted graphs, there is a need for push based query model which will continuously push matching complex events to the users
once they mention the graph patterns they are interested in. Some work on defining and detecting events in time evolving graphs [12] has been done, but it does not provide a general query model for providing these event patterns.
Concluding, based on our analysis of related work, none of the existing solutions offers a suitable model – at data, execution and query levels – for enabling large scale pro-active real-time analytics of streaming graphs.
III. PROPOSEDMODEL
Previous work [13] has defined streaming graphs as an unbounded sequence of graph instances taken at discrete time steps. We argue that this approach induces too much overhead in terms of storing the entire graph structure and creating efficient indexes to access the data. Instead we
propose a novel approach in which agraph streamcontains
only the update information not the topology or attribute information. The topology with its semantics will be built at runtime by processing the events generated in the stream.
A. Streaming Graphs
Graphs with attributes or Attributed Relational Graphs (ARGs) as named in domains like image processing [27] can be used to model graph structured data similar to what we find in social and communication networks. These graphs can be seen as an extension to traditional graphs by enabling vertex and edge attributes.
Formally and ARG GA = (V, E, AV, AE), where
V, E, AV, AE represent the set of vertices, edges, and
ver-tex and edge attributes respectively. The verver-tex and edge
attribute sets are defined as A(V) = {id, α1, ...αm}, and
A(E) ={id, β1, ...βn}, whereidis a time invariant unique
identifier andαk,βk represent name value pairs.
Given an ARG we define a graph stream as an unbounded
sequence of updates toGA: S ={δ1, ..., δn, ...}, where an
updateδi can be any of the following:
• vertex addition (+v): V =VS
{v};
• vertex removal (-v):V =V \ {v} ∧AV =AV \ {ai:
i.id=v.id∀i∈V};
• edge addition (+e):E=ES{e};
• edge removal (-e): E =E\ {e} ∧EV =EV \ {ei :
i.id=e.id∀i∈E};
• vertex attribute addition (+av):AV =AVS{av};
• vertex attribute removal (-av): AV =AV \ {av};
• edge attribute addition (+ae): AE=AES{ae};
• edge attribute removal (-ae):AE=AE\ {ae}.
Without loosing generality we consider an update on a
graph to be instantaneous, i.e., δk is dimensionless. This
allows us to define fine grained events that take place on graph streams which are used in graph-oriented analytics to determine application specific time evolving patterns.
In practice we extract these types of graph streams from online social media like Twitter [28] and Friendfeed [29].
We define a Streaming ARG (SARG) as an ARG that
evolves over time under the effect ofS:G(At)=f(GA,S).
B. Elastic Buffer
The high velocity nature of graph streams and the real-time processing constraint requires us to develop optimized data structures for storing only the most relevant information for online processing. For this we define elastic stream-ing graph buffers, Bts→te = {δ(ts), ...δ(ts+1), ..., δ(te−1)}, where the length of the buffer is variable and equal to
te−t. These buffers contain the latest most relevant stream
data. Due to memory and performance issues these buffers cannot extend indefinitely in the past, therefore we define periodic checkpoints based on the stream rate and volume and not only on time intervals. This allows us to define both a spatial and a temporal based snap-shooting policy:
Lti→ti+1 = f(λti→ti+1, DVti→ti+1), where λti→ti+1
rep-resents the input rate, DVti→ti+1 is the data volume, and
Lti→ti+1 is the buffer length.
Given a checkpoint the buffer contains only information from that particular checkpoint onward. The buffer is the centerpiece of our model as we can use it to perform Iter-ative Asynchronous Bulk Parallel (ItABP) graph analytics, online graph repartitioning and resource scaling to efficiently process these analytics in real-time.
C. Graph Instances
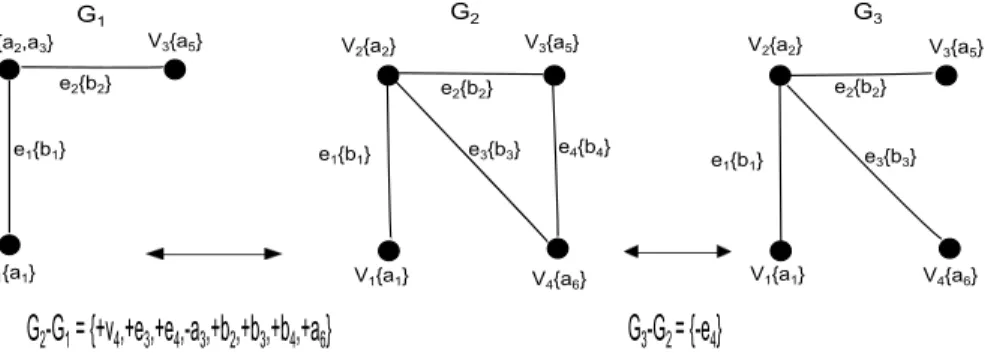
A graph instanceGtis a checkpoint performed on a graph
at a given time. The set of instances produces a discrete time
series Gt∞ = {G
(1), ..., Gt, ...} taken over t. A transition
from one instance to another – i.e., the differenceGti−Gti+1
– can be represented by the SARG function applied inside
the interval [ti, ti+1]: f(Gti,Sti→ti+1). Figure 1 shows
an example of three consecutive instances and the buffers associated with each transition.
D. Towards Fast Pro-active Analytics on Streaming Graph
We propose a novel pro-active graph analytics model which processes graph streams and continuously pushes results to the user in form of events named Complex Graph Events (CGE). We differentiate CGE from low level graph events stored in the buffer. As shown in Fig. 2 the platform processes the buffer based on the stream and user query and emits CGEs. As an example we assume an input stream of social network feeds and a user query for determining the evolution of a given user’s friend social network. the system At a platform level the query is translated into graph specific language where the user’s social network is equivalent to a connected components, and whether or not two users are connected through a path is determined through a reachability change between their corresponding vertices. The platform will monitor the evolution of the reachability between vertices and emit corresponding events. These low level CGEs will be mapped back to the query
G1 G2 G3 V1{a1} V1{a1} V1{a1} V2{a2,a3} V2{a2} V3{a5} V2{a2} V3{a5} V4{a6} V4{a6} e1{b1} e1{b1} e1{b1} e2{b2} e2{b2} e2{b2} e3{b3} e4{b4} e3{b3}
G
2-G
1= {+v
4,+e
3,+e
4,-a
3,+b
2,+b
3,+b
4,+a
6}
V3{a5}
G
3-G
2= {-e
4}
Figure 1. Example of three consecutive graph instances.
CGQL
Query
Graph Streams
Complex Graph Events
Figure 2. High level conceptual overview.
semantics and the user will see in real-time how the targeted social network evolves.
As mentioned we rely on the buffer to handle the input stream for fast processing. The buffer stores only those updates arriving after the last graph instance snapshot. In
Fig. 3Stis the latest snapshot taken at time t. In a normal
scenario a user will input a query to continuously monitor
an event within either a specified time frame [qs , qe]
or continuously ([qs , ∞)) until a cancellation query is
dispatched – note that qs < t is possible. Based on the
buffer data, the user query, and possibly on one or more snapshots if the time frame starts in the past, the platform will emit CGEs in real-time. Four cases are possible:
• qs ≥ t: the platform processes both the buffer and
the information present in the snapshot Gt or a query
specific index created at timet;
• qe ≤ t: the platform processes only the information
stored in the graph instances taken in the specified time frame. This is the usual case of batch processing frameworks like Pregel [5] or GoFFish [6];
• qs < t andqe > t: this case combines both real-time
and batch analytics. Two processes are created for each: one job will detect complex events for the duration of
[qs, t)by relying on graph instances, and the other will
continuously detect events in the [t, qe)time frame.
Given a query time τ the real-time constraint of our
St1 St2 St3 St
qs qe
CƮ1 CƮ2 CƮ3 CƮ4 DƮ1DƮ3 DƮ4DƮ2
Snapshot timeline Query time line , Event creation times Event detection times
Ʈ
Figure 3. Graph snapshot creation and event detection.
model requires that the lateness of our detection events is minimized: minP τi (Dτi−Cτi) ∀τi> τ Dτi < qe ∀τi≤τ (1)
where Dτi represents the time when event τi is detected
and Ci is the actual time the event was triggered. Ideally
P
τi
(Dτi−Cτi)→0 ∀τi> τ.
IV. PROPOSEDARCHITECTURE
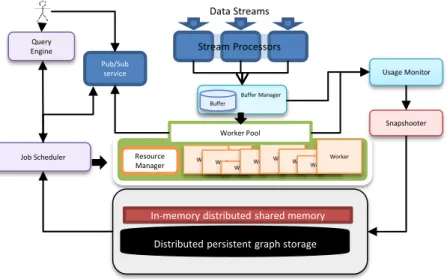
To better understand the challenges posed by enabling pro-active streaming graph analytics we present in this section a possible scalable software architecture to address the problem. Figure 4 gives an overview of its modular design. We only provide the high level details of the sys-tem. Modeling and algorithmic details related to dynamic repartitioning and the ItABP are out of the scope of this paper.
The architecture is based on a publish subscribe mode in which users subscribe to specific CGEs by issuing Complex Graph Queries (CGQs) (cf. Sect. V). These are processed by the different modules as depicted next and the results are published and placed under corresponding topics for users to access based on their subscription. In this way we enable pro-active streaming graph analytics so that users do
Data Streams Stream Processors
Distributed persistent graph storage In-memory distributed shared memory
Worker WorkerWorker
WorkerWorker WorkerWorkerWorker Worker Worker Pool Buffer Manager Query Engine Pub/Sub service Job Scheduler Usage Monitor Snapshooter Buffer Resource Manager
Figure 4. Proposed system architecture.
not have to explicitly ask for CGEs but instead they are automatically notified of their occurance.
The communication between the various modules is based
on message queueing systems such as RabbitMQ1.
A. Stream Processors
The system accepts multiple data streams which contain graph event information. Stream processors process these data streams and emit low level graph events. The processing logic can be specific to the stream that is being processed, hence the user is allowed to implement custom transforma-tion logic to transform and extract the graph events from the data stream. Stream processors can act as a first level of processing for time series data streams but this level of analytics is out of the scope of this research. The generated low level graph events are then directed to the Buffer Manager where they are buffered in the in-memory event buffer (cf. Sect. III-B).
B. Buffer Manager
The Buffer Manager is responsible for storing the current graph event buffer and distribute it to the corresponding workers based on data and query locality. It is also commu-nicates to the Usage Monitor information about the stream rate and volume. The Usage Monitor later aggregates the data and sends it to the Graph Instance Snapshooter which performs dynamic repartitioning for the next graph instance, and also to elastically scales the Workers.
C. Graph Instance Snapshooter
The Snapshooter is responsible for creating graph instance snapshots continuously by updating the most recent graph snapshot with the graph events in the buffer. The rate at
1http://www.rabbitmq.com/
which these snapshots are created as well as the repar-titioning process are based on information provided from the Usage Monitor. The main reason for repartitioning is to improve the overall processing latency of the Workers. Two kinds of knowledge is needed to perform an efficient partitioning. First we require stream related information such as: rate and volume; second we rely on Worker specific information such as computation to communication ratio of workers; and communications patterns between existing Workers. It must be noted that the latter data is query dependent. On one hand a centrality query will only affect clustered data which is highly likely to be stored on a single Worker in order to reduce communication costs. On the other hand a reachability query and even a spanning tree is most likely to affect a large number of Workers and induce large communication overhead. The way the partitioning is performed affects the scalability of the Workers. While the specific partitioning and scalability algorithms are beyond our scope we will provide some high level insight when discussing the Worker pool.
After the new instance is created the previous one is moved to the persistent storage. Each time a new instance is captured it is partitioned based on historical information from the elastic buffer and statistics from the Workers so that that communication between workers is minimized. Workers are redistributed by elastically scaling them according to the new partitioning. The partitioning algorithm itself is beyond the scope of this article.
D. Query Engine
The Query Engine is handling the submitted CGQs. It acts as the interface between the Job Scheduler and the user. The CGQL is translated into an object model and submitted to the Job Scheduler. In doing so the engine creates a topic for the CGQ in the publish subscribe service and returns it
to the user. Users can then subscribe to a topic to receive CGEs produced as a results of processing the query.
E. Job Scheduler
The Job Scheduler is responsible for scheduling CGQ jobs on the Workers. It takes a CGQ as input from the Query Engine and sends it to each Worker based on the current graph partitioning. As an example, the next reachability
detection query:Detect Reach(source:{interests=f oo} ,
sink:{interests=bar}), outlines the user’s interest in how groups with two interests are linked and how the links evolve over time though. Will be sent to each Worker which based on a semantic matchmaking will perform an index based
search on all vertices with an attribute interests=foolinked
through a path with vertices with attribute interests=bar. The
path in our case can be set of edges where an edge represent a follow tweet action, a like event or a comment in a blog.
F. Worker pool
The Worker Pool consists of a Resource Manager and a set of Workers, i.e., self-contained distributed jobs which coop-erate towards performing complex real-time graph analytics. Each worker is assigned a partition on which it performs the analytics. It will have access to the buffer feeding its subgraph with events, the latest instance snapshot and to the user query. To achieve full efficiency workers are able to scale either vertically (by allocating more resources for the virtual machine they run on) or horizontally (replicate themselves on another virtual machine) in case the Usage Monitor triggers a throughput alert. The actual resource al-location and worker execution is performed by the Resource Manager. Based on information retrieved from the Usage Monitor, the Resource Manager handles virtual machine and job failures, job reallocation and straggler mitigation.
Workers which detect CGEs will publish (push) that information to the corresponding topic so that the user wil be automatically notified on its occurance and have access to the related information, e.g., reachability status, cluster diameter, etc. They also report their usage statistics like processor/memory usage, communication statistics (e.g., which workers it communicates with and how frequent) to the Usage Monitor which will use them as parameters when determining the partitioning of the next graph instance.
G. Distributed Storage
The Distributed Storage consists of two layers: an in-memory distributed shared in-memory and a distributed per-sistent graph. The former is used to store the current graph instance and related indexes, while the latter contains all previous graph instances. For quick access the graph com-ponents are indexed using a distributed indexing scheme. Also some indexes are created based on most frequent user queries.
As explained in Sect. III the user query can span a time range, which can start before the current graph snapshot.
Older graph snapshots stored in the persistent storage are used for detecting CGEs from a time before the current graph instance.
V. CONTINUOUSQUERYLANGUAGE
To enable CGE detection users need a language with a wide degree of freedom in defining what they look for, and also a mechanism that frees them from continuously pushing for detecting new events. As seen in Sect. II query languages have become familiar in doing graph analytics and also time series mining. One solution may be a Continuous Graph Query Language (CGQL) which allows users to input a one time query and wait for CGE notifications as they are triggered by the graph analytics requested through the query. The CGQ will end as soon as the user will issue a canceling query or the time frame specified in the query is reached. A publish-subscribe approach is followed to enable this kind of continuous push-based model. To our knowledge, no prior work has been done on designing a continuous query language for graphs.
A CGQ needs to allow a wide range of operations required for performing analysis on streaming graphs:
DETECT pattern[...] [FROM start time TO(end time] | FOR duration | SINCE duration] [WHERE op-tional constrains] [AStopic]
Next we discuss each of its components:
A. Query pattern
Query patterns represent graph patterns or analytics the user is interested in. Since there can be many application specific analytic that can be done on the graph structured data users can plug new patterns to the system. Each custom pattern will have its own query syntax and will extend the default Pattern interface. A new pattern definition includes CGE types and complex event schema for the respective outputs. An example pattern is explained in the Sect. V-E. When the user executes the query the system will return a topic name to which users can subscribe in order to receive CGEs which are detected and published by the Workers.
B. Query Duration
Optionally the query duration can be provided. By default the life span of the query is the infinite and starts at the moment it is submitted. The duration is defined using one of following constructs:
• FROM start time TO end time: defines the time span of the query using bounds provided as Unix cron
expressions2 that denote the start and end time of the
query;
• FOR duration: defines the time span of the query using the query duration. The query will start executing immediately and run until the duration is reached; • SINCE duration: queries for CGEs that took place in
the past.
C. Optional Constrains
A couple of optional constrains allow to further limits on the query, e.g., edge label constrains for reachability queries or generic constrains like a request for a time ordered delivery of CGEs. A constrain can also contain other queries. Finally it can contain keywords like PREDATES or SUCCEEDS to indicate its temporal relationship to other queries. Section VI will present a detailed example.
D. Extending the Continuous Query Language
The CGQL can be carried as a part of full time series data processing language. Users can optionally specify the output stream of the CGEs as a part of CGQ which can then be used as inputs to an event stream part of a complex event processing query. This allows users to perform broader analytics beyond CGE detection. An concrete example will be provided in Sect. VI.
E. Example Query
Next we provide a CGQL example based on reachability query patterns. These can detect two types of CGEs: (1) new reachable source sink node pairs (reachability pattern); and (2) reachable source sink pairs that will become unreachable (unreachability pattern).
At output the CGE contain the following information: time stamp of the event; status (reachable or unreachable); status vertex (ID and attributes); sink vertex (ID and at-tributes); and edge label constrains.
DETECT Reach(source:{name=Bob, age= 33} , sink:{age <30, lives in=London}) FOR 20h WHERE edge:{type=f ollow}
This query will continuously detect streaming graph CGEs for 20h. The pattern it looks for is the reachability between
source nodes with attributename=Bobandage=30, and sink
nodes with age less than 30 and lives in attribute with value ’London’. reachabilities with edges having the attribute type value ’follow’ will be considered.
VI. MOTIVATINGUSECASES
In this section we present two use cases from distinct fields that fit our streaming graph model: a smart grid and a computer network use case. Their choice aims at showing the generality of our model for streaming graph analytics and to prove the effectiveness of our model and architecture by mapping the applications on them.
Smart Grid. Due to increasing demand for efficient elec-trical power management and conservation more and more
power grids are updated as smart grids. As a result smart meters installed at the consumer premise communicate in real-time with the power utility. Normally, smart meters send out power usage information to the utility in a synchronous manner at a predetermined time interval. This allows util-ities to forecast and predict incoming power demands and perform demand response activities in real time. Demand response is done by either voluntary curtailment where utility sends a curtailment request to a selected subset of identified customers or direct load control through smart appliances. Either way the utility should identify and predict peak demand zones and determine based on these the subset of customers to be select in the demand response.
Smart grids can be modeled as graphs where consumers are represented as vertices and power connections as edges. This is a structurally static graph where only the vertex and edge attributes – for power consumption – change over time as a result of the fluctuating consumption. On top of this network we can overlay a the customer social network where they interact via tweets, Facebook, etc. The mapping of the social network users and the smart grid customers is beyond our scope but we can assume the system to be integrated in the smart grid portal to facilitate the log in and communication with the utility. The social network produces a fast changing SARG and a slower topological change. Figure 5 exemplifies this type of graph with two types of edges – for the social network and for the smart grid topology – and two types of vertices (for the customers and for the smart grid relay and distribution stations).
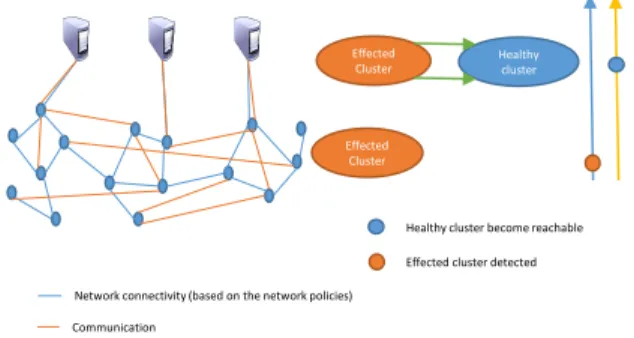
Wide Area Networks (WAN). A large scale service provider like Google has a geographically spread WAN. For management and security reasons this WAN is in gen-eral composed of multiple networks. Service nodes which provide services connect to this WAN. This creates a two layered graph with one layer being the static network topol-ogy graph and the other the service layer with a changing topology based on the routing protocols. Depending on their attribute values vertices can be either physical machines or applications running on them, while edges are either physical routes or communication routes defined by the routing protocols. Figure 7 exemplifies this scenario.
A. Graph Pattern Detection
Areas with high demand or those which exhibit coalescent consumption patters during a day or within a demand response event are of particular interest to utility providers. The emergence of these clusters; their growth beyond some given threshold; their merging or even disappearance is of particular interest especially if they follow a certain temporal pattern or are connected with the social interaction between customers. Taking in consideration a possible causality between the social interaction and power consumption a CGQ could search for the formation of cluster consumption patterns preceded by several reachability events in the social
Consumers Sub stations
Power grid edge Communication edge
Figure 5. SARG for the smart grid use case.
High consumption cluster Medium consumption cluster Medium consumption cluster
Cluster event time line
Medium utility cluster High utility cluster
Reachability event time line
DR Event time line DR curtailment request
Low consumption
cluster
Low utility cluster
Low consumption cluster Low consumption cluster
Figure 6. Power usage cluster detection and consumer social network reachability event detection to detect influencing groups.
Effected Cluster Effected Cluster Healthy cluster
Effected cluster detected Healthy cluster become reachable
Network connectivity (based on the network policies) Communication
Figure 7. Warm infected cluster detection and prevention of infection propagation.
network of the cluster customers. We envision scenarios like after a demand response event a cluster of customers that have reduced their consumption influences through the social network another cluster of high consumption (cf. Fig. 6). This can be used to predict which group to be targeted for the demand response event.
Similarly, for the WAN we can consider the case of a denial of service attacks which can arise from the infected machines in a company’s WAN. In this scenario we can look for the occurrence of infected clusters and reachability events from those clusters to other areas of the network. By
correlating this with the occurrence of other infected clusters we can predict both the magnitude of infection and the likely hood it will happen in a particular sub-network (cf. Fig. 7). Finally this leads to preemptive measures against viral propagation.
B. Mapping the Use Case to the Architecture
1) Initial Data Loading: An initial data graph which contains the customer power grid connections and customer specific information is bulk loaded into the system . This initial graph instance will have customers as vertices and power distribution connections as edges. This process is similar for loading the WAN network structure information.
2) Stream Processing: In the smart grid scenario the system consists of three stream processor types: one for pro-cessing the power consumption events from the customers – which will emit graph events of attribute changes; another for processing the social network communication/network communication and emit graph events based on the com-munication between consumers/network nodes and also on their profile updates. This includes edge change updates and vertex attribute updates. Lastly, there is a type of stream processor which does not accept any input stream, but instead its task is to explore old communication links and emit edge removal events.
The WAN scenario contains only to stream processor types, for processing events related to package sent/receive, and for exploring old communication links and remove unused edges.
3) Continuous Graph Queries: For both cases we have two CGQs where one query depends on the other: (1) a cluster detection query which will detect cluster creations, merging of clusters and cluster disappearances; and (2) a reachability detection query which looks for reachability changes between various utility clusters. Given the causality motif only reachability events occurring after a cluster event will be looked for. Next we focus on the smart grid use case but a similar query can be devised for the WAN scenario. We need to monitor reachability events between low power consumption clusters to high power consumption clusters, followed by the decrease in consumption of the high power consumption cluster:
DETECT Reach(source:{name=C1.*}, sink:{name=C2.*}) FOR 24h WHERE edge:{message} AND DETECT Cluster( sum(node.usage) < C , diameter < d ) FOR (24h) WHERE edge:{type=power} AS C1
AND DETECT Cluster( sum(node.usage) ≥ C , diameter
<d ) FOR (24h) WHERE edge:{type=power} AS C2;
DETECT Evolved(C2) WHERE sum(node.usage) < C AND SUCCEEDS C2;
In the two queriesEvolved,ReachandClusterare
4) Complex Graph Events and Analytics: In the smart grid based usecase the system will emit two main CGEs, namely cluster related events which emit events regarding cluster creations, merging of clusters and cluster disap-pearances, and reachability events which detect rechability changes between these clusters. An application that predicts power utility demand and send curtailment requests can subscribe to the these event streams by issuing CGQs to our system. These event streams can be used to predict new power demands.
In the WAN use case the system also triggers two CGEs, namely cluster related events which emit events regarding possibly infected clusters – based on their amount of com-munication to the servers –, and another to detect probable reachabilities from a suspicious cluster to a healthy cluster. By studying these events and their causal relation system administrators can take preventive actions.
VII. FUTURERESEARCHDIRECTIONS
To enable the proposed model and architecture we have identified a set of research challenges that need to be ad-dressed. They open a new range of future research directions that will be undertaken following this paper.
Scalable Fault Tolerant Data Stream Processing. To address the real time constraints of the streaming graph analytic Workers need to adapt to the input rate so that the CGEs are detected with a minimum latency from their occurrence. For this we require an elastic platform capable of both horizontal and vertical scaling. Both are enabled by the elastic buffer and require an efficient partitioning of the en-tire graph so that inter-partitioning communication is mini-mized and the computational effort is balanced across nodes. Smart state replication techniques, load balancing policies, availability mechanisms and machine learning techniques are required to enable a buffer based elastic forecasting approach for scaling streaming graphs.
Incremental Distributed Graph Stream Processing Al-gorithms and Abstractions. Real-time analytics on stream-ing graphs requires incremental algorithms which process graph updates and analyze them based on the CGQs. Some initiatives have been taken in this area [16] [19] but none of them are distributed or cater for our sophisticated graph event model. These algorithms need to be executed in a distributed manner due to time constraints and the dynamic topology and size of the graph. None of the existing graph processing programming abstractions provide capabilities for distributed and fault tolerant graph stream processing. This raises the need for a new distributed and fault tolerant graph stream processing abstractions.
Asynchronous Execution Models. Incremental stream-ing graph analytics require asynchronous message passstream-ing between the distributed Workers in order to reduce execution time and load balance. The asynchronous model poses additional issues than those encountered by traditional bulk
synchronous models [5] [6]. These include synchronization between Workers, correlating the analytics rate to the buffer update rate, detecting general execution patterns for which this model can be optimized, etc.
Dynamic Re-Partitioning. As explained in Sect. IV the system continuously creates graph instances. Each instance is partitioned so it can be processed by a single machine. Due to the dynamic nature of the graph and because of fluctuations in input rate, volume and Worker load peri-odic re-assignments are needed. This raises the need for intelligent dynamic graph partitioning algorithms. These algorithms need to consider current load distribution, inter-Worker communication and behavior of the event buffer. Even though dynamic repartitioning has been discussed in literature [22], algorithms which consider this level of detailed objectives and input parameters were not addressed.
Distributed Data Structures and Indexes for Time Evolving Attributed Relational Graphs. When considering continuous data streams we need to design scalable data structures to handle the volume and velocity of the data. Research such as that conducted in [14] has mainly focused on large scale, high performance multicore machines. In order to enable fast processing of streaming graphs fast distributed data structures for storing the graphs and fast distributed indexes to enable CGQs are needed.
Efficient Translation Layer between high level abstract graph queries in CGQL and the low level graph constructs. CGQL allows users to capture a wide range of predefined or custom CGEs. Depending on their complexity and semantics they require a semantic match-making layer to be translated in specific graph elements such as vertices, edges and at-tributes. Domain specific ontologies need to be identified in this direction. The layer needs to perform the translation with minimum latency and can be incorporated in the Worker to reduce the communication overhead.
VIII. CONCLUSIONS
Due to the high velocity graph structured data streams generated by emerging domain specific applications the big data analytics domain experiences a shift in focus towards streaming graph analytics. This demands faster analytic models, architectures and algorithms which can provide analytic results in real-time. In this paper, we position our-selves in this context and look at the possible solutions and challenges in designing models, architecture and languages to enable real-time streaming graph analytics. We showed the applicability of the proposed model by presenting some example applications and mapping them to the proposed ar-chitecture and query language. Finally we described several research problems needed to be addressed in order to enable this kind of model and architecture.
ACKNOWLEDGMENT
This work was supported by the DARPA XDATA pro-gram. The views and opinions of authors expressed herein do not necessarily state or reflect those of the United States Government or any agency thereof. Authors would like to thank Charalampos Chelmis, Alok Kumbhare and Anand Panangadan for their input and feedback in preparing this article.
REFERENCES
[1] M. Cox and D. Ellsworth, “Application-controlled demand paging for out-of-core visualization,” in Proceedings of the 8th Conference on Visualization ’97, ser. VIS ’97. Los Alamitos, CA, USA: IEEE Computer Society Press, 1997, pp. 235–ff. [Online]. Available: http://dl.acm.org/citation.cfm?id=266989.267068
[2] “Big data,” http://www.gartner.com/it-glossary/big-data/, ac-cessed: 2014-01-13.
[3] “Storm distributed and fault-tolerant realtime computation,” http://storm-project.net/, accessed: 2014-01-07.
[4] “Amazon kinesis,” http://aws.amazon.com/kinesis/, accessed: 2014-01-07.
[5] G. Malewicz, M. H. Austern, A. J. Bik, J. C. Dehnert, I. Horn, N. Leiser, and G. Czajkowski, “Pregel: a system for large-scale graph processing,” in Proceedings of the 2010 ACM SIGMOD International Conference on Management of data. ACM, 2010, pp. 135–146.
[6] Y. Simmhan, A. Kumbhare, C. Wickramaarachchi, S. Na-garkar, S. Ravi, C. Raghavendra, , and V. Prasanna, “Goffish : A sub-graph centric framework for large-scale graph analytics,” USC, Tech. Rep. 13-936, 2014, http://arxiv.org/pdf/1311.5949v1.pdf.
[7] C. C. Aggarwal and H. Wang,Managing and mining graph data. Springer, 2010, vol. 40, ch. Query language and access methods for graph databases.
[8] J. Dean and S. Ghemawat, “Mapreduce: Simplified data processing on large clusters,” Commun. ACM, vol. 51, no. 1, pp. 107–113, Jan. 2008. [Online]. Available: http://doi.acm.org/10.1145/1327452.1327492
[9] B. Shao, H. Wang, and Y. Li, “Trinity: A distributed graph engine on a memory cloud,” in Proceedings of the 2013 ACM SIGMOD International Conference on Management of Data, ser. SIGMOD ’13. New York, NY, USA: ACM, 2013, pp. 505–516. [Online]. Available: http://doi.acm.org/10.1145/2463676.2467799
[10] U. Kang, C. Tsourakakis, and C. Faloutsos, “Pegasus: A peta-scale graph mining system implementation and observations,” inData Mining, 2009. ICDM ’09. Ninth IEEE International Conference on, 2009, pp. 229–238.
[11] Y. Low, J. Gonzalez, A. Kyrola, D. Bickson, C. Guestrin, and J. M. Hellerstein, “Distributed graphlab: A framework for machine learning in the cloud,”CoRR, vol. abs/1204.6078, 2012.
[12] S. Asur, S. Parthasarathy, and D. Ucar, “An event-based framework for characterizing the evolutionary behavior of interaction graphs,”ACM Trans. Knowl. Discov. Data, vol. 3, no. 4, pp. 16:1–16:36, Dec. 2009. [Online]. Available: http://doi.acm.org/10.1145/1631162.1631164
[13] R. Cheng, J. Hong, A. Kyrola, Y. Miao, X. Weng, M. Wu, F. Yang, L. Zhou, F. Zhao, and E. Chen, “Kineograph: Taking the pulse of a fast-changing and connected world,” in Proceedings of the 7th ACM European Conference on Computer Systems, ser. EuroSys ’12. New York, NY, USA: ACM, 2012, pp. 85–98. [Online]. Available: http://doi.acm.org/10.1145/2168836.2168846
[14] D. Ediger, R. McColl, J. Riedy, and D. Bader, “Stinger: High performance data structure for streaming graphs,” in
High Performance Extreme Computing (HPEC), 2012 IEEE Conference on, 2012, pp. 1–5.
[15] D. Ediger, J. Riedy, D. A. Bader, and H. Meyerhenke, “Tracking structure of streaming social networks.” IEEE, pp. 1691–1699. [Online]. Available:
http://ieeexplore.ieee.org/lpdocs/epic03/wrapper.htm?arnumber=6009035 [16] W. Fan, J. Li, J. Luo, Z. Tan, X. Wang, and Y. Wu,
“Incremental graph pattern matching,” in Proceedings of the 2011 ACM SIGMOD International Conference on Management of Data, ser. SIGMOD ’11. New York, NY, USA: ACM, 2011, pp. 925–936. [Online]. Available: http://doi.acm.org/10.1145/1989323.1989420
[17] A. Fard, A. Abdolrashidi, L. Ramaswamy, and J. Miller, “Towards efficient query processing on massive time-evolving graphs,” in Collaborative Computing: Networking, Applica-tions and Worksharing (CollaborateCom), 2012 8th Interna-tional Conference on, 2012, pp. 567–574.
[18] R. McColl, O. Green, and D. Bader, “A new parallel algorithm for connected components in dynamic graphs,” in IEEE International Conference on High Performance Computing. [Online]. Available:
http://www.stingergraph.com/data/uploads/papers/dynamiccomponents.pdf [19] P. R. Mullangi and L. Ramaswamy, “Scissor: Scalable
and efficient reachability query processing in time-evolving hierarchies,” in Proceedings of the 22Nd ACM International Conference on Conference on Information & Knowledge Management, ser. CIKM ’13. New York, NY, USA: ACM, 2013, pp. 799–804. [Online]. Available: http://doi.acm.org/10.1145/2505515.2505732
[20] J. Riedy, H. Meyerhenke, D. Bader, D. Ediger, and T. Matt-son, “Analysis of streaming social networks and graphs on multicore architectures,” in Acoustics, Speech and Signal Processing (ICASSP), 2012 IEEE International Conference on, 2012, pp. 5337–5340.
[21] B. Hendrickson and T. G. Kolda, “Graph partitioning models for parallel computing,”Parallel computing, vol. 26, no. 12, pp. 1519–1534, 2000.
[22] S. Salihoglu and J. Widom, “GPS: A Graph Processing System,” Stanford InfoLab, Tech. Rep., 2013.
[23] T. Bass, “Mythbusters: Event stream processing versus complex event processing,” in Proceedings of the 2007 Inaugural International Conference on Distributed Event-based Systems, ser. DEBS ’07. New York, NY, USA: ACM, 2007, pp. 1–1. [Online]. Available: http://doi.acm.org/10.1145/1266894.1266896
[24] D. Robins, “Complex event processing,” 2010.
[25] M. P. Consens and A. O. Mendelzon, “Graphlog: A visual formalism for real life recursion,” inProceedings of the Ninth ACM SIGACT-SIGMOD-SIGART Symposium on Principles of Database Systems, ser. PODS ’90. New York, NY, USA: ACM, 1990, pp. 404–416. [Online]. Available: http://doi.acm.org/10.1145/298514.298591
[26] R. H. G¨uting, “Graphdb: Modeling and querying graphs in databases,” in Proceedings of the 20th International Conference on Very Large Data Bases, ser. VLDB ’94. San Francisco, CA, USA: Morgan Kaufmann Publishers Inc., 1994, pp. 297–308. [Online]. Available: http://dl.acm.org/citation.cfm?id=645920.672980
[27] D. H. Kim, I. D. Yun, and S.-U. Lee, “A new attributed relational graph matching algorithm using the nested structure of earth mover’s distance,” in Pattern Recognition, 2004. ICPR 2004. Proceedings of the 17th International Conference on, vol. 1, 2004, pp. 48–51 Vol.1.
[28] “Twitter,” https://twitter.com/, accessed: 2014-01-07. [29] “Friendfeed,” http://friendfeed.com/, accessed: 2014-01-07.