PAPER • OPEN ACCESS
A Detection Method of Dense Harmonics/Inter-harmonics Based on
Improved All-phase Time-shifting Method and ZoomFFT
To cite this article: Qing Zhang et al 2021 J. Phys.: Conf. Ser. 1750 012013
View the article online for updates and enhancements.
A Detection Method of Dense Harmonics/Inter-harmonics
Based on Improved All-phase Time-shifting Method and
ZoomFFT
Qing Zhang 1, Xingyue Cai 2*, Wenbo Li 3, Zhaorui Liu 4, Xueqing Meng 5
1Estate Management Office, Hunan University, Changsha, Hunan, China
2,3,4,5College of Electrical and Information Engineering, Hunan University, Changsha, Hunan, China
*Corresponding author’s e-mail: [email protected]
Abstract. Aiming at the complex situation of intensive harmonics/inter-harmonics in power
signals, this paper proposes an analysis method based on improved all phase time shift phase difference method and ZoomFFT. Firstly, the Hankel matrix of the input signal is constructed, and the TLS-ESPRIT algorithm is used to obtain the frequency components in the signal. The relationship between the peak spectral line and the frequency offset in the all phase time shift method is derived. The amplitude information of the input signal is calculated. The phase information of the input signal is obtained by analyzing the "phase invariant" characteristic of the all phase FFT spectrum. The frequency interval of adjacent frequencies is used to judge whether there is density. If there are intensive harmonics/inter-harmonics, TLS-ESPRIT method is used to calculate the center frequency of the dense spectrum and construct a complex analytic band-pass filter to improve the ZoomFFT method to extract the frequency and amplitude information of the signal at the dense spectrum; If there is no intensive harmonic/inter-harmonic, the improved all phase time shift method is used to extract the parameters of the input signal. Simulation results show that the proposed algorithm can effectively and accurately extract the frequency, amplitude and phase parameters of dense harmonics/inter-harmonics under the conditions of multiple dense spectrum, fluctuation of fundamental frequency and noise interference.
1. Introduction
With the integration of distributed generation and nonlinear power electronic devices into the power grid, a large number of harmonics and inter-harmonics are injected into the power grid, which has a
great impact on the power quality of the power grid[1]. When the inter-harmonic frequency is close to
the grid harmonic frequency, the inter-harmonic spectrum leakage is superimposed on the harmonic
spectrum, resulting in serious main lobe interference between harmonics and inter-harmonics[2-3].
Therefore, it is of great significance for the safe and stable operation of power grid to extract the harmonics/inter-harmonics parameters accurately.
The fast Fourier method (FFT) and discrete Fourier (DEF) methods in [4-7] are commonly used in signal processing, but they are prone to "spectrum leakage" and "fence effect". Prony algorithm proposed in [8] can effectively alleviate spectrum leakage. The sampling data are combined into exponential linear combination to calculate the analytic value of each frequency component to determine the frequency component. This method has high detection accuracy, but it is easy to be affected by noise.
2
Hilbert Huang transform proposed in [9-10] is used to decompose the signal in time domain, but this method is prone to mode aliasing. Variable mode decomposition (VMD) in [11] is proposed to decompose the frequency components of power signals, and the input signals are divided into discrete signals with sparse characteristics. This method can detect inter-harmonic components and time-varying spectrum components, but it needs to set the bandwidth and the number of decomposition modes, which is lack of self-adaptability. The atomic decomposition (AD) method proposed in [12] and the wavelet decomposition method proposed in [13] decompose the signal in the frequency domain. The atomic decomposition method performs the main lobe decomposition of the signal in the frequency domain, and the wavelet decomposition extracts the signal parameters by selecting the appropriate wavelet basis, with high accuracy. However, neither the atomic decomposition method nor the wavelet decomposition method can accurately extract the parameters of harmonics/inter-harmonics with similar frequencies in the frequency domain, and the amount of calculation is large.
All-phase FFT analysis method proposed in [14-15] to detect harmonics has a good ability to suppress spectrum leakage. The time-shift phase difference method further improves the frequency resolution of the all phase method, but it is still limited by the sampling frequency and the number of sampling points. The TLS-ESPRIT method proposed in [16] has the characteristics of high resolution, but it cannot directly obtain the yield information in the signal. The advantages of ZoomFFT method proposed in [17] refine the frequency spectrum of harmonics/inter-harmonics with similar frequency, accurately measure the frequency and amplitude information, and reduce the amount of calculation. Therefore, in this paper, the advantages and disadvantages of the above analysis methods are comprehensively used, and the improved all phase time shift method and ZoomFFT method are combined to establish a dense harmonic/inter-harmonic signal analysis method suitable for complex power system. Firstly, Hankel matrix is constructed for the input signal, and the relationship between peak spectral line and frequency offset in all phase time-shift method is derived. The amplitude calculation formula in all phase time-shift method is improved to obtain the frequency components of input signal. The phase information of input signal is extracted by using the "phase invariant" characteristic of all phase time-shift method, and the frequency interval between adjacent frequencies is used to judge whether there is intensive type. If there are intensive harmonics/inter-harmonics, TLS-ESPRIT algorithm is used to obtain the center frequency of each dense spectrum, and ZoomFFT is used to refine the frequency and amplitude of dense spectrum; if there is no dense spectrum component, the improved full phase time-shift phase difference method is used to extract the frequency, amplitude and phase parameters of input signal, and the simulation results are compared. Experimental results show that the proposed algorithm is effective and accurate in the case of multiple dense spectrum, fluctuation of fundamental frequency and noise interference.
2. Improved apFFT time shift phase difference method
The input signal is assumed to be a single frequency complex exponential sequence:
0 0
( )
( ) j w , [ 1, 1]
x n Ae n N N (1)
Where A is the amplitude, w0=2πfi/N is the angular frequency.
The discrete spectrum is obtained by all phase FFT.
0 0 ( ) 2 0 ( ) j w n ( ) g Y k Ae F k w w (2)
Where Δw=2π/N, k*is the peak line.
In all phase time-shift phase difference, the original sequence is analyzed by apFFT to obtain the
phase of the initial sequence, and then the phase of the sequence after delay L is calculated. Finally, the
frequency offset δ is obtained by using the difference between the two.
The phase difference obtained by the all-phase time shift phase difference method is
* * *1 k 2 k (k ) wL
From equation (3), it can be concluded that the phase difference will increase with the increase
of time shift L, and the range of is [-2π, 2π]. Therefore, the phase difference in equation (3) is
compensated by the phase compensation of 2πk*L/n.
* 2 k L N* / (k* ) wL
(4)
From formula (4), it can be concluded that the phase difference will change with the change of
L in the time-shift phase difference method, and the range of phase difference should be [-2π, 2π],
will exceed the range, resulting in "phase ambiguity", and the frequency offset δ obtained from
phase difference needs to be corrected to make its range in [-0.5,0.5]. Therefore, TLS-ESPRIT method is used to improve apFFT time-shift phase difference method.
In equation (1), the input signal is composed of K inter-harmonics and a white noise with mean value
of σ2: 1 ( ) i s cos(2 ) ( ) k T n i i s i i x n A e f T n r n
(5)Where n=0,1,2 … N, N is the sampling value; Ts is the sampling period; K is the number of signal
frequencies; αi, fi, Ai and θi are the damping factor, frequency, original amplitude and initial phase of
each frequency component respectively.
From the TLS-ESPRIT algorithm, the frequency fi’ value of each frequency component in the input
signal is ' arg( ) 2 i i s f f (6)
In the amplitude spectrum of apFFT, the corresponding line frequency is
' ' i i f k f (7)
In the apFFT amplitude spectrum, the nearest distance from ki’ is the peak spectral line k*, so the
frequency offset at the peak spectral line is
' ' ' * i * i f k k k f (8)
The frequency offset calculated by formula (8) does not need to be corrected, and there is no error
caused by correction. In addition, in this paper, the time shift L is set to N, so the phase compensation
caused by the time shift is avoided.
The discrete spectrum of the sequence x’(n) with delay L=n is
0 ' 2 * 2( ) (( ) ), 0,1, 1 j g Y k A e F k k w k N (9)
Where Δw=2π/N, k* is the peak line and δ is the frequency offset.
Then the amplitude correction formula is
* 2 ' 2 ' ( ) ( ) g Y k A F (10)
3. Improved Zoom FFT method
Because the frequency resolution of apFFT time-shift phase difference method is related to the sampling frequency and the number of sampling points, when the signal contains harmonics/inter-harmonics with similar frequency, the full phase time-shift phase difference method will produce large error when the
4
signal parameters are extracted. Therefore, this paper uses ZoomFFT based on complex analytic band-pass filter to analyze the harmonic/inter-harmonic with similar frequency.
The input signal is resampled to obtain x(n), where n=0,1,2, …, DN+2M. The sampling frequency is
fs, D is the zoom multiple, N is the number of FFT points, M is the half order of the filter, and the periodic
spectrum of sample x(n) is X(k). The complex analytic bandpass filter h(k) is constructed:
0 0 0 2sin( ) 1 ( ) 2 2 w jkw w w kw h k e d k
(11)The upper and lower cut-off frequencies of the complex analytic bandpass filter are
1 2 / (4D) / (4D) e s e s f f f f f f (12)
Where fe is the center frequency, fs is the sampling frequency, D is the zoom multiple, and the
bandwidth is fs /2D.
From equation (12), it can be seen that the upper and lower cut-off frequencies of the complex analytical band-pass filter are the refined frequency bands of the input signal. When the central frequency is set unreasonably, the frequency and amplitude parameters at the harmonics/inter-harmonics with similar frequency can not be accurately obtained. Therefore, TLS-ESPRIT method is used to
improve ZoomFFT to accurately obtain the center frequency fe.
The frequency fi measured by TLS-ESPRIT algorithm is sorted:
1 2 i k( 1, 2 , )
f f f f i k (13)
Where k is the number of harmonic/inter-harmonic frequency components in the signal.
The frequency difference between fi and fi+1 is recorded as df:
1 ( 1, 2 ) i i
df f f i k (14)
When df < 6 fs/N, it is considered that there are harmonics/inter-harmonics with similar frequency in
the input signal. ZoomFFT is used to detect the signal, and the center frequency fe is
1 2 m e f f f f m (15)
Where f1, f2 … fm is the frequency of the adjacent frequency df < 6fs/N is the frequency of the adjacent
component.
Therefore, the frequency parameter and amplitude parameter of the dense harmonics/inter-harmonics extracted by zoomFFT is ' 1 ( / 2 1) f f N df (16) ' ( ( (1: / 2)) / 2)2 Y abs y N N (17) Where df=fs/D/N.
The ZoomFFT method based on complex analytic band-pass filter is used to shift the frequency of
N point only. Compared with the traditional ZFFT, the computational complexity is reduced. The greater
the ratio D, the more prominent this advantage.
4. Simulation experiment
4.1. Detection of multiple dense spectrum
The parameter settings of the input signal are shown in table 1. It can be seen from table 1 that there are
is 20.65Hz and 50.55Hz. The upper and lower cutoff frequencies of the complex analytical bandpass
filter are [18.943, 22.356] and [48.843, 52.256]. The complex modulation filter selects N=2048 points
X(n) after decimation and filtering. After complex modulation and frequency shifting, Y(n) is obtained,
and finally N point FFT is performed.
It can be seen from table 2 that the relative error of frequency parameter extraction is within 5.1×10E-12%, the relative error of amplitude parameter extraction is within 0.7%, and the relative error of phase parameter extraction is within 8.5%.
Table 1. Parameters containing dense spectrum signals.
Parameter Frequency Amplitude phase
Inter-harmonics 1 20.3 0.4 70
Inter-harmonics 2 21 0.2 60
Fundamental wave 50.1 1 100
Inter-harmonics 3 51 0.3 99
Inter-harmonics 4 187 0.9 185
Table 2. The relative error of parameter extraction with multiple dense spectra.
Parameter Relative error of
frequency(%) Relative error of amplitude(%) Relative error of phase(%) Inter-harmonics 1 1.487E-12 0.125 1.753 Inter-harmonics 2 1.420E-12 0.200 8.499 Fundamental wave 3.190E-12 0.100 0.070 Inter-harmonics 3 5.099E-12 0.633 0.529 Inter-harmonics 4 0 4.440E-13 5.380E-13
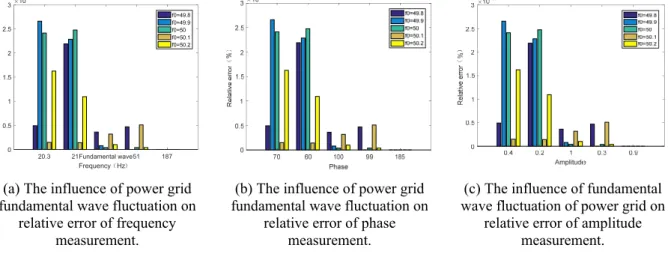
4.2. Influence of fundamental frequency fluctuation
In the actual power system, the fundamental frequency of power grid fluctuates. The input signal parameters are shown in table1, and the fluctuation range of fundamental frequency is 49.8Hz~50.2Hz. The algorithm proposed in this paper is simulated and analyzed.
It can be seen from figure 1(a)-(c) that the relative error of phase and amplitude parameters extracted by the method proposed in this paper is basically unchanged when the fundamental frequency of power grid is fluctuating continuously. When the fundamental wave frequency fluctuates, the extraction of frequency parameters has a great influence, but the relative error of the extraction of frequency parameters is within 3×10E-11%, and the extraction accuracy is high. It can be concluded that the method proposed in this paper can still accurately extract the parameter information of multi intensive inter spectral harmonics when the fundamental frequency of power grid fluctuates.
(a) The influence of power grid fundamental wave fluctuation on
relative error of frequency measurement.
(b)The influence of power grid fundamental wave fluctuation on
relative error of phase measurement.
(c)The influence of fundamental wave fluctuation of power grid on
relative error of amplitude measurement.
Figure 1. Relative error of signal parameter extraction when there is fundamental wave fluctuation.
20.3 21Fundamental wave51 187 Frequency(Hz) 0 0.5 1 1.5 2 2.5 3 10-11 f0=49.8 f0=49.9 f0=50 f0=50.1 f0=50.2
6
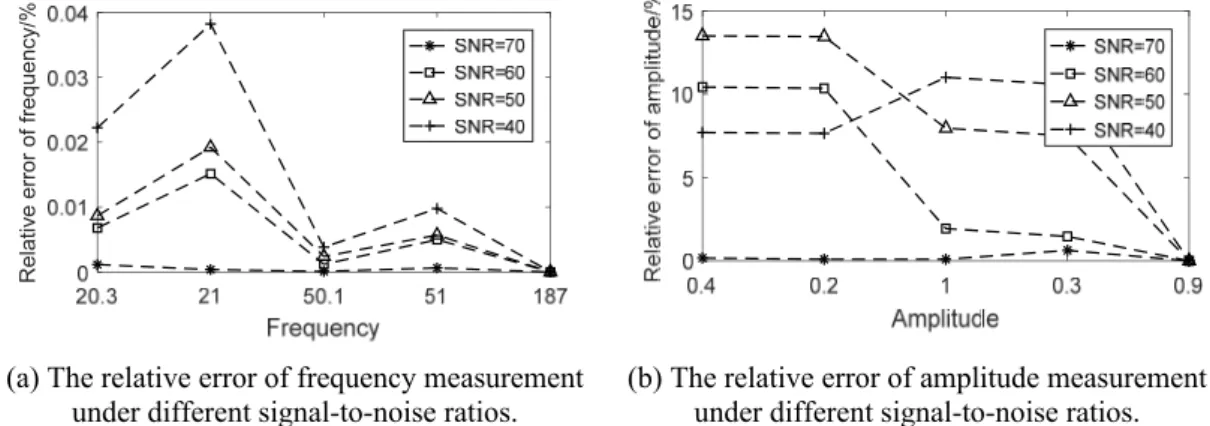
4.3. Influence of noise interference
The existence of noise will have a great impact on the measurement of Inter-harmonics, especially at the dense spectrum. In order to analyze the anti-noise performance of this algorithm, the white noise signal-to-noise ratio range is set to 40dB~70dB. The setting of other simulation parameters is shown in table 1. The frequency and amplitude errors are shown in figure 2.
(a) The relative error of frequency measurement under different signal-to-noise ratios.
(b)The relative error of amplitude measurement under different signal-to-noise ratios.
Figure 2. Relative error of signal parameter extraction in the presence of noise interference. It can be seen from figure.3 that when the signal contains noise, the relative error of amplitude measurement at 187Hz is less than 0.3%, and the relative error of frequency measurement is within 4×10⁻⁵%. When the relative amplitude of SNR is less than 50%, the measurement error is within 10% when the relative frequency is more than 50%. It can be seen that the algorithm proposed in this paper has good anti-noise performance, and can extract frequency and amplitude parameters accurately when there is noise in the signal.
4.4. Comparison with common algorithms
From the comparison results of table 3 and table 4, it can be seen that the accuracy of parameter extraction of harmonics/inter-harmonics with similar frequency based on bispectral interpolation is differential, and the maximum error is 1. Compared to the FFT method based on bispectral interpolation, the all phase FFT spectrum analysis method has better detection accuracy, and its frequency and phase measurement are better than that of bispectral interpolation FFT, but its detection error of amplitude is larger, and the relative error of amplitude measurement reaches 78% when the frequency interval is small. The method proposed in this paper is superior to the above two methods in both amplitude and
frequency measurement, especially for frequency measurement, the accuracy is 10-10. Therefore, the
algorithm proposed in this paper is more accurate.
Table 3. Relative error comparison of frequency detection results.
Frequency Bispectral interpolation FFT (%) Analysis of apFFT spectrum (%) Method in this paper (%) 49.6 0.389575843 0.651286 0.1 50.1 10.13297495 1.64279 0.2 160.3 -6.903287647 0.023235 0.1 161 6.202411308 0.217134 0.2 161.5 0.588186304 0.198629 4.3
Table 4. Relative error comparison of amplitude detection results.
Frequency Bispectral interpolation
FFT (%) Analysis of apFFT spectrum (%) Method in this paper (%)
1 -137.652 53.21556 7.048E-12 1.5 100 2.143705 5.786E-12 0.8 -31.9598 -51.4432 2.744E-11 Relat iv e error of f requenc y/ %
0.3 100 422.5626 6.957E-11
0.9 100 78.39606 4.829E-11
5. Conclusion
In this paper, a method combining improved all phase time shift method with Zoom FFT for dense harmonics/inter-harmonics detection is proposed. By using the high resolution characteristics of TLS-ESPRIT and ZoomFFT and the "phase invariant" characteristic of all phase, the frequency, amplitude and phase information of dense harmonic/inter-harmonic signal can be accurately extracted. Simulation results show that the frequency interval between adjacent frequencies can accurately judge whether the
input signal has dense spectrum or not;the TLS-ESPRIT method is proposed to correct the amplitude
calculation formula in the omni-directional time-shift method to realize the accurate extraction of amplitude; the proposed method guarantees multi intensive harmonics/inter-harmonics, fundamental frequency fluctuation and noise interference. Compared with the existing harmonic/inter-harmonic detection methods, the proposed method has higher detection accuracy.
References
[1] De Almeida Prado T, Macario Barros A and Guarneri G A 2019 IEEE Access7 163958-68
[2] Chen B, Pin G, Ng W M, Li P, Parisini T and Hui S R 2018 IEEE Transactions on Power
Electronics33 9318-30
[3] Narduzzi C, Bertocco M, Frigo G and Giorgi G 2018 IEEE Transactions on Instrumentation and
Measurement 67 1825-35
[4] Xu Y, Du Y, Li Z, Xi L and Mi L 2020 IET Communications14 28-36
[5] Fan L, Qi G, Xing J, Jin J, Liu J and Wang Z 2020 IEEE Access 8 44373-80
[6] Fusheng Zhang, Zhongxing Geng and Wei Yuan 2001 IEEE Transactions on Power Delivery16
160-164
[7] Lin H C 2013 Canadian Journal of Electrical and Computer Engineering36 158-171
[8] Khodaparast J and Khederzadeh M 2017 IET Generation, Transmission & Distribution 18
4406-13
[9] Afroni M J, Sutanto D and Stirling D 2013 IEEE Transactions on Power Delivery28 2134-44
[10] Li P, Gao J, Xu D, Wang C and Yang X 2016 Journal of Modern Power Systems and Clean
Energy 4 19-27
[11] Achlerkar P D, Samantaray S R and Sabarimalai Manikandan M 2018 IEEE Transactions on
Smart Grid 4 3122-32
[12] Hao Z, Yu W and Chen W 2019 The Journal of Engineering 2019 6354-58
[13] Tiwari V K and Jain S K 2016 IEEE Transactions on Instrumentation and Measurement65
1585-95
[14] Su T, Yang M, Jin T and Costa Flesch R C 2018 IET Renewable Power Generation 12 953-61
[15] Boughambouz A, Bellabas A, Magaz B, Menni T and El Mounir Abdelaziz M 2017 Seminar on
Detection Systems Architectures and Technologies 1-4
[16] Samal S. K and Subudhi B 2019 IET Generation Transmission & Distribution13 4123-40
[17] Zhou J, Lei L and Liu N 2019 IEEE 19th International Conference on Communication
Technology 786-9