Penguins Search Optimisation
Algorithm for Association
Rules Mining
Youcef Gheraibia
1, Abdelouahab Moussaoui
2, Youcef Djenouri
3,
Sohag Kabir
4and Peng Yeng Yin
51Faculty of Science, Department of Computer Science and Mathematics, University of Mohammed Cherif Messaadia, Algeria 2Department of Computer Science, University of Feraht Abaas, Setif, Algeria
3Computer Science Department, Saad Dahlab University, Blida, Algeria 4Department of Computer Science, University of Hull, Hull, UK
5Department of Information Management, National Chi Nan University, Puli, Taiwan
Association Rules Mining (ARM) is one of the most popular and well-known approaches for the decision-making process. All classic exhaustive ARM algo-rithms are time consuming and generate a very large number of association rules, even the recent proposed meta-heuristics based methods generate a small num-ber of high quality rules but with high overlapping. To deal with this issue, we propose a new ARM approach based on penguins search optimisation algorithm (Pe-ARM for short). Moreover, an efficient measure is incorporated into the main process to evaluate the amount of overlapping among the generated rules. The proposed approach also ensures a good diversifi-cation over the whole solutions space. To demonstrate the effectiveness of the proposed approach, several experiments have been carried out on different data sets and specifically on the biological ones. The re-sults reveal that the proposed approach outperforms the well known meta-heuristics ARM algorithms in both execution time and solution quality.
ACM CCS (2012) Classification: Information systems → Information systems applications → Data mining → Association rules;
Theory of computation → Design and analysis of algorithms → Mathematical optimization → Mixed discrete-continuous optimization → Bio-inspired op -timization
Keywords: association rules mining, penguins search optimisation algorithm, overlap measure, biological data-set, ARM
1. Introduction
Association Rules Mining (ARM) is one of the most challenging and important tasks in data mining [1]. ARM problem was first introduced
by Agrawal and Shafer in [2]. It can be forma-lised as:
Let I = {i1, i2, i3, ..., in} be a set of items and
T = {t1, t2, t3, ..., tm} be a set of transactions. An association rule is an implication of the form
X →Y such as X ⊆I, Y I⊆ , and X Y∩ = ∅.
PSO-ARM [12], ACOR [13] and BSO-ARM
[14] for swarm intelligence. Authors in [15] have presented a survey on swarm intelligence (SI) approaches used for automatic program-ming. These algorithms have the potential to give only a subset of all relevant rules. There-fore, two challenges can be derived, the com-putation time of exact algorithms by exploring all rules space on one hand and the quality of extracted rules using meta-heuristics based approaches by taking into account the similar rules on the other hand.
The penguins search optimisation algorithm (PeSOA) [16] is a nature inspired approach based on the collaborative hunting strategies of penguins. The penguins synchronise their dives to reduce the expenditure of energy in their hunting process. This strategy is used in the algorithm to quickly converge towards an optimal solution. The diversification strategy of the penguins search algorithm allows penguins to explore the whole solution space efficiently. The search process of penguins is based on the reserve of oxygen which allows penguins to de-cide whether to accelerate or decelerate while exploring the search space and also to decide whether to search or not in a given region. This has motivated the use of the PeSOA for the association rules mining problem to facili-tate efficient exploration of the solution space. The objective function of the algorithm is to maximise the average of the statistical measure of the confidence and the support. We incorpo-rate a new distance measure called overlapping distance to compute the amount of overlap be-tween the generated rules. The rules that satisfy the maximum accepted overlap will be evalu-ated for the optimisation process. The overlap-ping distance helps the penguins search pro-cess to generate only the non redundant rules with low amount of overlapping among them. In this paper, a new algorithm called Pe-ARM (PeSOA: for association rules mining) is pro-posed to find a set of consistent, high quality rules with low amount of overlapping. This set of rules must cover the maximum number of transactions in the database.
The rest of the paper is organised as follows: in the next section, relevant works on association rule mining with diverse applications are pre-sented. Then, the penguins search optimisation algorithm is introduced in Section 3, followed by the proposed Pe-ARM approach in Section 4.
The experimental results with both standard and biological data sets are reported in Section 5. Conclusion and future perspectives of the present work are provided in Section 6.
2. Related Works
ARM approaches can be divided into two main categories, exact and meta-heuristic based methods. This section reports some existing ARM approaches from both categories.
2.1. ARM with Exact Methods
The well known ARM exact algorithms are Ap-riori [5], AIS (Agrawal, Imielinski, Swami) [2], Eclat [9] and FP-Growth [6]. The Apriori algo -rithm is the most used exact algo-rithm for asso-ciation rule mining. It starts by finding all item sets that satisfy minimum support (frequent item sets) also called large item sets. After that, Apriori uses these frequent item sets to generate association rules. AIS is the first proposed al-gorithm for mining association rules. The main drawbacks of this algorithm are that it requires multiple scanning of database, i.e., it is time consuming and requires more storage space. FP-growth uses FP-tree structure to compress the database, where a divide-and-conquer strat-egy is performed to decompose the mining tasks and the database as well. When dealing with large transactional database, these algo-rithms become high time and memory consum-ing. Thereafter, different approaches have been proposed to ameliorate the exact methods such as reducing the number of passes over the da-tabase, sampling the dada-tabase, using parallel-ism, and adding constraints on the structure of rules [17].
2.2. ARM with Metaheuristics
Metaheuristics have been used to reduce the run time of the existing ARM algorithms. Genetic algorithm (GA) is the first evolutionary algo-rithm used to solve the ARM problem, such as GENAR [18], GAR [19]. Those two methods used the standard version of the genetic algo-rithm with poor representation of the solutions. Authors in [20] proposed a new application of GA for mining multi-dimension association rule
approach, each rule is modelled as a mass and all the masses attract each other according to the law of motion. Each iteration is based on the previous one and takes only the k-heaviest masses in order to influence the new masses. The algorithm generates few rules because the search space is reduced at each iteration.
Authors in [26] proposed an ARM algorithm based on Ant programming. The aim of the ap-proach is to discover the rare association rule by using two algorithms. The first algorithm evalu-ates each association rule with single-objective function to evaluate each individual separately, then the second algorithm considers simultane-ously several objectives to evaluate individuals' fitness discovery of rare association rules. Au-thors in [27] proposed a new hybrid algorithm called (HBSO-TS) for association rule mining based on hybrid method based on Bees Swarm Optimisation (BSO) and Tabu Search (TS). BSO is used to explore the search space so that it can cover most of its neighbours.
2.3. ARM Applications for Genomic
Algorithms for Association Rule Mining have been extensively developed in market basket analysis, and further studies concerning biolog-ical data sets are already available. In [28], the authors apply association rule mining process for genomic. Ant based Association Rule Min-ing (Ant-ARM) is employed to discover clas-sification of rules for one particular class only, each ant is used to construct one Classification Association Rule and change one item set at a time. An improved method for integrated anal-ysis of gene expression has been proposed us-ing additional data [29]. Temporal association rules have been used to represent dependencies between different factors on gene regulatory network [30]. Recent works on biological data analysis based on association rules mining are reviewed in [31].
3. Penguins Search Optimisation
Algorithm
Penguins search optimisation algorithm (Pe-SOA) is a new swarm based meta-heuristic algo-rithm which was proposed in [16]. The PeSOA algorithm has been used to solve combinatorial called Adaptive Genetic Algorithm (AGA). This
approach uses a matrix for the mutation and the crossover. Two major differences between the classical GENAR and AGA are the mutation and the crossover. AGA uses parameter-free for the genetic operators, which means that the se-lection, the mutation, and the crossover are cho-sen automatically by the problem at a particular stage of evolution. Afterwards, several methods for improving genetic algorithm for association rule mining have been proposed to ameliorate genetic operators and the representation of solu-tions, such as ARMGA [10]. Often a hybrid method is used to reduce the cost, as well as to improve the original methods. A novel hybrid genetic based algorithm called PQGMA has been applied for association rules mining with the use of simulated annealing for the mutation and the crossover operations respectively. Quan-tum computing based method [21] uses an adap-tive mutation rate, and provides a diversified population. G3APRM [11] is a new method for association rule mining with the use of genetic programming based on the Grammar Guided Genetic Programming to avoid invalid individ-uals found by genetic programming process. Authors in [22] proposed an ARM algorithm based on an evolutionary algorithm to extract rare association rules. The proposed approach is developed for the learning management system to extract information about unusual student be-haviour. In [23], the authors reviewed all asso-ciation rule mining algorithms based on genetic algorithm and its hybridisation.
problems such as automotive safety integrity levels allocation [32], capitated vehicle routing problem [33] and optimal spaced seed finding [34]. The dietary behaviour of penguins may be explained by economic reasoning: it comes to a profitable food search activity when the gain of energy is greater than the expenditure required to obtain this gain. Penguins, behav-ing along the line of foragbehav-ing predators, must extract information about the time and cost to get food and the energy content of prey in order to choose the course for making their next dive. PeSOA is inspired by the penguins' hunting be-haviour and it generally works as follows. The population of penguins locates initial po-sitions (solution spaces), this population is di-vided into a set of groups, and each group is as-signed to a region in the whole solution space. Each penguin then dives and swims under the water to hunt fish while consuming its oxygen reserve. Different forms of the communication between penguins are occasionally taking place and the quantities of eaten fish increase. The process is repeated until a specified amount of fish is obtained or the maximum number of iterations is reached. The authors of [16] have shown that the PeSOA outperforms genetic algorithms and particle swarm optimisation in obtaining better values for benchmark opti-misation functions. After a number of dives, a penguin returns to the surface and shares with its group affiliates the position and quantity of the food found. So the local best of each group continuously improves as more members re-port the food sources. After an entire cycle of the intra-group communication among all the penguin groups, the penguins might migrate to another group's habitat according to the prob-ability of nutrition existence of each group in terms of the quantity of food found by all its members. The oxygen reserve depends on both the gain of the food source and the swimming duration a penguin endures. If the energy gain is positive, the longer the penguin stays under the water, the larger quantities of food it catches and thus becomes healthier. Otherwise, the lon-ger the swimming duration, the more oxygen the penguin consumes. Hence, the oxygen re -serve is updated according to the amelioration of the objective function. The oxygen reserve increases if the new solution is better than the previous one, and the oxygen reserve decreases in the opposite case. Local search strategy has been used with different swarm based
meta-heu-ristics algorithm to compensate errors from discretisation [35]. A neighbourhood search strategy is implemented to explore around the penguins' position based on the oxygen reserve.
4. Pe-ARM: PeSOA for Association
Rules Mining
4.1. Encoding
When using the individual rule presentation, using a vector to encode a given individual, bi-nary and integer encodings are the most used [36]. In binary encoding, each solution is rep-resented by a vector S of n elements where n is the number of items. The ith element of a given solution S is set to 1 if the item i is in the rule and 0 otherwise. However, in integer encod -ing, the solution is represented by a vector S of
k+1 elements where k is the size of the rule. The first element is the separator index between the antecedent and the consequent parts of the solution. For all other elements i in S, if S[i] = j
then the item j appears in the ith position of the rule. In Pe-ARM, both representations are com-bined to make an application of the penguins search operations and the fitness computation process easier. Indeed, three values (0,1,2) are used to interpret the presence of a given item in the rule. The value 0 means that the item is absent from the rule. The value 1 means that the item is present in the antecedent part of the rule. The value 2 means that the item participates in the consequent part of the rule. More formally, we have:
1. S[i] = 0 if the item i is not in the solution S. 2. S[i] =1 if the item i belongs to the antece-
dent part of the solution S.
3. S[i]=2 if the item i belongs to the conse-quent part of the solution S.
This representation allows to separate the an-tecedent part from the consequent part where each single position of a given solution has the full interpretable information. Moreover, such representation is flexible and helps us in the calculation of the overlap measure.
Example: Let I = {i1, i2, ..., i10} be a set of items.
The solution S1 = {0, 0, 0, 1, 2, 1, 0, 0, 0, 0}
represents the rule r1 : i4, i6⇒i5.
4.2. Overlapping Measure
The optimisation of ARM aims to maximise the average of the confidence and of the support to the generated rules. Optimisation algorithm gives only a set of the pertinent rules having a high confidence and support values. However, the generated rules may be redundant or simi-lar [37]. To deal with this problem, we propose a new measure to evaluate the correlation be-tween the generated rules, allowing to maxi-mise the coverage of the target data. This new measure thus gives a set of consistent rules with minimum overlap.
Definition. Let I= {i1, ..., im} be a set of items;
D= {r1, ..., rn} be a set of association rules which can be defined as follows:
rx = {(X,Y)/X ⊆ I, Y ⊆ I and X∩ Y = ∅} Let μ be a function that computes the dissimi-larity between two rules:
| | 0
:
( , )i j kri k i( , )j
R
r r r r
+
=
∗ →
→
∑
D D µ
µ σ
1 2
1 2
1 2
1 2
1 2 12
0 if [( ) & ( )
or [( ) & ( )]
( , ) if [( ) & ( )
or [( ) & ( )]
1 if otherwise
k r k r k r k r
k k r k r
k r k r
i X i X
i Y i Y
r r i X i Y
i Y i X
σ
∈ ∈
∈ ∈
= ∈ ∈
∈ ∈
While Xr1, Xr2 are the X parts of r1 and r2
ele-ment (rule) respectively, and Yr1, Yr2 are the Y parts of r1 and r2 element (rule) respectively. Proposition 1. μ satisfies the usual conditions for a distance metric:
(i) μ(r1, r2) ≥ 0 and μ(r1, r2) = 0 if and only if
r1 = r2
(ii) μ(r1, r2) = μ(r2, r1)
(iii) μ(r1, r3) ≤μ(r1, r2) + μ(r2, r3) for any r1, r2, r3∈E*E.
Proof.
(i) μ(r1, r2) = 0 if and only if r1, r2 agree in
all items and this happens if and only if
r1{x} = r2{x} and r1{y} = r2{y}.
(ii) The number of items in which r1 differs from r2 is equal to the number of items in
which r2 differs from r1, because the dis-tance metric is equal to the sum of all items |r1| + |r2|
(iii) μ(r1, r2) is equal to the minimum num-ber of items which change their position, or necessary to add, to get r2 from r1. In its turn, μ(r2, r3) is equal to the minimum
number of items which change their posi-tion, or necessary to add, to get r3 from r2.
So μ(r1, r2) + μ(r2, r3) changes r1 to r3. Hence, μ(r1, r2) + μ(r2, r3) ≥μ(r1, r3) which
is the minimum number of items that change position, or necessary to add, to get
r3 from r1.
Example. Let I= {A,B,C,D,E,F} be a set of items and (r1, r2) are two rules defined as fol-lows:
r1: A, C→ D r2: C, D→ E
μ(r1, r2) = 2.5
μ(r1, r2) represents the amount of overlap be-tween the two association rules r1 and r2. The
amount of overlap for the two given rules can take a range of values from 0, which represents that the two rules are identical, to the sum of all items of the two rules |r1| + |r2| which
rep-resents that the two rules are absolutely distinct. In this example, the maximum overlap that can be found between the two rules is equal to six, so the amount of overlap μ(r1, r2) = 2.5 means
that the two rules are 41% distinct.
4.3. Fitness Function
are focused on the first aspect by taking the rules which maximise the average of the sup-port (Supp) and the confidence (Conf). The fit -ness value is computed only for the rules satis-fying the maximum accepted overlap where the maximum Overlap (Max-Overlap) is a prede-fined value that represents the maximum ac-cepted distance between each pair of rules. More formally, the fitness function F for a given solution S can be formulated as:
max( ) Supp S Conf S( ) 2 ( )
F S = +
where
| { | [ ] 0 [ ] , [1... ]} |
| |
| { | [ ] 0 [ ] , [1... ]} |
| { | [ ] 1 [ ] , [1... ]} |
( ) ( )
t T S i S i t i n
T
t T S i S i t i n
t T S i S i t i n
Supp S
Conf S
∈ ≠ ⇒ ⊆ ∀ ∈
∈ ≠ ⇒ ⊆ ∀ ∈
∈ = ⇒ ⊆ ∀ ∈
=
=
Example.
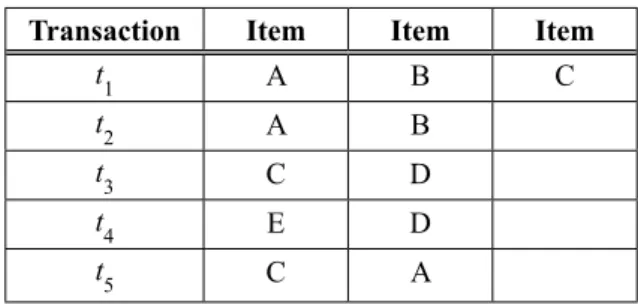
Table1. Illustration of transactional database for fitness computing.
Transaction Item Item Item
t1 A B C
t2 A B
t3 C D
t4 E D
t5 C A
Let us consider the transactional database (see Table 1) that contains 5 transactions T = {t1, t2, t3, t4, t5} and 5 items I = {A,B,C,D,E}. For instance,
to compute the support and the confidence of the solution S = (1,2,0,0,0) equivalent to the rule (A→B), the number of occurrences of the item set (A) and the item set (A,B) should be first de-termined. We notice that (A) is repeated 3 times and (A,B) are repeated together twice. As a result, the support of (A) is 3/5 and the support of (A,B) is 2/5. So, the confidence of (A→B) is 2 5
3 5 that equals to 2/3. Now, using equation (1), the fitness of S is calculated as: Fmax( )S =
( ) ( )
1 22 5× + ×1 22 3 ,which equals to 8
15.
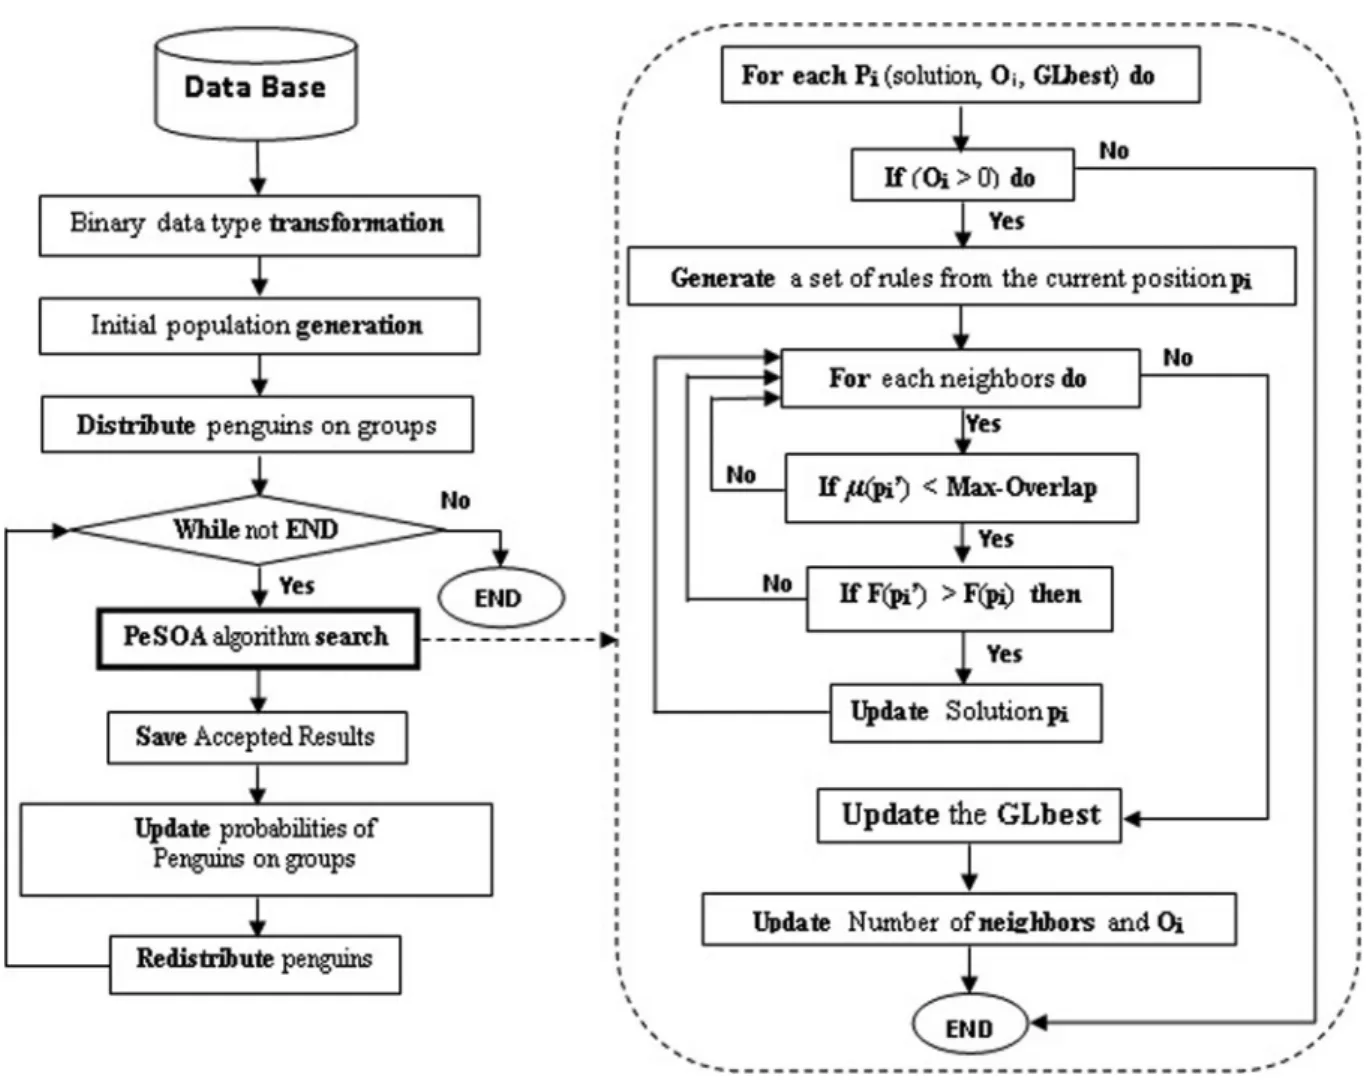
Figure 1. Penguins search optimisation algorithm for ARM.
4.4. Algorithm of Pe-ARM
Pe-ARM algorithm (see Figure 1) starts with generating a random population of penguins (each penguin represents a rule). This popula-tion is divided into groups, each group contains a variable number of penguins which is updated according to the penguins' health. The division of the initial population is based on the amount of overlapping between population rules. At first, a random penguin (Pr) is selected (will be the center of the first group) and all penguins that have a distance (amount of overlapping) from Pr less than the (Min-distance) will be added to this group. The Min-distance is equal to the average of distances between any two rules in the entire population. A new group is created if all other remaining penguins have a distance from Pr greater than Min-distance. The diversification generation strategy is used to generate K diversified groups in the initial penguin population. Pe-ARM starts with a pop-ulation distributed in K groups, and each group is placed in a separate region with a maximum distance from one to another. The purpose is to start the search with a set of diversified ini-tial solutions which have contrasting features benefiting future solution improvement and to control the non visited region in the coming it-erations.
Our main goal is to generate a set of consistent rules that have good fitness with small amount of overlap between them. The objective func-tion of a given solufunc-tion F(Pi) is formulated to maximise the average of statistical measure (confidence and support).
Each penguin generates from its rule another set of rules (neighbours). The best rule among these rules that optimises the objective function is selected. Two (or more) individuals could ob-tain the same value for the objective function. In such a situation, the rule that has the minimum amount of overlap with the set of generated rule is selected. If two (or more) rules have the same value for the objective function and the same amount of overlap, the algorithm selects one randomly from them. The penguin can move to another position and generate these neighbours if and only if its oxygen reserve Oi is not de-pleted. This oxygen reserve is updated accord-ing to the objective function, and it represents the health of the penguin. After each iteration, the fitness of the solution of the previous
iter-ation is subtracted from the fitness of the new solution to obtain the value of the oxygen re-serve. If the result of the subtraction is positive, the oxygen reserve is increased to allow this penguin to move to other positions in the next iteration, otherwise the oxygen reserve is de-creased. The oxygen reserve controls the energy of the penguins in the whole search process. If the oxygen reserve is depleted (equal to zero) the penguins move to another location, either in an existing group or to a new unexplored area. All generated rules are firstly validated with the overlap measure μ(Pi) before they are evaluated by the objective function. Any solution is vali-dated (passed to the objective function evalua-tion) if it guarantees the maximum amount of overlap, allowed by other accepted rules. The objective function evaluation is performed only for the valid rules because it is usually a very time consuming task for any meta-heuristics based algorithm.
The number of neighbours changes from one penguin to another and it is updated
accord-ing to the penguin's health (penguin's oxygen reserve). In each iteration, if the oxygen re-serve increases, the number of neighbours also increases, in the opposite case the number of neighbours decreases. The number of neigh-bours is initialised to '1', in such situation the penguin can generate only one new position by swapping between the possible values (0,1,2) for one item set. The amount of oxygen allows the penguins to decide to search or not in a given area and the number of neighbours allows penguins to decide on evaluation of only a new position or a set of new positions.
are focused on the first aspect by taking the rules which maximise the average of the sup-port (Supp) and the confidence (Conf). The fit -ness value is computed only for the rules satis-fying the maximum accepted overlap where the maximum Overlap (Max-Overlap) is a prede-fined value that represents the maximum ac-cepted distance between each pair of rules. More formally, the fitness function F for a given solution S can be formulated as:
max( ) Supp S Conf S( ) 2 ( )
F S = +
where
| { | [ ] 0 [ ] , [1... ]} |
| |
| { | [ ] 0 [ ] , [1... ]} |
| { | [ ] 1 [ ] , [1... ]} |
( ) ( )
t T S i S i t i n
T
t T S i S i t i n
t T S i S i t i n
Supp S
Conf S
∈ ≠ ⇒ ⊆ ∀ ∈
∈ ≠ ⇒ ⊆ ∀ ∈
∈ = ⇒ ⊆ ∀ ∈
=
=
Example.
Table1. Illustration of transactional database for fitness computing.
Transaction Item Item Item
t1 A B C
t2 A B
t3 C D
t4 E D
t5 C A
Let us consider the transactional database (see Table 1) that contains 5 transactions T = {t1, t2, t3, t4, t5} and 5 items I = {A,B,C,D,E}. For instance,
to compute the support and the confidence of the solution S = (1,2,0,0,0) equivalent to the rule (A→B), the number of occurrences of the item set (A) and the item set (A,B) should be first de-termined. We notice that (A) is repeated 3 times and (A,B) are repeated together twice. As a result, the support of (A) is 3/5 and the support of (A,B) is 2/5. So, the confidence of (A→B) is 2 5
3 5 that equals to 2/3. Now, using equation (1), the fitness of S is calculated as: Fmax( )S =
( ) ( )
1 22 5× + ×1 22 3 ,which equals to 8
15.
Figure 1. Penguins search optimisation algorithm for ARM.
4.4. Algorithm of Pe-ARM
Pe-ARM algorithm (see Figure 1) starts with generating a random population of penguins (each penguin represents a rule). This popula-tion is divided into groups, each group contains a variable number of penguins which is updated according to the penguins' health. The division of the initial population is based on the amount of overlapping between population rules. At first, a random penguin (Pr) is selected (will be the center of the first group) and all penguins that have a distance (amount of overlapping) from Pr less than the (Min-distance) will be added to this group. The Min-distance is equal to the average of distances between any two rules in the entire population. A new group is created if all other remaining penguins have a distance from Pr greater than Min-distance. The diversification generation strategy is used to generate K diversified groups in the initial penguin population. Pe-ARM starts with a pop-ulation distributed in K groups, and each group is placed in a separate region with a maximum distance from one to another. The purpose is to start the search with a set of diversified ini-tial solutions which have contrasting features benefiting future solution improvement and to control the non visited region in the coming it-erations.
Our main goal is to generate a set of consistent rules that have good fitness with small amount of overlap between them. The objective func-tion of a given solufunc-tion F(Pi) is formulated to maximise the average of statistical measure (confidence and support).
Each penguin generates from its rule another set of rules (neighbours). The best rule among these rules that optimises the objective function is selected. Two (or more) individuals could ob-tain the same value for the objective function. In such a situation, the rule that has the minimum amount of overlap with the set of generated rule is selected. If two (or more) rules have the same value for the objective function and the same amount of overlap, the algorithm selects one randomly from them. The penguin can move to another position and generate these neighbours if and only if its oxygen reserve Oi is not de-pleted. This oxygen reserve is updated accord-ing to the objective function, and it represents the health of the penguin. After each iteration, the fitness of the solution of the previous
iter-ation is subtracted from the fitness of the new solution to obtain the value of the oxygen re-serve. If the result of the subtraction is positive, the oxygen reserve is increased to allow this penguin to move to other positions in the next iteration, otherwise the oxygen reserve is de-creased. The oxygen reserve controls the energy of the penguins in the whole search process. If the oxygen reserve is depleted (equal to zero) the penguins move to another location, either in an existing group or to a new unexplored area. All generated rules are firstly validated with the overlap measure μ(Pi) before they are evaluated by the objective function. Any solution is vali-dated (passed to the objective function evalua-tion) if it guarantees the maximum amount of overlap, allowed by other accepted rules. The objective function evaluation is performed only for the valid rules because it is usually a very time consuming task for any meta-heuristics based algorithm.
The number of neighbours changes from one penguin to another and it is updated
accord-ing to the penguin's health (penguin's oxygen reserve). In each iteration, if the oxygen re-serve increases, the number of neighbours also increases, in the opposite case the number of neighbours decreases. The number of neigh-bours is initialised to '1', in such situation the penguin can generate only one new position by swapping between the possible values (0,1,2) for one item set. The amount of oxygen allows the penguins to decide to search or not in a given area and the number of neighbours allows penguins to decide on evaluation of only a new position or a set of new positions.
5. Experimentation and Results
In order to evaluate effectiveness of the pro-posed algorithm, several evaluation criteria have been used in the experimentation process. Firstly, the statistical measure is computed which is represented as the average of the con-fidence and the support of the generated rules. Secondly, the execution time of each approach is determined.
The last measure is the coverage formula which represents the similarities between the gener-ated rules according to the number of common transactions. Indeed, the rules are similar when they verify together many transactions and dis-similar when they do not verify any transaction [37]. The coverage formula is given as follows: Let Tri be the set of transactions verified by ri, and n is the number of generated rules.
1 1 ( , )
( 1) 0
( , ) otherwise
i j i j
n n
i j i j
i j
r r r r
r r Coverage
n n
i j
r r T T T T
η
η
= =
=
−
=
= ∪ − ∩
∑ ∑
5.1. Parameter Settings
The penguins search algorithm needs many pa-rameters to ensure the diversification and the
Table 2. Performance of the Pe-ARM with different numbers of penguins.
Data sets Bolts Sleep Pollution Basket-Ball IBM-Quest Quack Chess Mushroom
N Penguins F t F t F t F t F t F t F t F t
10 0.81 0.03 0.88 0.24 0.79 0.21 0.91 0.14 0.81 0.19 0.81 0.54 0.80 0.61 0.78 1.21 15 0.85 0.05 0.93 0.31 0.91 0.28 0.95 0.20 0.86 0.21 0.89 0.61 0.83 0.70 0.79 1.41 20 0.98 0.08 0.97 0.39 0.97 0.35 0.98 0.29 0.90 0.25 0.90 0.69 0.87 0.76 0.81 1.58 25 0.99 0.10 0.99 0.46 1 0.37 0.99 0.31 0.92 0.28 0.90 0.76 0.88 0.80 0.84 1.67 30 1 0.13 0.99 0.52 1 0.44 0.99 0.37 0.92 0.35 0.90 0.82 0.88 0.87 0.84 1.72 35 1 0.18 0.99 0.57 1 0.49 0.99 0.44 0.92 0.39 0.89 0.87 0.88 0.93 0.84 1.79 40 1 0.21 0.97 0.62 1 0.56 0.98 0.46 0.91 0.42 0.90 0.93 0.87 0.99 0.84 1.83 50 0.99 0.25 0.99 0.75 1 0.62 0.98 0.53 0.92 0.56 0.90 1.10 0.88 1.15 0.82 1.99 60 1 0.30 0.98 0.82 1 0.81 0.99 0.61 0.92 0.63 0.90 1.25 0.88 1.32 0.84 2.18 75 1 0.41 0.99 0.91 1 0.95 0.99 0.82 0.92 0.75 0.90 1.39 0.88 1.49 0.84 2.32 100 1 0.62 0.99 1.14 1 1.24 0.99 1.02 0.92 0.92 0.90 1.52 0.88 1.81 0.84 2.61
intensification properties of the search process. The parameter values have a decisive influ-ence on the quality of a solution and the time required to achieve the solution. The aim of this experiment is to find good parameter values to maximise the ratio between the fitness function (F) of generated rules and the CPU run time (T). Finding the optimal values for each parameter of an optimisation algorithm is a difficult task. These parameter values strongly depend on the used data and a large number of possible values for each parameter is possible.
In the parameter settings, the value of each pa-rameter is changed iteratively in order to find the best stabilised average values (Fitness func-tion / CPU run time). For each parameter, the values are changed from small values to high values. The available data set can be divided into three categories: small, average and big data set. Each new parameter value is tested with the IBM-Quest data set which is one of the average data sets. As shown in Table 2, we see that when small number of penguins is used, the CPU run time is low. Consequently, small part of rule space is explored, which reduces the quality of the generated rules. Otherwise, when the number of penguins increases, we get a set of good rules but with increased CPU run time (we have used 100 generations for all tests). For the number of iterations (Table 3), we aim to stabilise the average of the fitness of the
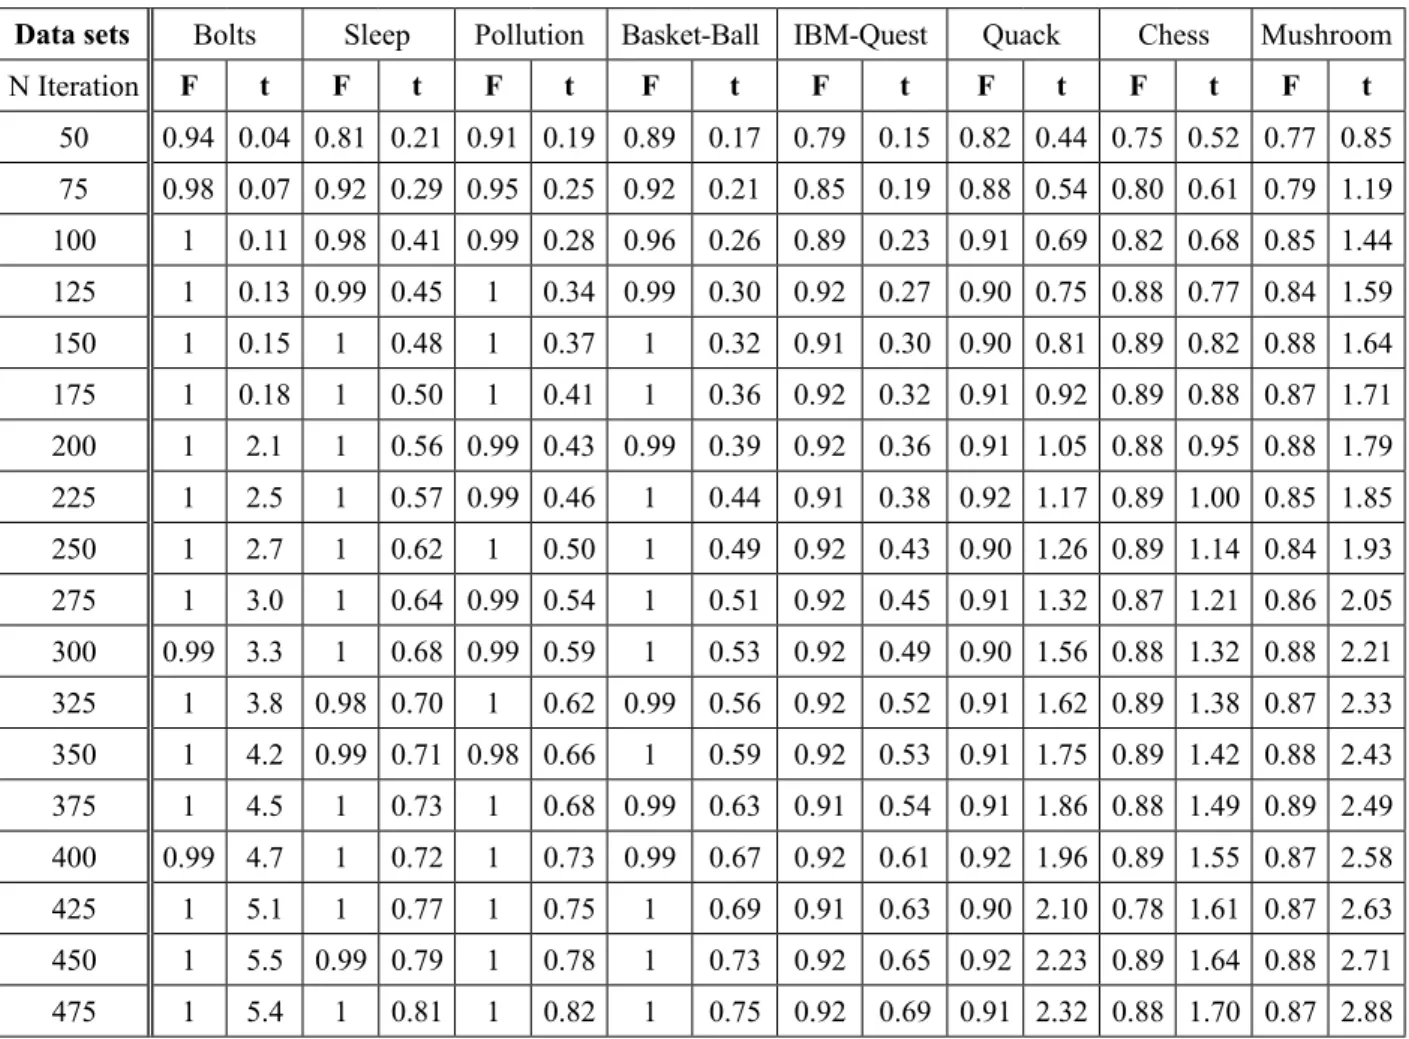
Table 3. Performance of the Pe-ARM with different numbers of iterations
Data sets Bolts Sleep Pollution Basket-Ball IBM-Quest Quack Chess Mushroom
N Iteration F t F t F t F t F t F t F t F t
50 0.94 0.04 0.81 0.21 0.91 0.19 0.89 0.17 0.79 0.15 0.82 0.44 0.75 0.52 0.77 0.85 75 0.98 0.07 0.92 0.29 0.95 0.25 0.92 0.21 0.85 0.19 0.88 0.54 0.80 0.61 0.79 1.19 100 1 0.11 0.98 0.41 0.99 0.28 0.96 0.26 0.89 0.23 0.91 0.69 0.82 0.68 0.85 1.44 125 1 0.13 0.99 0.45 1 0.34 0.99 0.30 0.92 0.27 0.90 0.75 0.88 0.77 0.84 1.59
150 1 0.15 1 0.48 1 0.37 1 0.32 0.91 0.30 0.90 0.81 0.89 0.82 0.88 1.64
175 1 0.18 1 0.50 1 0.41 1 0.36 0.92 0.32 0.91 0.92 0.89 0.88 0.87 1.71
200 1 2.1 1 0.56 0.99 0.43 0.99 0.39 0.92 0.36 0.91 1.05 0.88 0.95 0.88 1.79
225 1 2.5 1 0.57 0.99 0.46 1 0.44 0.91 0.38 0.92 1.17 0.89 1.00 0.85 1.85
250 1 2.7 1 0.62 1 0.50 1 0.49 0.92 0.43 0.90 1.26 0.89 1.14 0.84 1.93
275 1 3.0 1 0.64 0.99 0.54 1 0.51 0.92 0.45 0.91 1.32 0.87 1.21 0.86 2.05
300 0.99 3.3 1 0.68 0.99 0.59 1 0.53 0.92 0.49 0.90 1.56 0.88 1.32 0.88 2.21 325 1 3.8 0.98 0.70 1 0.62 0.99 0.56 0.92 0.52 0.91 1.62 0.89 1.38 0.87 2.33 350 1 4.2 0.99 0.71 0.98 0.66 1 0.59 0.92 0.53 0.91 1.75 0.89 1.42 0.88 2.43
375 1 4.5 1 0.73 1 0.68 0.99 0.63 0.91 0.54 0.91 1.86 0.88 1.49 0.89 2.49
400 0.99 4.7 1 0.72 1 0.73 0.99 0.67 0.92 0.61 0.92 1.96 0.89 1.55 0.87 2.58
425 1 5.1 1 0.77 1 0.75 1 0.69 0.91 0.63 0.90 2.10 0.78 1.61 0.87 2.63
450 1 5.5 0.99 0.79 1 0.78 1 0.73 0.92 0.65 0.92 2.23 0.89 1.64 0.88 2.71
475 1 5.4 1 0.81 1 0.82 1 0.75 0.92 0.69 0.91 2.32 0.88 1.70 0.87 2.88
solutions with the execution time as well. It is evident from the table that the smaller the num-ber of iterations, the smaller the average confi-dence and support and the smaller the execution time. This is due to the fact that with a fewer number of iterations a fewer number of rules are generated. However, if the number of itera -tions is increased the average of confidence and support is also increased, but with a higher exe-cution time. Based on the obtained results, the number of iterations is set to 100 and the num-ber of penguins is set to 25. For instance, the number of penguins is a prominent parameter since the number of penguins has a high cor-relation with the number of groups (one pen-guin will form only one group, so the higher the number of penguins, the higher the probability of forming a new group).
5.2. Evaluation with Standard Data Sets The following data sets were prepared by [38] from the UCI data sets and PUMSB, though
they have been converted to apriori binary for-mat. It has been widely used in the evaluation and comparison process for association rule mining problem. These data sets can be classi-fied into three categories ‒ small, medium and large [39]. Table 4 describes the size of the used data sets, the number of transactions and the number of items in each of the transactions.
Table 4. Standard data sets description.
Data set Transactions size Items size
Bolts 40 8
Sleep 56 8
Pollution 60 16
Basket-Ball 96 5
IBM-Quest 1000 40
Quack 2178 4
Chess 3196 75
5. Experimentation and Results
In order to evaluate effectiveness of the pro-posed algorithm, several evaluation criteria have been used in the experimentation process. Firstly, the statistical measure is computed which is represented as the average of the con-fidence and the support of the generated rules. Secondly, the execution time of each approach is determined.
The last measure is the coverage formula which represents the similarities between the gener-ated rules according to the number of common transactions. Indeed, the rules are similar when they verify together many transactions and dis-similar when they do not verify any transaction [37]. The coverage formula is given as follows: Let Tri be the set of transactions verified by ri, and n is the number of generated rules.
1 1 ( , )
( 1) 0
( , ) otherwise
i j i j
n n
i j i j
i j
r r r r
r r Coverage
n n
i j
r r T T T T
η
η
= =
=
−
=
= ∪ − ∩
∑ ∑
5.1. Parameter Settings
The penguins search algorithm needs many pa-rameters to ensure the diversification and the
Table 2. Performance of the Pe-ARM with different numbers of penguins.
Data sets Bolts Sleep Pollution Basket-Ball IBM-Quest Quack Chess Mushroom
N Penguins F t F t F t F t F t F t F t F t
10 0.81 0.03 0.88 0.24 0.79 0.21 0.91 0.14 0.81 0.19 0.81 0.54 0.80 0.61 0.78 1.21 15 0.85 0.05 0.93 0.31 0.91 0.28 0.95 0.20 0.86 0.21 0.89 0.61 0.83 0.70 0.79 1.41 20 0.98 0.08 0.97 0.39 0.97 0.35 0.98 0.29 0.90 0.25 0.90 0.69 0.87 0.76 0.81 1.58 25 0.99 0.10 0.99 0.46 1 0.37 0.99 0.31 0.92 0.28 0.90 0.76 0.88 0.80 0.84 1.67 30 1 0.13 0.99 0.52 1 0.44 0.99 0.37 0.92 0.35 0.90 0.82 0.88 0.87 0.84 1.72 35 1 0.18 0.99 0.57 1 0.49 0.99 0.44 0.92 0.39 0.89 0.87 0.88 0.93 0.84 1.79 40 1 0.21 0.97 0.62 1 0.56 0.98 0.46 0.91 0.42 0.90 0.93 0.87 0.99 0.84 1.83 50 0.99 0.25 0.99 0.75 1 0.62 0.98 0.53 0.92 0.56 0.90 1.10 0.88 1.15 0.82 1.99 60 1 0.30 0.98 0.82 1 0.81 0.99 0.61 0.92 0.63 0.90 1.25 0.88 1.32 0.84 2.18 75 1 0.41 0.99 0.91 1 0.95 0.99 0.82 0.92 0.75 0.90 1.39 0.88 1.49 0.84 2.32 100 1 0.62 0.99 1.14 1 1.24 0.99 1.02 0.92 0.92 0.90 1.52 0.88 1.81 0.84 2.61
intensification properties of the search process. The parameter values have a decisive influ-ence on the quality of a solution and the time required to achieve the solution. The aim of this experiment is to find good parameter values to maximise the ratio between the fitness function (F) of generated rules and the CPU run time (T). Finding the optimal values for each parameter of an optimisation algorithm is a difficult task. These parameter values strongly depend on the used data and a large number of possible values for each parameter is possible.
In the parameter settings, the value of each pa-rameter is changed iteratively in order to find the best stabilised average values (Fitness func-tion / CPU run time). For each parameter, the values are changed from small values to high values. The available data set can be divided into three categories: small, average and big data set. Each new parameter value is tested with the IBM-Quest data set which is one of the average data sets. As shown in Table 2, we see that when small number of penguins is used, the CPU run time is low. Consequently, small part of rule space is explored, which reduces the quality of the generated rules. Otherwise, when the number of penguins increases, we get a set of good rules but with increased CPU run time (we have used 100 generations for all tests). For the number of iterations (Table 3), we aim to stabilise the average of the fitness of the
Table 3. Performance of the Pe-ARM with different numbers of iterations
Data sets Bolts Sleep Pollution Basket-Ball IBM-Quest Quack Chess Mushroom
N Iteration F t F t F t F t F t F t F t F t
50 0.94 0.04 0.81 0.21 0.91 0.19 0.89 0.17 0.79 0.15 0.82 0.44 0.75 0.52 0.77 0.85 75 0.98 0.07 0.92 0.29 0.95 0.25 0.92 0.21 0.85 0.19 0.88 0.54 0.80 0.61 0.79 1.19 100 1 0.11 0.98 0.41 0.99 0.28 0.96 0.26 0.89 0.23 0.91 0.69 0.82 0.68 0.85 1.44 125 1 0.13 0.99 0.45 1 0.34 0.99 0.30 0.92 0.27 0.90 0.75 0.88 0.77 0.84 1.59
150 1 0.15 1 0.48 1 0.37 1 0.32 0.91 0.30 0.90 0.81 0.89 0.82 0.88 1.64
175 1 0.18 1 0.50 1 0.41 1 0.36 0.92 0.32 0.91 0.92 0.89 0.88 0.87 1.71
200 1 2.1 1 0.56 0.99 0.43 0.99 0.39 0.92 0.36 0.91 1.05 0.88 0.95 0.88 1.79
225 1 2.5 1 0.57 0.99 0.46 1 0.44 0.91 0.38 0.92 1.17 0.89 1.00 0.85 1.85
250 1 2.7 1 0.62 1 0.50 1 0.49 0.92 0.43 0.90 1.26 0.89 1.14 0.84 1.93
275 1 3.0 1 0.64 0.99 0.54 1 0.51 0.92 0.45 0.91 1.32 0.87 1.21 0.86 2.05
300 0.99 3.3 1 0.68 0.99 0.59 1 0.53 0.92 0.49 0.90 1.56 0.88 1.32 0.88 2.21 325 1 3.8 0.98 0.70 1 0.62 0.99 0.56 0.92 0.52 0.91 1.62 0.89 1.38 0.87 2.33 350 1 4.2 0.99 0.71 0.98 0.66 1 0.59 0.92 0.53 0.91 1.75 0.89 1.42 0.88 2.43
375 1 4.5 1 0.73 1 0.68 0.99 0.63 0.91 0.54 0.91 1.86 0.88 1.49 0.89 2.49
400 0.99 4.7 1 0.72 1 0.73 0.99 0.67 0.92 0.61 0.92 1.96 0.89 1.55 0.87 2.58
425 1 5.1 1 0.77 1 0.75 1 0.69 0.91 0.63 0.90 2.10 0.78 1.61 0.87 2.63
450 1 5.5 0.99 0.79 1 0.78 1 0.73 0.92 0.65 0.92 2.23 0.89 1.64 0.88 2.71
475 1 5.4 1 0.81 1 0.82 1 0.75 0.92 0.69 0.91 2.32 0.88 1.70 0.87 2.88
solutions with the execution time as well. It is evident from the table that the smaller the num-ber of iterations, the smaller the average confi-dence and support and the smaller the execution time. This is due to the fact that with a fewer number of iterations a fewer number of rules are generated. However, if the number of itera -tions is increased the average of confidence and support is also increased, but with a higher exe-cution time. Based on the obtained results, the number of iterations is set to 100 and the num-ber of penguins is set to 25. For instance, the number of penguins is a prominent parameter since the number of penguins has a high cor-relation with the number of groups (one pen-guin will form only one group, so the higher the number of penguins, the higher the probability of forming a new group).
5.2. Evaluation with Standard Data Sets The following data sets were prepared by [38] from the UCI data sets and PUMSB, though
they have been converted to apriori binary for-mat. It has been widely used in the evaluation and comparison process for association rule mining problem. These data sets can be classi-fied into three categories ‒ small, medium and large [39]. Table 4 describes the size of the used data sets, the number of transactions and the number of items in each of the transactions.
Table 4. Standard data sets description.
Data set Transactions size Items size
Bolts 40 8
Sleep 56 8
Pollution 60 16
Basket-Ball 96 5
IBM-Quest 1000 40
Quack 2178 4
Chess 3196 75
We have compared the performance of the Pe-ARM with a set of well known association rule mining algorithms (BSO-ARM [27], ACOR
[13], SA [40], G3PARM [11], ARMBGSA [25]). The parameters used by these algorithms are the optimal values proposed by the authors. Tables 5, 6 and 7 summarise all the results ob-tained by applying Pe-ARM and the above mentioned approaches on various standard data sets. The aim is to maximise the average of the statistical measures (confidence and support)
Table 5. Comparison of Pe-ARM with different approaches for confidence and support average.
Data sets Pe-ARM BSO-ARM ACOR SA G3PARM ARMBGSA
Bolts 1.00 1.00 0.69 0.60 0.92 0.45
Sleep 1.00 1.00 0.67 0.53 0.90 0.39
Pollution 1.00 1.00 0.66 0.50 0.92 0.56
Basket-Ball 1.00 1.00 0.61 0.66 0.93 0.45
IBM-Quest 0.92 0.89 0.45 0.30 0.88 0.40
Quack 0.91 0.89 0.73 0.52 0.90 0.39
Chess 0.89 0.86 0.3 0.15 0.86 0.38
Mushroom 0.88 0.84 0.1 0.05 0.85 0.35
Table 6. Run time (in seconds) comparison among the Pe-ARM and other approaches.
Data sets Pe-ARM BSO-ARM ACOR SA G3PARM ARMBGSA
Bolts 0.12 0.22 1.23 1.04 0.59 1.17
Sleep 0.48 0.95 2.1 2.4 0.87 1.38
Pollution 0.35 0.62 1.1 1.6 0.67 1.87
Basket-Ball 0.28 0.56 1.3 1.5 0.42 2.10
IBM-Quest 0.251 0.32 0.9 1.9 0.87 1.45
Quack 0.67 0.75 1.5 2.4 1.00 1.94
Chess 0.725 0.85 2.4 3.02 0.99 2.41
Mushroom 1.474 1.5 3.6 2.8 1.84 3.98
Table 7. Run time (in seconds) comparison among the Pe-ARM and other approaches.
Data sets Pe-ARM BSO-ARM ACOR SA G3PARM ARMBGSA
Bolts 11 11 5 4.12 8.24 6.25
Sleep 11.23 11.23 5 5.65 6.01 5.9
Pollution 11.25 11.25 6.24 5.32 5.98 6.02
Basket-Ball 12.65 12.65 4.10 7.01 6.8 5
IBM-Quest 15.2 6.14 6.98 4.28 6.87 7.82
Quack 21.51 10.25 9.24 8.24 11.08 10.01
Chess 29.41 9.27 8.21 10.36 8.52 9.88
Mushroom 35.25 12.34 10.01 9.85 12.38 12.01
and to minimise the overlap between rules in order to maximise the coverage. The proposed Pe-ARM algorithm with the new overlap mea-sure gives the best coverage values compared to other algorithms. This is due to the fact that the set of association rules generated by the Pe-ARM (with the overlap measure) has low over-lap between them. The mechanism of the pen-guins algorithm ensures a good intensification on the way to ameliorate the execution time. In the experimentation of standard data sets cases,
we have used 0.50 as the maximum overlap ac-cepted, meaning that half of the two rules can be similar. The minimum support and minimum confidence threshold values are not required, the algorithm provides the best solutions ob-tained (the maximum support/confidence val-ues depend on the data sets under study). The use of the overlap distance gives meaning to the right and the left side of the rule. If the average support is 0.6 and the average confi-dence is 0.7, then the average of both is 0.65. At the same time, another algorithm could ob-tain the same average, i.e., 0.65, but with dif-ferent support and confidence values (e.g. 0.59 for support and 0.71 for confidence). The re -sults could show that both algorithms behave similarly (0.65 as the value for the average of support and confidence), but the difference be-tween these two rules is in the amount of over-lap.
5.3. Evaluation with Biological Data Sets One of the useful applications of association rules mining is in bio-informatics [41]. In this section, we have used several biological data sets for gene expression under a (sub)set of conditions [42]. In the context of market basket analysis, gene expression data can be used as a single transaction, and each condition as an item. Also, each condition can be validated or not in a given transaction (gene expression). Since the gene expression data belong to con-tinuous real values, a discretisation preprocess-ing for the gene expression data is needed [43]. Data set values are discretised into two values:
Table 8. Biological data sets description.
Data set Transactions size Items size
Leukemia 12457 72
Arabidopsis
Thaliana 73 69
Saccharomyces
Cerevisiae 190 170
Yeast 94 174
Alpha Factor 911 17
Cdc15 607 607
Elutriation 5632 15
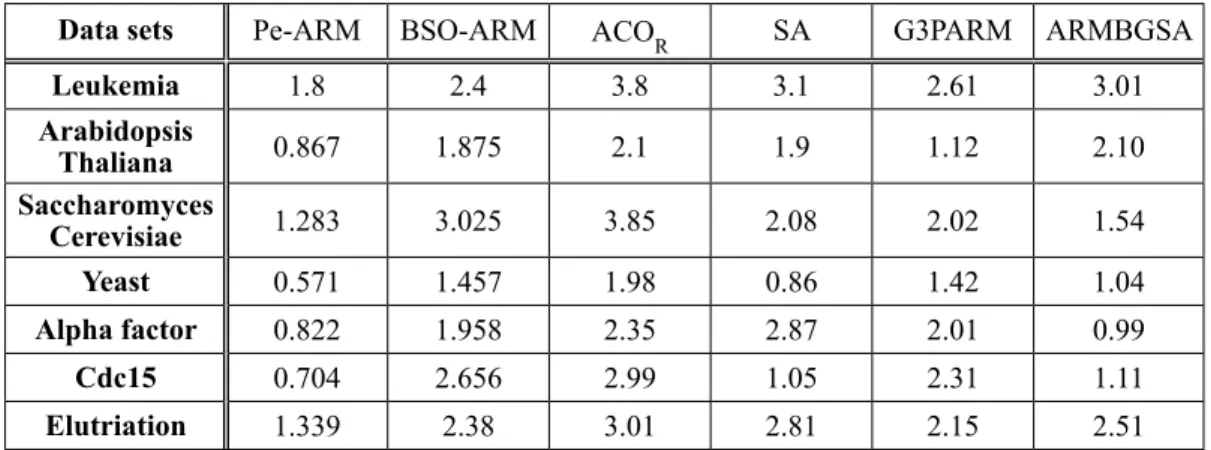
Table 9. Comparison of Pe-ARM with different approaches for confidence and support average (Biological data sets).
Data sets Pe-ARM BSO-ARM ACOR SA G3PARM ARMBGSA
Leukemia 0.78 0.68 0.45 0.41 0.65 0.51
Arabidopsis
Thaliana 0.64 0.51 0.41 0.48 0.54 0.39
Saccharomyces
Cerevisiae 0.59 0.38 0.34 0.31 0.37 0.35
Yeast 0.55 0.38 0.37 0.37 0.40 0.41
Alpha factor 0.64 0.46 0.43 0.39 0.44 0.50
Cdc15 0.62 0.43 0.43 0.48 0.43 0.39
Elutriation 0.69 0.43 0.50 0.40 0.41 0.38