Effects of Math Intervention on Learning Principles of Economics
Julie S. Glass, PhDProfessor of Mathematics California State University, East Bay
Hayward, CA 94542 Jane S. Lopus, PhD Professor of Economics California State University, East Bay
Hayward, CA 94542
Programmatic Excellence and Innovation in Learning White Paper
July, 2015
1 Table of Contents A. Project Team B. Project Description C. Project Rationale D. Literature Review
E. Research Design and Methodology F. Data
G. Summary and Conclusions and Next Steps H. References
I. Math-Econ Video Master List J. Power Point Presentation
A. Project Team
Our project team consisted of co-principal investigators, faculty consultants, course instructors, student research assistants, and a statistical and survey design consultant. Julie Glass, Professor of Mathematics and Jane Lopus, Professor of Economics and Director of the Center for Economic Education were the co-PI’s. Ryan Lampe, Associate Professor of
Economics and Brian Adams, Assistant Professor of Economics served as faculty consultants. Because they both have experience teaching large online sections of principles of economics, their role was to provide insights into using the project in an online environment and also to help to guide the student team.
Our research design called for instructors of economics to teach principles of
microeconomics or principles of macroeconomics during fall quarter 2014 and spring quarter 2015. Farhad Sabetan (micro) and Gregory Christainsen (macro) agreed to have fall sections of their courses serve as control groups and spring sections to serve as experimental groups. Student research assistants were an invaluable part of our project team. Undergraduate economics majors Alex Bly and Asia Williams, and graduate economics students John Choi and Keosotra Veng provided insights and advice about the content and delivery of the videos and accompanying questions and about student use of online resources. Sara L. Larson lent expertise in survey design, data collection, and data analysis.
3
B. Project Description
This project was designed to address the needs of CSUEB students taking courses that require a high level of quantitative and analytical skills. The pilot project developed learning objects (videos and online assignments) aimed specifically at supporting facility with algebraic principles and practices required for success in Economics 2301 (Principles of Microeconomics) and Economics 2302 (Principles of Macroeconomics), both on-ground and online. A broad range of students take these classes including those intending to major in business or economics, those wishing to satisfy the social science GE requirements, and others.
Approximately 780 students enroll in these classes each year at CSUEB (12 sections with 65 students in each; not including summer quarter).
While the prerequisites for both pilot classes include intermediate algebra or a
satisfactory score on the Entry-Level Math (ELM) test, many students are woefully unprepared for the mathematical rigor required in the introductory economics classes. Economics is generally recognized as being the most quantitative of the social sciences, and students are expected to be able to graph and solve simple algebraic functions, to solve simple equations and to understand and interpret graphs. It is clear to instructors of economics that many students either experience math anxiety or lack math and other academic skills to perform well in these classes. While some students openly express frustration with their lack of quantitative knowledge, others are embarrassed to draw attention to their lack of skills. The materials developed as part of this project address this deficiency and acute student need.
Our approach was to develop a series of videos reviewing the math commonly used in principles of economics classes. Students were able to view the videos in a “just-in-time” manner outside of class, allowing instructors to devote more time to teaching economics. This “flip” allowed economics instructors to focus on economics while still providing students with resources to support their mathematical skills.
As a first step we surveyed members of the economics faculty at CSUEB and asked for feedback about what mathematics they would like their students to know before taking their principles of economics classes. We also systematically reviewed one professor’s PowerPoint presentations and had our Student Research Assistants review text books for macro and micro principles to identify underlying math concepts required for understanding economics. From these activities we identified a list of 16 math concepts, which we then linked with 16
economics applications.
From discussions with students and other faculty, we decided to produce 16 short (five minutes or less) videos to explain the math behind the economics and show how the math is applied using specific economics applications. Each video has the following format: the title slide asks an economics question, such as “How do we compute average total cost?” and then identifies the math behind the economics, in this case finding averages. The economics application is presented in the form of a question, followed by an explanation of the math necessary to answer the question. The original economics question is then answered and other economics applications of the math concepts are identified. Appendix 1 contains a list of the 16 video topics with the math addressed and links to their YouTube locations.
Each video is accompanied by a set of ten questions, which allow students to check for understanding, review the mathematics from the video and apply the math to other economics
applications. We call these self-check questions because we envision that after the experimental phase of this project, the videos and questions will be openly available to students so they can access them and review them as needed. The videos and self-check questions may all be accessed at https://sites.google.com/a/csueastbay.edu/mathematics-for-economics/ .
Data was collected within student Blackboard course shells on student participation, scores on self-check questions, and course grade distributions. In addition, overall achievement was measured by pre and post-tests of basic mathematics and economics content. Attitudes about math, economics, and study habits were assessed via pre- and post-surveys through Survey Monkey outside of the ordinary course environment.
C. Project Rationale
The use of mathematics is important in economics for many reasons. It allows us to analyze markets and economic data, make predictions about real-world events, test economic theories, and help resolve debates about economic issues. Mathematical precision in
economics can lead to stronger policy recommendations and outcomes. The use of formulas, graphs, and equations is helpful in interpreting economic events at both the microeconomic and macroeconomic levels and makes it easier to explain complex interactions.
The higher one advances in the study of economics, the greater the mathematical complexity. Graduate students are advised to complete linear algebra and differential
equations, while calculus is required for many upper division undergraduate courses. Although the math requirement for principles of economics, if any, is often only the equivalent of high school algebra and geometry, principles courses still tend to require a high level of quantitative skills because of the frequent use of graphs and equations. Students with low math skills, weak math backgrounds or who suffer from “math anxiety” find the quantitative nature of the course to be intimidating and an impediment to learning economics.
D. Literature Review
Because of the importance of mathematics in economics there is a substantial literature on the effects of mathematics skill levels on learning economics. A recent paper by Benedict and Hoag (2012) summarizes the literature with respect to different dependent variables used to measure economic achievement: differences between pre and post scores on the Test of College Economics (TUCE), total points accumulated in the class, and course letter grade. The literature cited shows mixed results for the first two measures, while two studies are cited that show positive results of college mathematics courses on course grades.
Related to this, much of the literature on the relationship between mathematics and learning economics focuses on the effects of math background, such as the number of math courses taken. The findings from this type of study are also mixed. For example, a 1998 study at the University of South Carolina found no effect of math background on learning principles of economics after controlling for SAT, GPA, and other variables (Cohn et al). However a 2004 study (Ballard and Johnson) finds that taking a calculus course was statistically significant in explaining student performance in economics principles classes. Other measures of
5
quantitative skills were also found to be significant in this study: ACT math score, whether the student was required to take remedial math, and the score on a basic math test. A related study looked at the effects of remedial math courses on learning principles of economics (Lagerlöf and Seltzer, 2009). This study found that a required remedial math course had little effect on learning principles of economics, while the level of secondary school mathematics courses did have strong predictive power on student performance.
As Ballard and Johnson’s work implies, the number and type of math courses taken may not always be an accurate proxy for math knowledge and skills. Schuhmann et al (2005)
conduct a study looking at the level of math proficiency on learning principles of economics, where math proficiency is measured by a pre and post class math quiz. Their results indicate that students do not do well on pre-course math quizzes and thus may not understand the math language used in the course. Schuhmann’s results also show that quantitative literacy is a significant determinant of economic literacy and having basic math skills such as being able to interpret graphs and solve equations leads to higher economic knowledge.
Because graphs are integral to the study of economics, there have been studies on the effects of graphing skills specifically on learning economics. Strober and Cook (1992) find that students who do not understand graphs generally have trouble learning economics and that principles students lack many graphing skills. Cohn and Cohn (1994) also found that having graphing skills positively affects performance in principles of economics classes.
Our current study adds to the literature on the effects of mathematics on learning principles of economics in several ways. We develop videos and self-check questions that directly address math topics necessary for learning principles of economics. The videos all contain economics applications of the math presented, along with self-check questions so students can check for understanding. We evaluate the effects of viewing the videos and completing self-check assignments on learning principles of economics.
E. Research Design and Methodology
To assess the effects of the math/econ project on learning and attitudes in principles of economics classes, we set up a controlled experiment during the 2014 – 2015 academic year at CSUEB. One micro principles class and one macro principles class served as control classes during fall quarter 2014. Students took pre and posttests and responded to the accompanying questionnaire with background and attitude questions, but did not have access to the
math/econ project materials. During spring quarter 2015 one micro and one macro principles class served as experimental classes. They took pre and posttests and responded to the
accompanying questionnaire and also had access to the videos and questions. The control and experimental classes were taught by the same instructors and were offered at the same time of day each quarter. Instructors agreed to have math/econ project scores count toward students’ grades (in the form of extra credit) to provide motivation for participating in the experiment. The videos and self-check questions were available to students through links in Blackboard and scores on the self-check questions were entered in the instructors’ Blackboard gradebooks. Institutional Review Board approval was granted for the project.
Control and experimental group students were entered in a drawing for $100 Amazon gift cards as an incentive for completing the online pretest and posttest and accompanying
questionnaire. Background and attitudinal questions asked for date of birth, sex, year in college, race or ethnicity, preferred language, college major, expected grade, GPA, parent education, prior economics courses, prior mathematics courses, attitudes toward studying economics and mathematics, use of online resources for leaning, time spent studying, and work and family time commitments.
The background and attitudinal questions were followed by a 20-question micro or macro pretest or posttest. The micro pre and posttest consisted of 10 micro questions (five of which were taken from the Test of Understanding College Economics, the TUCE) followed by 10 math questions relevant to economics applications. The macro pre and posttest consisted of 10 macro questions (five from the TUCE) and the same 10 math questions that were on the micro tests.
F. Data
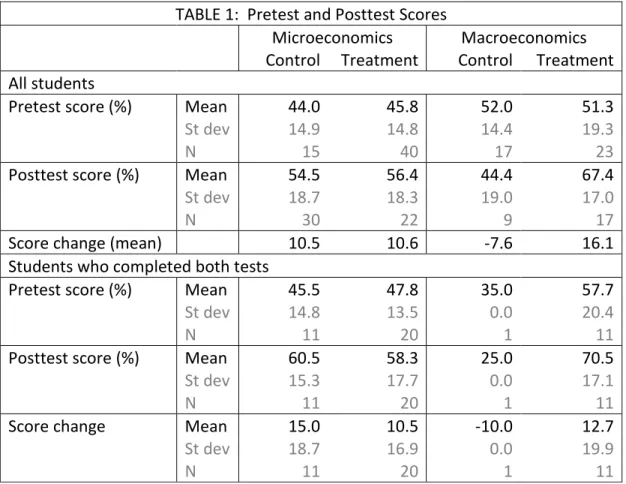
Table 1 shows pretest and posttest scores for control and treatment students, by course along with means, standard deviations, and number of observations. The lower portion of the table displays pretest and posttest scores for the 43 students who completed both the pretest and the posttest.
TABLE 1: Pretest and Posttest Scores
Microeconomics Macroeconomics
Control Treatment Control Treatment
All students
Pretest score (%) Mean 44.0 45.8 52.0 51.3
St dev 14.9 14.8 14.4 19.3
N 15 40 17 23
Posttest score (%) Mean 54.5 56.4 44.4 67.4
St dev 18.7 18.3 19.0 17.0
N 30 22 9 17
Score change (mean) 10.5 10.6 -7.6 16.1
Students who completed both tests
Pretest score (%) Mean 45.5 47.8 35.0 57.7
St dev 14.8 13.5 0.0 20.4
N 11 20 1 11
Posttest score (%) Mean 60.5 58.3 25.0 70.5
St dev 15.3 17.7 0.0 17.1
N 11 20 1 11
Score change Mean 15.0 10.5 -10.0 12.7
St dev 18.7 16.9 0.0 19.9
7
The first observation that we make from Table 1 is that student participation in the project in both experimental and control groups, and in both micro and macro, was
disappointingly low. Macro and micro principles classes average around 60 students per class. Ideally we would compare matched scores of students who took both pre and posttests and look for statistical significance in differences. However, we note that the matched samples of students range from 1 (macro control group) to 20 (micro treatment), with 11 students in the micro control group and macro treatment group. These low participation numbers limit our abilities to draw conclusions and make inferences. We are unable to test many hypotheses implicit in the data collected from student questionnaires through ordinary least squares regression due to the limitations in degrees of freedom.
There are several possible reasons for the low participation rates. One is low incentives for student participation. Research shows that if posttests do not count toward student grades, students tend not to take the tests seriously (see for example Lopus 1997). In our study
instructors agreed that participation would count toward extra credit in the course grade, but was not part of the grade itself so perhaps that extra credit was not a strong incentive to participate. Another problem was possible confusion over how to participate because the pre and posttests were accessible by a web link where the actual video and self-check questions were available in the Blackboard course shell.
Given the low student participation rates, we can draw qualified and tentative
conclusions from the data collected. Table 1 shows that for the entire sample, microeconomics posttest scores improved over pretest by the same amount for the experimental groups that had access to the math-econ project and for the control groups that did not have access to the math-econ project. For macro students, scores for students in the experimental or treatment group increased more than those in the control group, where pre to post scores actually decreased. The same results are found for the matched sample of students.
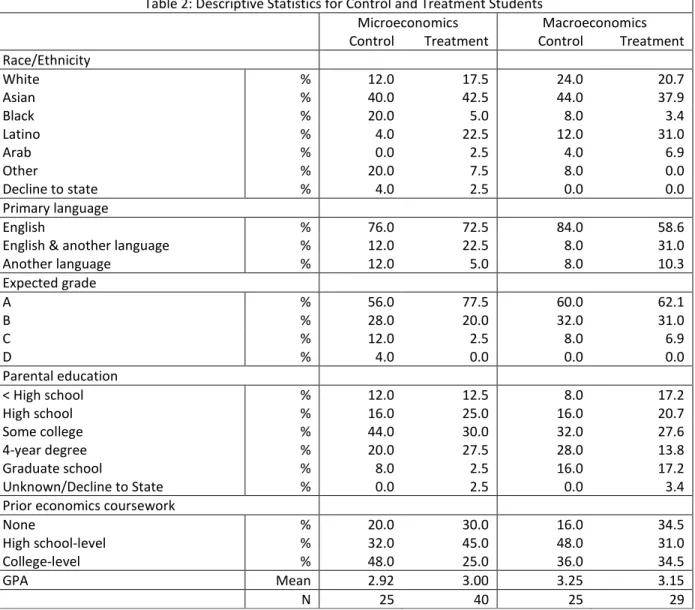
Table 2 reports descriptive statistics for students who participated in the project in both the control and treatment groups. We observe ethnic diversity, as we would expect within a sample of CSUEB students. Most students identify English as their primary language and expect to do well in their economics principles classes. Most parents have had some college or have four-year degrees. Most students have had some prior economics coursework at either the high school or college level and report overall grade point averages in the 3.0 range. Table 2 excludes 11 students (9 Microeconomics Control group, 2 Microeconomics Treatment group) who were not asked to provide demographic data because they falsely indicated that they had already done so during the pretest.
Table 2: Descriptive Statistics for Control and Treatment Students
Microeconomics Macroeconomics Control Treatment Control Treatment Race/Ethnicity White % 12.0 17.5 24.0 20.7 Asian % 40.0 42.5 44.0 37.9 Black % 20.0 5.0 8.0 3.4 Latino % 4.0 22.5 12.0 31.0 Arab % 0.0 2.5 4.0 6.9 Other % 20.0 7.5 8.0 0.0 Decline to state % 4.0 2.5 0.0 0.0 Primary language English % 76.0 72.5 84.0 58.6 English & another language % 12.0 22.5 8.0 31.0 Another language % 12.0 5.0 8.0 10.3 Expected grade A % 56.0 77.5 60.0 62.1 B % 28.0 20.0 32.0 31.0 C % 12.0 2.5 8.0 6.9 D % 4.0 0.0 0.0 0.0 Parental education < High school % 12.0 12.5 8.0 17.2 High school % 16.0 25.0 16.0 20.7 Some college % 44.0 30.0 32.0 27.6 4-year degree % 20.0 27.5 28.0 13.8 Graduate school % 8.0 2.5 16.0 17.2 Unknown/Decline to State % 0.0 2.5 0.0 3.4 Prior economics coursework
None % 20.0 30.0 16.0 34.5 High school-level % 32.0 45.0 48.0 31.0 College-level % 48.0 25.0 36.0 34.5 GPA Mean 2.92 3.00 3.25 3.15 N 25 40 25 29
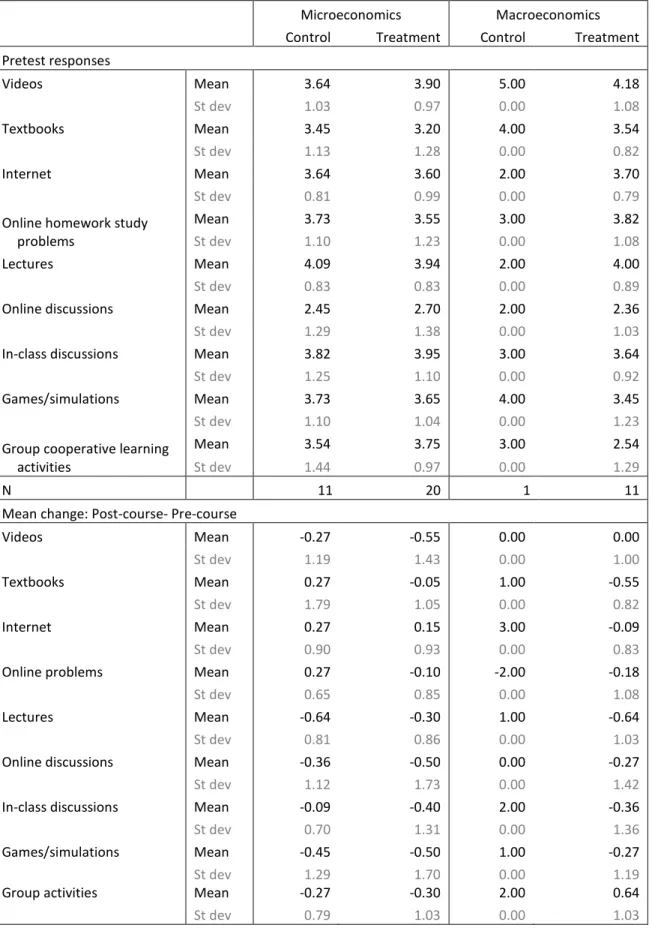
The top portion of Table 3 shows pretest student attitudes toward the usefulness of different study methods collected from survey responses for both control and treatment
students (1=not at all useful; 2=a little useful; 3=useful; 4=very useful; 5=extremely useful.) The bottom portion of Table 3 shows pre to post changes in these attitudes. The numbers include the matched sample of students who took both pre and posttests. Our hypothesis was that students in the treatment class, with access to the videos and self-check questions, would show increases in attitudes toward the usefulness of videos and online homework/study problems compared to the control group. This hypothesis is not verified by the data. However, given the limited number of responses in the matched sample this may not reflect the attitudes of the full sample if that information were available.
9
Table 3: Student Attitudes toward Usefulness of Study Methods
Microeconomics Macroeconomics Control Treatment Control Treatment Pretest responses Videos Mean 3.64 3.90 5.00 4.18 St dev 1.03 0.97 0.00 1.08 Textbooks Mean 3.45 3.20 4.00 3.54 St dev 1.13 1.28 0.00 0.82 Internet Mean 3.64 3.60 2.00 3.70 St dev 0.81 0.99 0.00 0.79
Online homework study problems
Mean 3.73 3.55 3.00 3.82
St dev 1.10 1.23 0.00 1.08
Lectures Mean 4.09 3.94 2.00 4.00
St dev 0.83 0.83 0.00 0.89
Online discussions Mean 2.45 2.70 2.00 2.36
St dev 1.29 1.38 0.00 1.03
In-class discussions Mean 3.82 3.95 3.00 3.64
St dev 1.25 1.10 0.00 0.92
Games/simulations Mean 3.73 3.65 4.00 3.45
St dev 1.10 1.04 0.00 1.23
Group cooperative learning activities
Mean 3.54 3.75 3.00 2.54
St dev 1.44 0.97 0.00 1.29
N 11 20 1 11 Mean change: Post-course- Pre-course
Videos Mean -0.27 -0.55 0.00 0.00 St dev 1.19 1.43 0.00 1.00 Textbooks Mean 0.27 -0.05 1.00 -0.55 St dev 1.79 1.05 0.00 0.82 Internet Mean 0.27 0.15 3.00 -0.09 St dev 0.90 0.93 0.00 0.83
Online problems Mean 0.27 -0.10 -2.00 -0.18
St dev 0.65 0.85 0.00 1.08
Lectures Mean -0.64 -0.30 1.00 -0.64
St dev 0.81 0.86 0.00 1.03
Online discussions Mean -0.36 -0.50 0.00 -0.27
St dev 1.12 1.73 0.00 1.42
In-class discussions Mean -0.09 -0.40 2.00 -0.36
St dev 0.70 1.31 0.00 1.36
Games/simulations Mean -0.45 -0.50 1.00 -0.27
St dev 1.29 1.70 0.00 1.19
Group activities Mean -0.27 -0.30 2.00 0.64
Table 4 shows student attitudes toward studying economics and mathematics for control and treatment classes, where 1=strongly disagree; 2=disagree; 3=neither agree nor disagree; 4=agree; 5=strongly agree. The lower portion of the panel displays the difference between mean posttest responses (not shown) and mean pretest responses, by group. Our hypothesis was that participating in the math/econ project would lower math anxiety for students. As shown in the lower panel, this hypothesis is not borne out by the limited number of student responses in our sample. Students in the treatment group who responded to the survey report more anxiety about both math and economics than students in the control group. However the standard deviations are large and the sample small, so the changes are arguably zero. And valid longitudinal comparisons for macro students cannot be made since there is only one student in the macro control sample. One possible explanation is that these courses are among the first taken that rely strongly on previous mathematics content, thus, even with the additional mathematical support, students anxiety regarding their math ability increases throughout the quarter.
Table 4: Student Attitudes toward Economics and Mathematics
Microeconomics Macroeconomics
Control Treatment Control Treatment
Pretest responses
Excited to study economics Mean 3.82 4.00 3.00 3.64
St dev 0.87 0.73 0.00 1.12
Anxious/nervous to study
economics Mean St dev 3.00 1.00 2.90 1.21 3.00 0.00 2.64 1.29
Enjoy studying math Mean 4.09 3.45 3.00 3.00
St dev 1.22 1.23 0.00 1.41
Anxious/nervous to study math Mean 2.64 2.95 3.00 2.82
St dev 1.43 1.28 0.00 1.54
Easily apply math knowledge to
other courses Mean St dev 3.91 1.04 3.15 0.99 3.00 0.00 3.27 1.35
Mean change: Posttest - Pretest
Economics: excited Mean -0.27 -0.65 2.00 -0.45
St dev 1.10 0.93 0.00 1.21
Economics: anxious Mean 0.00 0.15 0.00 0.36
St dev 1.10 1.09 0.00 1.21
Math: enjoy Mean 0.18 -0.15 0.00 -0.36
St dev 0.87 0.81 0.00 0.50
Math: anxious Mean 0.00 0.35 0.00 0.27
St dev 1.26 1.18 0.00 1.01
Math: easily apply knowledge Mean -0.27 0.30 0.00 0.00
St dev 1.00 1.34 0.00 1.00
11
G. Summary, Conclusions, and Next Steps
This PEIL project developed a series of 16 short videos and accompanying self-check assignments to address the mathematics that students need to know to succeed in principles of economics classes. In a controlled study, students in macro and micro principles of economics at CSUEB took pre and posttests in fall 2014 (control) and spring 2015
(treatment/experimental) to assess the effects of the materials on student learning and student attitudes. Unfortunately there was a disappointingly low level of student participation in the project that renders inconclusive the results of the research component of the study. As well, we are not able to assess a possible selection bias of students who were and were not in our sample. It may be that “good” students were more likely to participate in the project to earn promised extra credit, so a new question is what to do to motivate more students to
participate. We plan to continue collecting data on the effects of the math/econ project on student learning in fall 2015.
We presented our project at the annual meetings of the Western Economic Association International and our PowerPoint presentation is attached to this report. The project was very well-received and we were invited to have the project integrated into an interactive text book platform at Cal Poly Pomona. We have also been invited to incorporate out videos and self-check questions onto the “Economics Lowdown” site at the Federal Reserve Bank of St. Louis.
Despite inconclusive research findings, we believe that the creation of the math videos is an important step in addressing math deficiencies of principles of economics students. We believe that full utilization of the project will lead to improved economics skills and improved ability to apply math skills for students. Not having to teach basic math skills in economics will also free up time for economics instructors to focus on economics, another important outcome.
H. References:
Ballard, Charles L., Marianne F. Johnson. 2004. “Basic Math Skills and Performance in an Introductory Economics Class.” The Journal of Economic Education:Vol. 35, No. 1, 2004. Benedict, Mary Ellen and John Hoag. 2012. “The Role of Mathematics in the Major.” In
International Handbook on Teaching and Learning Economics, edited by Gail M. Hoyt and KimMarie McGoldrick. Edward Elgar: Northampton, MA.
Cohn, Elchanan, Sharon Cohn, Donald C. Balch, James Bradley Jr.. 1998. “The Effects of
Mathematics Background on Student Learning in Principles of Economics.” Journal of Education for Business: Volume 74, Issue 1, 1998, pp. 18-22.
Cohn,Elchanan, Sharon Cohn. 1994. “Graphs and Learning in Principles of Economics.” The American Economic Review Papers and Proceedings: Vol. 84, No. 2, pp. 197-200.
Lagerlöf , Johan N. M. and Andrew J. Seltzer. 2009. “The Effects of Remedial Mathematics on the Learning of Economics: Evidence from a Natural Experiment.” The Journal of Economic Education Vol. 40, No. 2.
Lopus, Jane S. 1997. Effects of the High School Economics Class on Learning in the College Principles Class. Journal of Economic Education (Vo. 22, No. 2). Pp 143 – 153.
Schuhmann, Peter W., KimMarie McGoldrick, and Robert T. Burrus. 2005. "Student quantitative literacy: importance, measurement, and correlation with economic literacy." The American Economist: 49-65.
13
I. Math-Econ Video Master List
1. Title: Graphing Demand
How do we plot a demand schedule to make a demand curve on a graph? The math behind the economics: Plotting on a Cartesian plane: http://youtu.be/lW1JkJEs610
2. Title: Interpreting Supply and Demand
How do we interpret supply and demand graphs? The math behind the economics: reading graphs: http://youtu.be/oHlQ51B-quA
3. Title: Shifting Supply and Demand Curves
What happens when supply and demand curves shift? The math behind the economics: shifting curves:
http://youtu.be/vq5qWdsDSRA
4. Title: Demand Equations
How do we find the equation of a straight line demand curve? The math behind the economics: finding the equation of a line: http://youtu.be/0qY4CsHbEsg
5. Title: Finding Equilibrium Algebraically
How do we find equilibrium? The math behind the economics: solving simultaneous equations:
http://youtu.be/GZt_nBknhik
6. Title: Price Elasticity of Demand
How do we compute price elasticity of demand? The math behind the economics: finding percentage changes: http://youtu.be/GOwuZe_cbv0
7. Title: Average Cost
How do we compute average total cost? The math behind the economics: finding averages:
http://youtu.be/TJXZIsoGxVQ
8. Title: Marginal Cost
How do we compute marginal cost? The math behind the economics: finding incremental changes): http://youtu.be/9qBS9fD7Vyw
9. Title: Marginal and Average Cost
What is the relationship between marginal cost and average cost? The math behind the economics: the relationship between marginal values and averages: http://youtu.be/kxilp7hy8iA
10. Title: Profit and Graphs
How do we find profit on a graph? The math behind the economics: tangents and the area of rectangles: http://youtu.be/pqrvlQSjGnc
11.Title: Consumer Surplus
How do we measure consumer surplus? The math behind the economics: measuring the area of a right triangle: http://youtu.be/k0uL8QElO3w
12. Title: Consumption Functions
What is a consumption function? The math behind the economics: mathematical functions: http://youtu.be/J9uUostpJJg
13. Title: Economic Growth Rates
How do we find economic growth rates? The math behind the economics: finding rates of change: http://youtu.be/xK2vVcD2O2U
14. Title: The Equation of Exchange
How do we interpret the relationship between the variables in the equation of exchange? The math behind the economics: solving equations for different variables: http://youtu.be/w0dAGaC4dOg
15. Title: Reserve Ratio
What is a reserve ratio? The math behind the economics: ratios: http://youtu.be/vdy9Qr2gsH8 16. Title: Aggregate Supply Curves
How do we interpret horizontal and vertical aggregate supply curves? The math behind the economics: horizontal and vertical lines: http://youtu.be/6p63H6b5xwI