Financing Public Education in Delaware
District Level Analysis
by
Simon Condliffe
Center for Applied Demography and Survey Research
College of Human Services, Education and Public Policy University of Delaware
www.cadsr.udel.edu Summer 2007
______________________________________________________________________________________ ii
The University of Delaware is committed to assuring equal opportunity to all persons and does not discriminate on the basis of race, color, gender, religion, ancestry, national origin, sexual preference, veteran status, age, or disability in its educational programs, activities, admissions, or employment practices as required by Title IX of the Educational Amendments of 1972, Title VI of the Civil Rights Act of 1964, the Rehabilitation Act of 1973, the Americans with Disabilities Act, other applicable statutes, and University policy. Inquiries concerning these statutes and information regarding campus accessibility and Title VI should be referred to the Affirmative Action Officer, 305 Hullihen Hall, 302/831-2835 (voice), 302/831-4552(TDD).
______________________________________________________________________________________ iii
TABLE OF CONTENTS
Page List of Figures ... iv List of Tables ... iv List of Charts... vi Executive Summary ...1 Introduction...4 Background...7 Expenditures ...15 Administrative Costs...25 Unit Allocation...41 Peer Comparisons ...53 Literature Review...64 Summary ...70 Appendix...74 Selected Bibliography...74 Glossary ...79______________________________________________________________________________________ iv
LIST OF FIGURES
Figure Page
1.1 Delaware School Districts... 8
LIST OF TABLES Table Page 1.1 Enrollment by School Districts ... 9
1.2 District Enrollment by School Type... 12
1.3 Delaware Charter Schools... 14
2.1 Allocation of Expenditure Increase, 1991-1992 to 2000-2001, Average of Districts ... 16
2.2 Staff Employed in Public Schools, 2004-2005 (Percent Distribution)... 19
2.3 Expenditures by Function by Level of Enrollment ... 20
2.4 Delaware Public Schools Expenditures by Function by Level of Spending ... 21
2.5 Change in Current Expenditure Shares 1999-2000 to 2004-2005... 22
2.6 Share of Current Expenditures by District 2004-2005 ... 23
3.1 Units and Professional Staff... 26
3.2 Average School Enrollment by District and Grade... 30
3.3 General Administration Costs, 2004-2005, Share of Total General Administration Costs... 35
3.4 School Administration Costs, 2004-2005, Share of Total School Administration Costs... 36
3.5 Delaware Teacher Salary State Contribution, 1989-1990 to 2003-2004... 37
3.6 Superintendent Salaries... 38
3.7 Principal Salary Schedule, Number of Teachers Basis ... 38
3.8 Principal Salary Schedule, Number of Division I Units Basis ... 39
3.9 Administration Staff Salary Schedule ... 39
4.1 13-Year and 6-Year Change in Total Regular and Special Unit Allotment ... 41
4.2 Special Education Enrollment as a Percentage of Total Enrollment ... 43
4.3 Special Education Units as a Percentage of Total Units ... 44
4.4 13-Year and 6-Year Change in Special Education Units ... 45
4.5 13-Year and 6-Year Change in Regular Unit Allotment... 47
4.6 Vocational Units by District... 50
5.1 Delaware School Districts: Public Education Expenditures Per-Pupil... 54
______________________________________________________________________________________ v
5.3 Sample Peer District Comparisons for Brandywine Expenditures Per Pupil ... 57 5.4 Sample Peer District Comparisons for Brandywine School District, Share of Current Expenditures
Per Pupil... 58 5.5 Sample Peer District Comparisons for Appoquinimink School District, Expenditures Per Pupil... 59 5.6 Sample Peer District Comparisons for Appoquinimink School District, Share of Current
Expenditures Per Pupil... 60 5.7 Sample Peer District Comparisons for Seaford School District, Expenditures Per Pupil ... 61 5.8 Sample Peer District Comparisons for Seaford School District, Share of Current Expenditures Per
______________________________________________________________________________________ vi
LIST OF CHARTS
Chart Page
1.1 Public Enrollment by School District... 7
1.2 Enrollment by County 1991-1992... 10
1.3 Enrollment by County 2003-2004... 11
3.1 School Administrative Expenses Per Pupil by District ... 18
3.2 Total Principal Salary Per Pupil of Enrollment... 31
3.3 School Administrative Expenses by District... 31
3.4 General Administrative Expenses Per Pupil by District... 33
3.5 General Administrative Expenses by District ... 34
______________________________________________________________________________________ 1
Executive Summary
This report updates the district analysis of Delaware’s Public Education Finance System. Understanding how the public education system currently uses financial resources is a first step towards gaining insight on how best to turn dollars into productive resources in districts, schools, and classrooms.
Phase I Summary
The findings of the state-level research are as follows. Public education is a $1.4 billion investment in Delaware. Expenditures grew 130% during the last decade. However, in per pupil, inflation-adjusted terms, expenditure growth was 34%. Public education revenue in Delaware is provided by the State (64%), local school districts (27%), and the Federal government (9%). Local school district revenue is raised primarily through property taxes (over 80%). Instruction receives the largest share of funding by function within the public education system. Despite the diversity of states in the Mid-Atlantic region, the distribution in percentage terms of public education financing is similar.
Phase II Findings Data
The research involved a large data collection and manipulation effort. Substantial data sets have been constructed during the course of this research, which will be maintained and updated for future research.
Numerous agents are involved in the process of providing public education in the state. Recognizing that education revenues and expenditures reflect the choices and priorities of each of these agents is important. However, data availability preempts the evaluation of each agent’s individual impact. The data compiled by government agencies gives greater focus to measuring enrollment than expenditures.
Financial data are published only at the district level, by broad revenue and expenditure categories. While these data are useful, they are still several steps removed from the
______________________________________________________________________________________ 2
necessary data to answer questions such as how efficiently and productively resources are being used in the provision of public education.
The financial data permit the identification of differing spending patterns among school districts within the state and across the country. Discerning the cause and impact of these differences involves going beyond the routine publications of government agencies. It is hoped that data availability will evolve over time to allow greater transparency in school districts’ finances, and permit more detailed research into public education finance.
Expenditures
Larger districts allocate a smaller proportion of their current expenditures to general administration than do smaller districts. The share of per pupil current expenditures on general administration is as low as 1% (Brandywine) and as high as 5% (Delmar). This implies an economy of scale benefit. However, Delmar is by far the smallest district in the state, making it an outlier in the data rather than the norm. Low enrollment districts (less than 5,000) apply 1% of their current expenditures to general education. Medium and high enrollment districts apply 1%.
Charter Schools
The emergence of Charter schools in Delaware is bringing greater education choice to the state. Given their short history in the state, the full effect of Charter schools has yet to be realized. It is likely that an equilibrium enrollment has not yet been established, making hazardous predictions of their long-term impact on districts and district financing.
Administration
School administrations’ share of current expenses varies across districts. School
administrators include principals, assistant principals, and office staff. School size is the primary determinant of school administration unit entitlement. Districts that are
______________________________________________________________________________________ 3
organized into smaller schools will tend to dedicate a larger share of current expenditures to school administration than districts organized into larger schools.
General administration costs per pupil are rising in many districts in Delaware. These costs include superintendents and their support staff. However, as a share of current expenditures, general administration costs per pupil are falling (this implies that general administrations’ share of additional funding is decreasing). School administration costs per pupil are rising in almost every district. School administration costs per pupil as a share of total current expenditures are rising, but not as fast as expenditures on net instruction.
Vocational/Special Education Students
One in every eight students in the state is classified as a special education student. This increased from one in every eleven students a decade ago. There are more vocational units allotted to regular school districts than the vocational districts.
Inter-district Comparisons
In Pennsylvania and Maryland, local funds pay for a majority of operating expenditures, meaning districts have greater discretion in allocating funds than with a rigid formula. There is greater variability between the districts in expenditure patterns, influencing, among other areas, the number of administration staff hired at the district and school level.
______________________________________________________________________________________ 4
Introduction
The College of Human Services, Education and Public Policy (CHEP) of the University of Delaware presents the following work as a study of the State’s investment of current financial resources in public education.
Understanding how the public education system currently uses financial resources is a first step towards insight on how best to turn dollars into productive resources in districts, schools, and classrooms. The report comes as the second phase of a multiphase project. Phase One1 is a single document that provides a system overview of how the state raises and spends the education dollar. Phase Two of the project extends the study to the district level.
The report is divided into multiple sections. The first section provides an overview of the Delaware school districts. The next section discusses expenditure patterns by district. The third section follows, covering administration costs. The fourth section discusses unit allocations. The subsequent sections draw peer comparisons, both regional and national. Administration per pupil spending: national comparison follows. A Mid-Atlantic school district comparison is then discussed, followed by a literature review. The final section summarizes the report.
1 Phase One is available at
______________________________________________________________________________________ 5
Methodology
The principal data source is the annual Report of Educational Statistics; a publication of the State Board of Education and the Department of Education. Peer data used within the report are available from the Federal Department of Education through the National Center for Education Statistics (NCES) and the Digest of Education Statistics. This report includes information on expenditures by major category and staffing levels. Staffing data include counts of professional staff, including administrators, teachers, librarians and counselors, instructional aides, and support staff. Analyzing this data provides a beginning towards understanding the utilization of funds, but the results are several steps removed from the data needed to answer important productivity issues. Nevertheless, these data provide a starting point for identifying spending patterns. School districts vary in a number of factors including land area, enrollment size, and school size. It is desirable to employ expenditure measures that allow for meaningful comparisons between districts. Constructing spending measures in per pupil terms equalizes expenditures across districts. Also, reporting spending in sub-categories as a share of total expenditures will illustrate the relative allocation of school resources.
Limitations
The primary source of public education expenditure data, the Report of Educational Statistics, is not without shortcomings. District data are the finest level of detail, and expenditures are reported by major spending category only. Therefore, while it remains possible to recognize different spending levels across districts, identifying the root cause for funds disbursement is not.
The Department of Education (DOE) is developing a database of school and district expenditures by object code. Presently this information is not publicly available from the DOE.
______________________________________________________________________________________ 6
All schools and districts record expenditures by object codes. Such information has the potential to permit very detailed inter-district and inter-school comparisons. Until recently, school and district staff performed the coding of expenditures by object code. This limited the usefulness of object code-based comparisons, since schools and districts may record the same expenditures in different object codes. Certain expense items, such as teacher salaries are not prone to misclassification. However, items such as computers, photocopies, supplies, and materials, may be.
The DOE has implemented a system that harmonizes the reporting of expenditure data. Rather than the districts preparing their own expenditure reports for submission to the Department of Education, the DOE will generate that report for the district to then verify. The lack of a uniform standard for expenditure reports across all school districts
compromises the usefulness of the object code data.
The National Center for Education Statistics (NCES) is the best single source for
expenditure data from all school districts nationwide. All data provided from their reports utilize the same consistent measures. However, a problem arises when comparing data from the NCES with data expressed within the Department of Education’s Report of Educational Statistics, as each actor defines the categories for expenditures in different ways. For the State of Delaware analyses, the Department of Education data serves as the primary source. However, the need for consistent methodology for interstate and inter-district comparisons necessitates the use of NCES. The difference in methodology does not detract from the value of the NCES data for cross-state comparison purposes.
______________________________________________________________________________________ 7
Background
The public education system in Delaware is organized into sixteen school districts, plus three vocational districts. The districts are shown in Figure 1.1 below. The three vocational districts, New Castle Vocational/Technical, Polytech, and Sussex Technical, serve New Castle County, Kent County, and Sussex County respectively.
During the 2004-05 school year Delaware’s school districts ranged in size from Delmar with 1,061 students to Christina with 19,421 students. District enrollments grew at different rates over the past ten years, as seen in Table 1.1. Chart 1.1 shows the enrollment per district for the 1991-1992, 1998-1999, 1999-2000, 2000-01, 2001-02, 2002-2003, 2003-04, and 2004-05 school years.
Chart 1.1
Public Enrollment by School District
Appo quin imin k Bran dywi ne Chris tina Colo nial Red Clay Caes ar R odne y Capi tal Lake For est Milf ord Smyr na Cape Hen lope n Delm ar Indi an R iver Laur el Seaf ord Woo dbrid ge
School District
0 5 10 15 20 25 Enrollment (thousands) 1991-92 1998-99 1999-00 2000-01 2001-02 2002-03 2003-04 2004-05______________________________________________________________________________________ 8
Figure 1.1
Delaware School Districts
Source: Center for Applied Demography and Survey Research, University of Delaware. Vocational Districts (not shown) follow county lines.
______________________________________________________________________________________ 9
Table 1.1
Enrollment by School Districts
School District Pct. Change 1991-1992 to 2004/05 Pct. Change 1998/9 to 2004/05
Appoquinimink 6,710 155.8 48.3
Brandywine 10,645 -4.3 -7.0
Christina 18,253 2.9 -10.0
Colonial 10,302 6.5 -2.5
New Castle Vocational/Technical 3,464 10.0 -0.6
Red Clay 14,793 5.5 -6.9 Caesar Rodney 5,841 15.9 -10.4 Capital 5,865 -6.1 -6.8 Lake Forest 3,571 6.8 2.2 Milford 3,762 1.5 -2.2 Polytech 1,149 26.7 7.3 Smyrna 3,645 19.8 6.5 Cape Henlopen 4,311 9.7 4.1 Delmar 1,061 76.8 44.0 Indian River 7,652 17.3 1.0 Laurel 2,040 -2.3 -0.2 Seaford 3,376 -3.0 -10.0 Sussex Technical 1,215 41.9 3.8 Woodbridge 1,937 14.6 6.3
State Totals (exc. Charter schools, special schools, data center,
DFAB). 109,592 Charter School of Wilmington 936
N/A 69.6
Positive Outcomes Charter School 120 N/A
100.0
East Side Charter School 140 N/A 75.0
Campus Community School 592 N/A 97.3
Marion T. Academy Charter School 632 N/A N/A
Thomas Edison Charter School 786 N/A N/A
Sussex Academy Charter School 318 N/A N/A
Kuumba Academy 242 N/A N/A
Newark Charter 648 N/A N/A
MOT Charter 675 N/A N/A
Providence Creek Academy Charter School
621 N/A N/A
Academy of Dover Charter School 425 N/A N/A
DE Military Academy 414 N/A N/A
Charter Total 6,549 N/A N/A
Grand Total 116,141
Public School Enrollment For Grades PK-12 By School District; September 30, 2004. Note: N/A denotes not available or not applicable. EdStats 2004-2005 Table 48.
______________________________________________________________________________________ 10
All districts increased enrollment over the 1991-92 to 2004-05 period, save Brandywine, Laurel, Seaford and Capital. Appoquinimink experienced the fastest growth: more than doubling its enrollment (see Table 1.1). Delmar school district saw the next highest rate of growth at just less than seventy-seven percent for the period. However, this district is somewhat unique in nature, in that during the time span it increased its teaching capacity to include middle school students. Elementary students within the district attend
Maryland public schools.
Over the 1998-99 to 2004-05 period, many more districts experienced declining enrollment in public schools, reflecting demographic shifts within the state as well as competition from Charter schools and private schools. Among the districts experiencing declining enrollment over the 1998-99 to 2004-05 period are Brandywine, Christina, Colonial, New Castle Vocational/Technical, Red Clay, Capital, Caesar Rodney, Milford, Laurel, and Seaford.
Chart 1.2
Enrollment by County 1991-1992
New Castle Kent Sussex State Total 0% 20% 40% 60% 80% 100% Public 59870 23282 19044 102196 Private 17901 1586 714 22812
Source: Center for Applied Demography and Survey Research, University of Delaware. State Board of Education and Delaware Department of Education, Education Statistics. Private school enrollment is reported by residence of pupil. An additional 3,154 pupils attend private school outside of Delaware.
______________________________________________________________________________________ 11
Chart 1.3
Enrollment by County 2004-2005
New Castle Kent Sussex State Total
0% 20% 40% 60% 80% 100% Public 66089 24733 21738 112560 Private 19951 2999 1989 24939 Charter 4473 1758 318 6549
Source: Center for Applied Demography and Survey Research, University of Delaware. State Board of Education and Delaware Department of Education, Education Statistics. Private and Charter school enrollment is reported resident district. No adjustment is made for resident pupils who attend private school outside of Delaware.
The preceding charts illustrate the composition of enrollment by county for the years 1991-1992 and 2004-2005. In New Castle County, seventy-seven percent of pupils attended public (non-Charter) schools in 1991-1992. By 2004-2005, this figure fell to seventy-three percent. Charter schools (now five percent of New Castle County
enrollment) are undoubtedly playing a role in this. The impact from charter schools has the potential to increase in the upcoming school years, as additional Charter schools open, and those in place expand to serve additional grade levels.
In Kent County, ninety-four percent of pupils attended public (non-Charter) schools in 1991-1992. By 2004-2005, this figure fell to eighty-four percent. Driving this change is an increase in the proportion of students in private schools (which increased from six percent to ten percent) and the emergence of Charter schools (which comprise six percent of total pupils in the county in 2004-2005).
______________________________________________________________________________________ 12
Sussex County experienced a similar decrease in the proportion of students enrolled at public schools. Public (non-Charter) enrollment fell from ninety-six percent to ninety percent. Simultaneously, private enrollment’s share rose from three percent to eight percent, and Charter school enrollment comprised one percent.
All counties experienced growth in total numbers of students. However, with the expansion of school choice, the mix of students attending public, private, or Charter schools altered.
Table 1.2
District Enrollment by School Type
1991-1992 2004-2005
School District Private Total
Public Students
Enrolled
Private % of Total
Students Private Total
Public Students Enrolled Charter School Enrollment Charter % of Total Students Private % of Total Students Appoquinimink 407 2,623 13.4% 1,495 6,710 675 7.6% 16.8% Brandywine 3,814 11,125 25.5% 3,563 10,645 926 6.1% 23.5% Christina 4,245 17,730 19.3% 5,537 19,421 1,522 5.7% 20.9% Colonial 1,978 9,674 17.0% 2,291 10,455 18.0% Red Clay 7,457 14,017 34.7% 7,065 15,394 1350 5.7% 29.7% Caesar Rodney 391 5,040 7.2% 834 6,741 120 1.6% 10.8% Capital 737 6,247 10.6% 1,085 5,865 1017 12.8% 13.6% Lake Forest 127 3,345 3.7% 302 3,571 7.8% Milford 175 3,706 4.5% 410 3,762 9.8% Smyrna 156 3,042 4.9% 368 3,645 621 13.4% 7.9% Cape Henlopen 62 3,931 1.6% 486 4,311 10.1% Delmar 27 600 4.3% 55 1,061 4.9% Indian River 106 6,526 1.6% 459 7,798 318 3.7% 5.4% Laurel 141 2,088 6.3% 256 2,040 11.1% Seaford 150 3,479 4.1% 369 3,376 9.9% Woodbridge 228 1,690 11.9% 364 1,937 15.8% Total 20,201 94,863 17.6% 24,678 105,763 6,549 4.8% 18.0%
Source: Public and private enrollment is reported by place of residence. Charter school enrollment is reported by location of school, not district of residence. Vocational/technical schools not shown and not included in totals.
______________________________________________________________________________________ 13
Enrollment has direct bearing on the level of state funding received by school districts in that it generates funding units from the state.2 Districts then allocate these funds across schools. A ‘98 percent rule’3 exists that requires schools to receive 98 percent of the funding they generate through enrollment. School districts can waive this rule only through a public hearing.
Examining the public/private/charter mix at the district level is hazardous. Students may attend private and charter schools irrespective of the school district residency. For example, an increase in enrollment in a private or charter school in Brandywine school district does not necessarily imply that all the additional students are residents of BSD. It is important to recognize that school choice affects enrollments differently depending on grade level. Vocational/Technical schools typically serve grades nine through twelve. Charter schools vary in their service (see Table 1.3 below). Presently, only Campus Community School serves grades one through twelve. In New Castle County, the Charter School of Wilmington, and the recently opened Delaware Military Academy serve high school grades. Kuumba Academy, Thomas Edison, and Marion T. Academy serve elementary and middle school grades. These latter Charter Schools have been in operation for a number of years now, and their initial effect on public enrollment will become apparent as more years of data are added.
2 For a detailed description, see
http://www.cadsr.udel.edu/DOWNLOADABLE/DOCUMENTS/Education%20Finance.pdf
3 Title 14, Part I, Chapter 17, Section 1704 (4) and is as follows:
(4) Each local school board shall allocate Division I units to schools in its district such that as of the last school day of October each school receives not less than 98% of the Division I units it generates as a result of the actual unit count. A local school board may waive this subsection after voting to waive it at a public meeting noticed for that purpose. Any local school board seeking such a waiver shall do so on or before December 1st of each year. Notice for such a meeting shall be placed in the local newspaper for 2 consecutive weeks before the meeting and shall be posted on the door of any school affected for the same time period, and a copy shall be sent to the principal, teacher association building representative, and Parent Teacher Organization/Parent Teacher Association parent leader of any affected school. The notice shall include the procedures for such persons to provide oral or written comments on the proposed waiver to the local school board. Notice of any approved waiver shall be sent to the same persons. (47 Del. Laws, c. 364, 2E; 48 Del. Laws, c. 250, 1; 14 Del. C. 1953, 1704; 49 Del. Laws, c. 151; 56 Del. Laws, c. 310; 63 Del. Laws, c. 120, I 1, 3; 65 Del. Laws, c. 348, 274; 69 Del. Laws, c. 212, 1; 71 Del. Laws, c. 180, 103; 71 Del. Laws, c. 483, 1.)
______________________________________________________________________________________ 14
Table 1.3
Delaware Charter Schools
Charter School Location Opened Grades Served
Campus Community (Elementary School
Campus) Dover 1998 1-7
Campus Community (High School Campus) 1998 8-12
Charter School of Wilmington Wilmington 1996 9-12
Delaware Military Academy Wilmington 2003 9-12
East Side Charter School Wilmington 1997 K-8
Family Foundations Academy New Castle 2006 1-3
KIPP Wilmington Wilmington 2007 5
Kuumba Academy Charter School Wilmington 2001 K-5
Marion T. Academy Charter (Elementary
School Campus) Wilmington 2000 K-5
Marion T. Academy Charter (Middle School
Campus) Wilmington 2000 6-8
Maurice J. Moyer Academy Wilmington 2006 6-7,9
MOT Charter School Middletown 2002 K-8
Newark Charter School Newark 2001 K-8
Pencader Business and Finance New Castle 2006 9-10
Positive Outcomes Charter School Camden 1996 7-12
Providence Creek Academy Charter School Clayton 2002 K-8 Sussex Academy of Arts and Sciences Georgetown 2000 6-8
Thomas A. Edison Charter School Wilmington 2000 K-8
Academy of Dover Charter School Dover 2003 K-6
______________________________________________________________________________________ 15
Expenditures
The annual Education Statistics report, a joint publication of the State Board of Education and Department of Education is the primary source for district-level expenditure data. The most recent edition covers the 2004-2005 school year.
There are several questions that need to be addressed when examining the financing of public education. How have funds been allocated in the past? How is new funding allocated? How are school staff allocated across public school functions? To answer these questions, a series of expenditure and staff measures are used.
Per pupil expenditures are used to aid the comparability between districts. Utilizing a thirteen-yeartime horizon helps to smooth any year-to-year volatility in expenditures. The effect of inflation on the costs of purchasing inputs absorbs a substantial portion of the increased public education expenditures. Between 1991-1992 and 2004-2005, current public education expenditures in the state (from all sources) rose from $572 million to over $1.4 billion, an increase of approximately 150%. During the same period, inflation grew 39%. Therefore, in inflation-adjusted terms, expenditures rose approximately $460 million (81%).
Table 2.1 illustrates the allocation of school-district spending across expenditure
categories in 1991, the allotment of the increase in real per-pupil spending that occurred over the period in dollar terms, and as a percentage of total real per-pupil increase, and finally the apportionment of the share of total spending in 2000-01. On average, school districts spent an additional $2,527 per pupil between 1991-2001. All categories received more inflation-adjusted dollars per pupil in 2000-01 than was the case in 1991-1992. For certain categories, there is a marked difference between 1991-1992 and 2000-2001 spending levels.
______________________________________________________________________________________ 16
Table 2.1
Allocation of Expenditure Increase, 1991-1992 to 2000-2001, Average of Districts
Source: Center for Applied Demography and Survey Research, University of Delaware. State Board of Education and Delaware Department of Education, Education Statistics. Charter schools not included.
The first column of Table 2.1 shows each category’s share of 1991-1992 current
expenditures. Net instruction received the largest share of current expenditures in 1991-1992 (62%). The second column of Table 2.1 reports the increase in inflation adjusted per-pupil increase in expenditures from 1991-1992 to 2000-2001. Column three reports the share of the change in real per-pupil expenditures, and column four, the share of 2000-2001 total expenditures.
The data show that instructional expenditures comprise about 67 percent of the operating budget, rising slightly from 62.1 percent in 1991 to 66.9 percent in 2000-2001. Thus, as schools utilized additional expenditures, more funds were directed towards the instruction category. The share of real per-pupil expenditures on student support and instructional staff support remain unchanged over the period. The data also show what have become typical expenditure distribution patterns: about 6 percent for student and instructional support, 1.2 percent for district administration, 6 percent for site administration, 12
Share of 1991 total (%) Real per-pupil increase in expenditures ($), 1991-92 to 2000-01 Share of the change Share of 2000-01 total Net Instruction 62.1% $ 1,578 64% 66.9% Student Support 4.4% $ 142 6% 4.4% Instructional Staff 1.6% $ 31 1% 1.7% General Admin. 1.3% $ 1 0% 1.2% School Admin. 5.8% $ 136 6% 6.0% Operations and Maint. 9.4% $ 349 13% 12.4% Student Transportation 6.5% $ 92 4% 5.8% Other Support 6.9% $ 141 5% 6.0% Food Services 2.1% $ 55 2% 1.2% Net Current Expense 100.0% $ 2,527 100% 100.0%
______________________________________________________________________________________ 17
percent for operations and maintenance, and about 15 percent for transportation, food, and other services.
General administrative costs received a relatively small share of new real per-pupil expenditures. This lowered their share of 2000-2001 expenditures to 1.2 percent. School administration costs received a larger share of new real per-pupil expenditures than their 1991-1992 allocation, rising to 6 percent.
Operations and maintenance took up a large share of the new real per-pupil expenditures over the period, raising the share of total expenditures to over 12%. Student
transportation’s share of total current expenditures in 2000-2001 is lower than ten years ago, falling to 5.8%. Other support and food services’ share of net current expenses also fell.
Operations and maintenance’s share of current expenses continues to grow. Conversely, student transportation, other support services, and food services each comprise a small share of net current expenses.
Since education services are organized by local education systems-school districts-and provided in schools and classrooms, statewide expenditure patterns need to be
disaggregated to these lower levels.
Translating these broad expenditures into staffing patterns is the next step in analyzing what happens to the education dollar (Table 2.2). Administrators do not appear to
represent a large portion of the total staffing. Administrators total 6.9 percent, in the case of Sussex Technical, and 3.6 percent in the cases of Cape Henlopen and Delmar.
The highest rate for administration is in Laurel (3.2 percent), and lowest is in Christina (2.3 percent). Combined, general and school support comprised a total of 4.7 percent in the state, on average.
______________________________________________________________________________________ 18
The table shows that teachers as a percentage of staffing by district ranges from 47.3 percent (Cape Henlopen) to 62.5 percent (Polytech). Teacher aides range from 3.0 percent of staff (Milford) to 6.1 percent (Colonial and Seaford). Collectively, teachers and teacher aides account for two-thirds of district staff.4 About one-third of staff performs administrative roles, such as secretaries, operation, maintenance, and transportation personnel. When questioning why only 60 percent of expenditures are spent on instruction, one answer is that operations, maintenance, transportation, and administration account for nearly a third of public school expenditures.
______________________________________________________________________________________ 19
Table 2.2
Staff Employed in Public Schools, 2004-2005 (Percent Distribution)
Administration TeachersInstructional Support Pupil Support
Skilled and Service Worker Total Academy of Dover Charter School 5.3% 55.3% 2.6% 2.6% 34.2% 100% Caesar Rodney School District 3.8% 55.4% 3.9% 4.2% 32.7% 100% Campus Community Charter School 5.9% 76.5% 2.0% 3.9% 11.8% 100% Capital School District 3.8% 55.7% 5.5% 3.6% 31.5% 100% Lake Forest School District 5.3% 58.8% 4.8% 4.8% 26.4% 100% Milford School District 5.3% 57.4% 3.0% 3.9% 30.4% 100% Polytech School District 8.3% 62.1% 5.5% 3.4% 20.7% 100% Positive Outcomes Charter School 12.5% 62.5% 6.3% 0.0% 18.8% 100% Providence Creek Academy Charter
School 7.5% 85.0% 2.5% 0.0% 5.0% 100%
Smyrna School District 5.2% 55.0% 5.0% 5.7% 29.1% 100% Appoquinimink School District 3.9% 60.3% 4.8% 3.7% 27.2% 100% Brandywine School District 4.9% 55.8% 4.1% 4.0% 31.3% 100% Charter School of Wilmington 4.7% 73.4% 6.3% 1.6% 14.1% 100% Christina School District 4.2% 52.1% 2.8% 5.6% 35.4% 100% Colonial School District 5.2% 53.9% 6.1% 6.4% 28.5% 100% Delaware Military Academy 9.7% 58.1% 19.4% 3.2% 9.7% 100% East Side Charter School 15.8% 57.9% 0.0% 0.0% 26.3% 100% Kuumba Academy Charter School 11.5% 65.4% 0.0% 7.7% 15.4% 100% Marion T. Academy Charter School 5.0% 52.5% 7.5% 2.5% 32.5% 100% MOT Charter School 9.8% 60.8% 2.0% 3.9% 23.5% 100% New Castle County Votech School
District 6.0% 53.8% 7.0% 2.6% 30.6% 100%
Newark Charter School 6.5% 67.7% 9.7% 3.2% 12.9% 100% Red Clay Consolidated School
District 5.1% 53.4% 3.6% 4.2% 33.8% 100%
Thomas A. Edison Charter School 4.3% 71.0% 4.3% 2.9% 17.4% 100% Cape Henlopen School District 3.6% 47.3% 3.5% 5.8% 39.8% 100% Delmar School District 3.6% 58.9% 4.5% 2.7% 30.4% 100% Indian River School District 4.0% 58.3% 3.7% 6.0% 28.0% 100% Laurel School District 6.8% 52.8% 6.0% 3.2% 31.2% 100% Seaford School District 3.9% 51.5% 5.9% 4.1% 34.6% 100% Sussex Academy of Arts and
Sciences 0.0% 72.0% 0.0% 4.0% 24.0% 100%
Sussex Technical School District 6.9% 56.6% 5.0% 4.4% 27.0% 100% Woodbridge School District 5.8% 54.6% 4.6% 3.1% 31.9% 100%
State 4.7% 54.9% 4.2% 4.6% 31.4% 100%
______________________________________________________________________________________ 20
The major portion of the education budget goes towards spending on instruction; but a large portion of instructional expenditures occurs outside the regular classroom on services for special-needs students. Districts also provide a host of non-education services. Districts run buses, heat and clean buildings, serve meals, and administer a complex system. The result is that only a small portion of the education dollar goes towards regular education instruction.
The proportion of approximately 60 percent of current expenditures being spent on instruction is quite consistent across the districts, and is corroborated by figures from national studies. Research examining spending across a number of different district characteristics, including spending level, rural and urban location, high and low percentages of minority students, as well as students from low-income families, shows that spending patterns are remarkably consistent.
Table 2.3
Delaware Public Schools
Expenditures by Function by Level of Enrollment.
Level of Enrollment
Component of Current Expenditures Low Medium High
Net Instruction 64% 66% 62%
Students Support 5% 4% 4%
Instructional Staff Support 2% 1% 1%
General Administration 1% 1% 1%
School Administration 6% 6% 6%
Operations and Maint. 9% 10% 11%
Student Transportation 6% 5% 6%
Other Support 5% 5% 9%
Food Services 1% 1% 1%
Net Current Expense 100% 100% 100%
Excludes Vocational Districts. 2004-2005 Edstats. Low enrollment is less than 5,000 students. Medium enrollment is between 5,000 and 10,000 students. High enrollment is greater than 10,000 students.
Table 2.3 arranges average district expenditures by level of enrollment. The allocation of expenditures has a level of stability across all district sizes. Net instruction receives 62 to 66 percent of expenditures on average. Student support and instructional support
______________________________________________________________________________________ 21
comprise 7 percent of expenditures in low enrollment districts compared to 5 percent in high enrollment districts. General administration consumes 1 percent in small, medium and high enrollment districts. Operations and maintenance comprise 9-11 percent across the three district size classes.
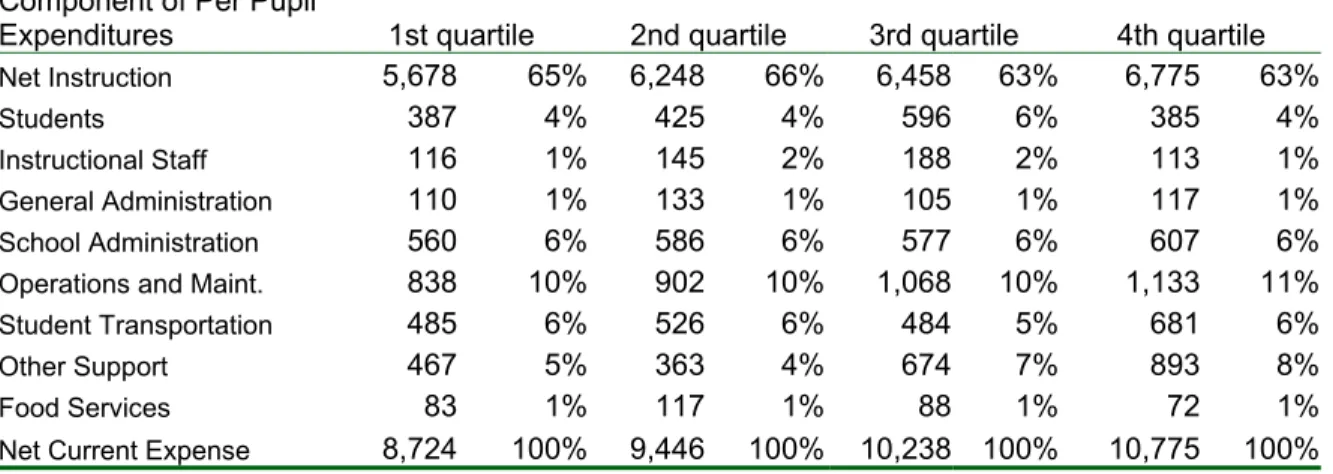
Table 2.4 presents expenditure data by school district, categorized by level of spending (quartiles). Net instruction comprises 65 percent of expenditures in low spending districts. This compares with 63 percent in high spending districts. Nevertheless, high spending districts spent 36 percent more on instruction per pupil ($7,215 versus $5,2995). This infers that as per pupil expenditures rise, expenditures per category rise in unison. In general, the pupil/teacher ratios have relative uniformity across the districts. Thus, differences in spending on teachers reflected primarily through the differences in teacher salary levels.
Table 2.4
Delaware Public Schools
Expenditures by Function by Level of Spending
Component of Per Pupil
Expenditures 1st quartile 2nd quartile 3rd quartile 4th quartile
Net Instruction 5,678 65% 6,248 66% 6,458 63% 6,775 63%
Students 387 4% 425 4% 596 6% 385 4%
Instructional Staff 116 1% 145 2% 188 2% 113 1%
General Administration 110 1% 133 1% 105 1% 117 1%
School Administration 560 6% 586 6% 577 6% 607 6%
Operations and Maint. 838 10% 902 10% 1,068 10% 1,133 11%
Student Transportation 485 6% 526 6% 484 5% 681 6%
Other Support 467 5% 363 4% 674 7% 893 8%
Food Services 83 1% 117 1% 88 1% 72 1%
Net Current Expense 8,724 100% 9,446 100% 10,238 100% 10,775 100%
Excludes Vocational Schools, special schools. EdStats 2004-2005.
Table 2.5 illustrates the change in the share of current expenditures per-pupil 1991-1992 to 2004-2005. As current expenditures rise, Appoquinimink spent a larger share on net instruction (11%) and less on operations and maintenance and other support (8% and 7%
______________________________________________________________________________________ 22
respectively). Several districts (Brandywine, Christina, Colonial, New Castle
Vocational/Technical, Red Clay, Lake Forest, and the charter schools) spent a smaller share of current expenditures on net instruction in 2004-05 compared to 1999-2000. Additional charts are provide in the Appendix.
Table 2.5
Change in Current Expenditure Shares 1999-2000 to 2004-2005
Net
Net Instruct. General School Operation Student Other Food Current District Instruction Students Staff Admin. Admin. & Maint. Trans. Support Services Expense
NEW CASTLE COUNTY
Appoquinimink 11% 1% 0% 0% 1% -8% 1% -7% 0% 0%
Brandywine -5% 1% 0% 0% 1% 2% 0% 3% -1% 0%
Christina -2% 1% 0% 0% -1% 0% 1% 2% 0% 0%
Colonial -3% 1% 0% 0% 0% 0% 0% 2% 0% 0%
New Castle Voc-Tech -1% 0% 0% 0% 1% -1% 0% 2% 0% 0%
Red Clay -2% -1% 0% 0% 1% -3% 0% 5% 0% 0% COUNTY TOTALS -1% 0% 0% 0% 0% -1% 0% 2% 0% 0% KENT COUNTY Caesar Rodney 0% -1% 0% 0% 0% -1% 0% 0% 0% 0% Capital 2% 1% -3% 0% 0% 2% 0% -1% 0% 0% Polytech 4% -1% -1% 0% -1% -2% -1% 2% 0% 0% Lake Forest -2% 1% 1% -1% 0% 1% 1% 0% 0% 0% Milford 0% 0% 0% 0% 1% 0% 1% 0% 0% 0% Smyrna 0% 0% 0% 0% 0% 0% -1% 1% 0% 0% COUNTY TOTALS 1% 0% -1% 0% 0% 0% 0% 0% 0% 0% SUSSEX COUNTY Cape Henlopen 2% 0% 0% 0% 0% -1% -1% -1% 0% 0% Delmar 1% 1% 1% -1% 1% 1% -1% -1% -1% 0% Indian River 3% 0% 0% 0% 0% -1% 0% -1% -1% 0% Laurel 0% 0% 0% 0% -1% 1% 0% 0% 1% 0% Seaford 6% 1% 1% 0% -1% -9% 0% 1% 0% 0% Sussex Technical 3% 0% 0% -1% 0% 0% 0% -2% 0% 0% Woodbridge 2% 0% 0% -1% 1% 0% 0% 0% 0% 0% COUNTY TOTALS 3% 0% 0% 0% 0% -2% 0% 0% 0% 0% CHARTER TOTALS -1% 2% 1% -9% 1% 2% 4% 0% 0% 0%
TOTAL ALL DISTRICTS 0% 0% 0% 0% 0% -1% 0% 1% 0% 0%
Department of Education -1% 0% 0% 0% 0% 0% 1% 5% -5% 0%
TOTAL ALL DISTRICTS, STATE -1% 0% 0% 0% 0% -1% 0% 2% 0% 0%
Excludes vocational school districts, special schools and data centers.
______________________________________________________________________________________ 23
Table 2.6
Share of Current Expenditures by District 2004-2005
Support Services Net
Net Instruct. General School Operation Student Other Food Current
District Instruction Students Staff Admin. Admin. & Maint. Trans. Support Services Expense
NEW CASTLE COUNTY
Appoquinimink 65% 4% 0% 1% 6% 11% 6% 4% 1% 100%
Brandywine 63% 6% 2% 1% 6% 12% 4% 6% 1% 100%
Christina 62% 4% 1% 1% 6% 11% 8% 7% 1% 100%
Colonial 65% 4% 2% 1% 7% 9% 6% 6% 1% 100%
New Castle Voc-Tech 58% 5% 1% 1% 7% 13% 8% 6% 1% 100%
Red Clay 62% 2% 1% 1% 6% 10% 5% 12% 1% 100% COUNTY TOTALS 63% 5% 1% 1% 6% 10% 6% 7% 1% 100% KENT COUNTY Caesar Rodney 67% 5% 2% 2% 6% 8% 4% 4% 1% 100% Capital 66% 4% 1% 1% 4% 11% 5% 7% 1% 100% Polytech 63% 4% 1% 2% 4% 9% 7% 9% 1% 100% Lake Forest 61% 6% 1% 1% 4% 9% 6% 11% 1% 100% Milford 66% 3% 2% 1% 6% 10% 6% 5% 1% 100% Smyrna 64% 6% 2% 1% 7% 11% 4% 5% 1% 100% COUNTY TOTALS 65% 5% 1% 1% 5% 10% 5% 7% 1% 100% SUSSEX COUNTY Cape Henlopen 65% 6% 3% 2% 6% 8% 6% 3% 1% 100% Delmar 66% 5% 1% 5% 5% 9% 5% 3% 1% 100% Indian River 67% 5% 1% 1% 6% 9% 6% 4% 1% 100% Laurel 62% 5% 1% 3% 7% 13% 6% 2% 1% 100% Seaford 69% 5% 2% 1% 5% 8% 4% 4% 1% 100% Sussex Technical 61% 4% 1% 2% 6% 11% 9% 5% 1% 100% Woodbridge 60% 5% 3% 2% 7% 10% 7% 5% 1% 100% COUNTY TOTALS 65% 6% 2% 2% 6% 9% 6% 3% 1% 100% CHARTER TOTALS 57% 5% 2% 2% 4% 14% 11% 6% 1% 100%
TOTAL ALL DISTRICTS 63% 5% 1% 1% 6% 10% 6% 7% 1% 100%
Department of Education 1% 0% 0% 0% 0% 0% 5% 63% 31% 100%
TOTAL ALL DISTRICTS, STATE 59% 5% 1% 1% 5% 9% 6% 11% 3% 100%
______________________________________________________________________________________ 24
Summary
Instruction receives approximately 60 percent of per pupil spending on average.
Staffing levels reveal some degree of variation across districts. The percent of staff listed as teachers ranges from Cape Henlopen with 47 percent, to Polytech with 62 percent. Administration staff as a percentage of total staff does not tend to vary significantly by district size.
There is little evidence that larger districts dedicate a greater share of expenditures for instruction than smaller districts. The four districts with enrollment greater than 10,000 spend between 62% and 66% of current expenditures on net instruction. Delmar, by far the smallest district in the state, spends 66%. The degree of variation in net instruction expenditures across districts is small. Indian River and Caesar Rodney, a medium district of 7,600 and 5,800 pupils respectively, dedicate 67% of their budget to net instruction: the largest shares among Delaware districts.
______________________________________________________________________________________ 25
Administrative Costs
A central point of focus for this study is the administrative costs for each school district. The Delaware Department of Education identifies two branches of administrative
expenses.
1. General Administration: Chief School Officers, Assistant Superintendents, Administrative Assistants, and Clerical.
2. School Administration: Principals, Assistant Principals, and Clerical.
Although not labeled as administrative costs, some activities that could be considered administration are reported as other support services. The definition of other support services is: directors of administration, support specialists, support supervisors, and administrative assistants and clerical staff not classified as general or school
administration. The Delaware Department of Education distinguishes between school administration and other support services on the basis that the former is concerned with policies and procedures, while the latter is concerned with the general operation of the school.
______________________________________________________________________________________ 26
Table 3.1
Units and Professional Staff
Employee Units
Superintendent 1 for every district
Assistant Superintendent 1 per 300 units per district, but not to exceed a total of 2 per district
Principals 1 per 15 or more units per district
Assistant Principals 1 per 30 units with 1 additional assistant added at 55 units. After 55 units, one assistant principal may be
employed per every 20 additional units beyond the first 55 units.
Driver Education Specialists 1 per each 125 10th grade students or 1/5 of a
teacher for every 25 10th grade students
Directors 1 per the first 200 units and 1 for each additional full 100 units, not to exceed a total of 6 per local
district
Administrative Assistants 1 per local school district
Supervisors 1 per 150 units. Districts with not enough units will receive a fractional part of the first supervisor Supervisors of Transportation 1 per 7,000 or more pupils transported Supervisors of School Lunch (a) 1 per district with less than 500 units having 4 or
more schools with lunch programs Supervisors of School Lunch (b) 1 in any district having 500 units or more. Also,
each district shall employ additional supervisors so that the ratio is 1 to 300 units; in which the additional supervisors are paid from receipts of
cafeteria funds.
Supervisors of Buildings and Grounds 1 per district if the district has 95 or more building units
Clerical (Section 1308 (a)) 1 per 10 units up to the first 100 units and 1 additional for each additional 12 units Custodial 1 per 12 building units (building units based on
space, not units of pupils)
Cafeteria Managers 1 per cafeteria
Cafeteria Workers 1 worker for 7 hours for every 100 meals Class Aides 2–in lieu of teachers in some education settings ILC
______________________________________________________________________________________ 27
Clearly, school and district enrollment units play a role in the funding of administrative staff. The more units a school and district generate, the more state funding they receive. There is an incentive, therefore, for districts and schools to organize in such a way as to maximize their unit allotments. A unit generates funding based on the state salary scale, where funds vary with education and experience. The state funds then are supplemented with local revenue funds.
Regardless of district size, there must be provisions for a superintendent (the statewide average superintendent salary is $130,860), along with an administrative assistant. A school principal is funded per 15 units, for which all schools qualify. Enrollment units earn additional assistant principals and assistant superintendents for a district.
Accruing the necessary units for an assistant principal depends on school size. A 500-student high school will earn a ½ assistant principal. A further 100 high school 500-students, will earn a full assistant principal. To earn a further ½ assistant principal requires a high school of 1,000 regular students. Those districts with preferences for smaller schools may therefore be at a disadvantage in accruing the necessary units to qualify for state funding of these positions.
The following series of charts illustrates the general administration and school administration costs per pupil per district.
Within each of these accounts, there are the following sub-accounts:
• Salaries • Benefits • Contracted Services • Supplies • Capital Outlay • Other
______________________________________________________________________________________ 28
Adjusting administrative costs to per pupil levels aids the inter-district comparisons (see Chart 3.1 below). Among the districts with higher school administrative expenses per pupil are the Vocational/Technical districts. This can be attributed to their relatively large budgets and small enrollment count of only high school aged students.
School Administration
Each district spent more on school administrative costs per pupil in 2004-2005 than 1998-99 save Polytech.
Chart 3.1
School Administrative Expenses Per Pupil by District
Appo quin imin k Bran dywi ne Chris tina Colo nial New Cast le V oc T ec Red Clay Caes ar R odne y Capi tal Poly tech Lake For est Milf ord Smyr na Cape Hen lope n Delm ar Indi an R iver Laur el Seaf ord Suss ex T echn ical Woo dbrid ge Char ter S choo ls Stat e To tals 0 200 400 600 800 1000
1200 School Admin Expenses Per Pupil $
1998-99 1999-00 2000-01 2001-02 2002-03 2003-04 2004-05
Source: Center for Applied Demography and Survey Research, University of Delaware. State Board of Education and Delaware Department of Education, Education Statistics.
The three vocational districts are among the highest spenders on school administration expenses per pupil. New Castle Vo-Tech spent $1,062 per pupil on school administrative costs in 2004-05. Sussex Technical spent $744 per pupil, and Polytech, $400. The smaller districts of Woodbridge and Cape Henlopen, have school administration expenses per pupil greater than $700. Lake Forest, itself a relatively small district with under
______________________________________________________________________________________ 29
4,000 enrollment, has one of the lowest school administrative expenses per pupil at $407. Charter schools spend $285 per pupil on school administration.
Christina has relatively high school administration expenses per-pupil: high even compared to other large-enrollment districts such as Brandywine, Colonial, and Red Clay. Christina’s middle and high schools average enrollments are the largest of any district. While this translates into school administration costs being spread over a large number of pupils, it also suggests that the schools generate many units with which to hire administrative staff.
______________________________________________________________________________________ 30
Table 3.2
Average School Enrollment by District and Grade
School District Elementary Middle High
Appoquinimink 550 671 1,805 Brandywine 429 587 1,119 Christina 506 1,096 1,592
Colonial 467 983 2,369 New Castle VoTec 1,118
Red Clay 445 717 926 Caesar Rodney 408 408 1,785 Capital 347 998 1,470 Lake Forest 440 612 841 Milford 485 946 998 Polytech 1,149 Smyrna 421 657 990 Cape Henlopen 412 516 1,172 Delmar 534 Indian River 403 847 933 Laurel 341 333 489 Seaford 335 783 884 Sussex Technical 1,212 Woodbridge 600 672 509
Source: Department of Education, 2004-2005. Enrollment includes regular and special. Charter schools and special schools excluded.
For a school district to receive additional financial support for school administrators above the core level of one principal and administrative assistant, the district must have schools with large enrollments in order to generate funding units. Small schools must always spend a certain floor amount on administration costs, thus their per pupil costs may appear to be greater than schools of medium to large enrollment size that have more students over which to spread the costs. For the smallest schools, rising enrollment works to lower school administration per pupil expenditures. However, once the enrollment level generates enough units to fund another administrator, the amount of total school administration expenses increases accordingly, raising the per pupil expenses while decreasing the number of pupils per administrator. Thus, the per pupil school
administration expense rate declines as enrollment increases until the level when another unit is generated, at which point the process repeats itself as seen in chart 3.2 below.
______________________________________________________________________________________ 31
Chart 3.2
Total Principal Salary Per Pupil of Enrollment
15 20 25 30 35 40 45 50 55 60 65 70 75 80 85 90 95 Units of Enrollment $125 $145 $165 $185 $205 $225 $245 $265
Principal Salary Per Pupil
Source: Center for Applied Demography and Survey Research, University of Delaware. State Board of Education and Delaware Department of Education, Education Statistics. State average principal and vice-principal salary used in calculations (Table 20). One unit equals twenty enrolled students.
Chart 3.3
School Administrative Expenses by District
Appo quin imin k Bran dywi ne Chris tina Colo nial New Cast le V oc T ec Red Clay Caes ar R odne y Capi tal Poly tech Lake For est Milf ord Smyr na Cape Hen lope n Delm ar Indi an R iver Laur el Seaf ord Suss ex T echn ical Woo dbrid ge Char ter S choo ls Stat e To tals 0% 20% 40% 60% 80%
100% School Admin Expenses 2004-05
Salaries Employee Benefits Contracted Services Supplies Capital Outlay
Source: Center for Applied Demography and Survey Research, University of Delaware. State Board of Education and Delaware Department of Education, Education Statistics.
______________________________________________________________________________________ 32
Chart 3.3 shows the share of school administration expenses by category. Salaries and benefits comprise the majority of administrative expenses. There is not a large degree of variation across many districts. In general, districts’ salaries and benefits comprise over 90 percent of school administration costs. However, one example of divergence occurs within the spending on contracted services between the districts. Charter schools spend 30% of their school administration costs on contracted services. Among regular districts at the high-end, Christina spends 16%, and at the low end Delmar spends less than 1%. This impacts the amount spent by each district on other categories, such as salaries and employee benefits. Aside from charter schools, Christina spends the lowest percentage of school administration expenditures on employee salaries in the state at just over 60%. All other districts spend between seventy and eighty percent on salaries. There are
insufficient data to discern whether performing functions in-house rather than contracting is more costly, less efficient, or less flexible.
General Administration
General administrative expenses per pupil are rising in many districts including
Appoquinimink, Christina, New Castle Vocational/Technical, Red Clay, Cape Henlopen, Indian River, and Seaford. Only a handful of districts experienced lower general
administrative costs per pupil over the period to 2004-05 (Lake Forest and Charter Schools).
______________________________________________________________________________________ 33
Chart 3.4
General Administrative Expenses Per Pupil by District
Appo quin imin k Bran dywi ne Chris tina Colo nial New Cast le V oc T ec Red Clay Ceas ar R odne y Capi tal Poly tech Lake For est Milf ord Smyr na Cape Hen lope n Delm ar Indi an R iver Laur el Seaf ord Suss ex T echn ical Woo dbrid ge Char ter S choo ls Stat e To tals 0 100 200 300 400 500
600 General Admin Salary Expenses Per Pupil $
1998-99 1999-00 2000-01 2003-04 2004-05
Source: Center for Applied Demography and Survey Research, University of Delaware. State Board of Education and Delaware Department of Education, Education Statistics.
Chart 3.4 shows the rate and change of general administrative costs per pupil by district over the three-year period between 1998-99 and 2004-05. The smaller districts that have low enrollment figures, such as Delmar and the vocational-technical districts, have the highest general administrative costs per pupil rates. This is due to the fact that all districts have the same basic allotment for general administration, no matter what their enrollment size happens to be, i.e. all districts have at least a superintendent and administrative assistant.
The following chart (3.5) shows the composition of general administration costs by expenditure type. General administration salaries as a percentage of total general administrative costs vary greatly between districts. At one end of the spectrum,
Appoquinimink spends approximately 43% of its general administrative costs on salaries. At the opposite end, Woodbridge spends approximately 72%.
Employee benefits by district exhibit a relatively narrower range. At the low end, Capital dedicates 16% of general administrative costs to employee benefits. At the high end,
______________________________________________________________________________________ 34
Delmar and Polytech allocate 27% of their general administrative costs to employee benefits.
Contracted services exhibit a large degree of variation across districts. The range of contracted services expenditures as a percentage of general administrative costs is zero (Woodbridge) to 40% (Appoquinimink).
A partial explanation for the degree of these variations may lie with the hiring practices of the districts. Some districts rely more heavily on in-house staff for certain activities rather than outsourcing to contracted services. This skews their expenditures towards salaries and away from contracted services. The converse may be true for districts that favor the use of contracted services over in-house employees.
Chart 3.5
General Administrative Expenses by District
Appo quin imin k Bran dywi ne Chris tina Colo nial New Cast le V oc T ec Red Clay Caes ar R odne y Capi tal Poly tech Lake For est Milf ord Smyr na Cape Hen lope n Delm ar Indi an R iver Laur el Seaf ord Suss ex T echn ical Woo dbrid ge Char ter S choo ls Stat e To tals 0% 20% 40% 60% 80%
100% General Admin Expenses 2004-05
Salaries Employee Benefits Contracted Services Supplies Capital Outlay
Source: Center for Applied Demography and Survey Research, University of Delaware. State Board of Education and Delaware Department of Education, Education Statistics.
______________________________________________________________________________________ 35
Table 3.3
General Administration Costs, 2004-05 Share of Total General Administration Costs
Salaries Benefits Contracted Services Supplies Capital Outlay Other Total Appoquinimink 43 18 40 0 0 0% 781,714
Brandywine 50 20 26 4 0 0% 1,003,182
Christina 53 21 25 0 0 0% 2,055,372
Colonial 58 23 8 11 0 0% 945,597
New Castle
Voc-Tech 49 19 25 7 0 0% 549,843 Red Clay 50 21 28 0 0 0% 1,565,073 Caesar Rodney 58 25 17 0 0 0% 1,040,962 Capital 40 16 19 24 0 0% 628,398 Polytech 66 27 5 2 0 0% 347,383 Lake Forest 67 25 6 2 0 0% 319,405 Milford 55 20 23 1 0 0% 389,594 Smyrna 49 18 33 0 0 0% 248,768 Cape Henlopen 56 22 22 0 0 0% 787,888 Delmar 65 27 5 4 0 0% 405,664 Indian River 56 22 21 0 0 0% 617,450 Laurel 62 24 14 0 0 0% 517,844 Seaford 47 18 34 1 0 0% 369,666 Sussex Technical 62 23 14 1 0 0% 390,426 Woodbridge 72 28 0 0 0 0% 363,490 Charter Totals 64 22 13 1 0 0% 1,112,141 State 55 22 21 3 0 0% 14,501,650
Source: Center for Applied Demography and Survey Research, University of Delaware. State Board of Education and Delaware Department of Education, Education Statistics.
______________________________________________________________________________________ 36
Table 3.4
School Administration Costs, 2004-05 Share of Total School Administration Costs.
Salaries Benefits Contracted Services Supplies Capital Outlay Other Total ($) Appoquinimink 69 28 2 1 0 0% 3,344,899
Brandywine 69 27 3 1 1 0% 6,768,336
Christina 59 23 16 1 0 0% 11,868,474
Colonial 71 28 0 0 1 0% 6,161,828
New Castle
Voc-Tech 68 27 6 0 0 0% 3,677,473 Red Clay 70 30 0 0 0 0% 8,660,732 Caesar Rodney 70 30 0 0 0 0% 3,399,602 Capital 65 27 4 1 4 0% 2,499,562 Polytech 63 26 10 0 0 0% 544,930 Lake Forest 71 27 0 1 0 0% 1,453,415 Milford 72 27 1 1 0 0% 2,189,373 Smyrna 72 27 0 0 0 0% 2,179,907 Cape Henlopen 69 28 2 0 0 0% 3,200,548 Delmar 71 29 0 0 0 0% 473,575 Indian River 71 28 1 1 0 0% 4,444,675 Laurel 68 27 5 0 0 0% 1,280,926 Seaford 72 28 0 0 0 0% 1,653,979 Sussex Technical 72 27 0 1 0 0% 903,497 Woodbridge 69 27 4 0 0 0% 1,389,306 Charter Totals 50 17 30 3 0 0% 1,863,770 State 67 27 6 1 0 0% 72,573,342
Source: Center for Applied Demography and Survey Research, University of Delaware. State Board of Education and Delaware Department of Education, Education Statistics.
______________________________________________________________________________________ 37
Table 3.5
Delaware Teacher Salary State Contribution, 1989-1990 to 2003-2004
School Year BA 0 Exp
Yearly Increase $ Yearly Increase % Masters 0 Exp Yearly Increase $ Yearly Increase % Doctorate 0 Exp Yearly Increase $ Yearly Increase % 1989-1990 $14,789 $16,858 $19,226 1990-1991 $15,546 $757 5.12% $17,722 $864 5.13% $20,210 $984 5.12% 1991-1992 $15,546 $0 0.00% $17,722 $0 0.00% $20,210 $0 0.00% 1992-1993 $16,012 $466 3.00% $18,254 $532 3.00% $20,816 $606 3.00% 1993-1994 $16,332 $320 2.00% $18,618 $364 1.99% $21,232 $416 2.00% 1994-1995 $16,822 $490 3.00% $19,177 $559 3.00% $21,869 $637 3.00% 1995-1996 $17,327 $505 3.00% $19,753 $576 3.00% $22,525 $656 3.00% 1996-1997 $17,674 $347 2.00% $20,148 $395 2.00% $22,976 $451 2.00% 1997-1998 $18,204 $530 3.00% $20,763 $615 3.05% $23,665 $689 3.00% 1998-1999 $18,750 $546 3.00% $21,375 $612 2.95% $24,375 $710 3.00% 1999-2000 $19,313 $563 3.00% $22,017 $642 3.00% $25,107 $732 3.00% 2000-2001 $22,560 $3,247 16.81% $25,718 $3,701 16.81% $29,328 $4,221 16.81% 2001-2002 $23,134 $574 2.54% $26,373 $655 2.55% $30,074 $746 2.54% 2002-2003 $23,597 $463 2.00% $26,901 $528 2.00% $30,676 $602 2.00% 2003-2004 $23,597 $0 0.00% $26,901 $0 0.00% $30,676 $0 0.00%
Source: Center for Applied Demography and Survey Research, University of Delaware. Delaware Department of Education Salary Schedules 1989-2003.
Table 3.5 above shows the change in state salaries for three different education levels with no experience. The columns describe the base salary for Bachelor’s degree no experience, the corresponding yearly increase in dollars, and the yearly percent increase. The same columns describe the master’s degree holders and doctoral degree holders. The state salary schedule describes the state’s salary payment for teachers at various levels of experience and education. The schedule also serves as a basis for non-teaching state such as superintendents, principals, and administrative staff. The salary schedule is constructed by first setting the salary for a zero experience, no degree teacher. From this value, all other values are calculated. The table above shows the growth in salaries of zero experience teachers at differing levels of education. Very quickly it can be
discerned that the same rates of increase were applied at each education level since 1989-1990. The growth rate of teacher salaries fluctuated between two and three percent during the nineties, matching the growth of prices for that time period. In nominal terms (non-inflation adjusted terms) salaries grew sixty percent. Inflation grew thirty percent over the period. In the 2000-2001 school year, salaries were raised significantly:
______________________________________________________________________________________ 38
seventeen percent. This increase was designed to improve the competitiveness of starting teacher salaries in Delaware vis-à-vis other states. The increase was applied across all education and experience levels. Non-teaching staff salaries are driven by this same salary schedule. Superintendent salaries are based on experience, education, and the size of the district. The teacher salary schedule result is increased based on the district size per the table below. The larger of the amount or multiplier determines the
superintendent’s pay.
Table 3.6
Superintendent Salaries
# D1 Units Amount Multiplier Less than 71 $6,450 0.3 71-149 $8,370 0.3 150-199 $10,293 0.3 200-249 $10,293 0.4 250-399 $12,219 0.4 400 or More $12,219 0.5
Source: Center for Applied Demography and Survey Research, University of Delaware. The above amount or multiplier is applied to the salary schedule result whichever is larger.
Principal salaries follow a similar methodology, but are based on either the number of teachers or the number of Division I units, plus the principals, experience.
Table 3.7
Principal Salary Schedule, Number of Teachers Basis
# of Teachers in School Experience 15-19 20-29 30-39 40-59 60+ 0 $851 $1,101 $1,350 $1,726 $2,103 1 $1,101 $1,350 $1,601 $1,976 $2,352 2 $1,350 $1,601 $1,851 $2,228 $2,602 3 $1,601 $1,851 $2,103 $2,478 $2,853 4 $1,851 $2,103 $2,352 $2,728 $3,103 5 $1,969 $2,246 $2,518 $2,930 $3,341 6 $2,079 $2,378 $2,671 $3,116 $3,560 7 $2,183 $2,502 $2,816 $3,292 $3,767 8 $2,373 $2,702 $3,025 $3,516 $4,005 9 $2,563 $2,902 $3,234 $3,740 $4,243