ABSTRACT
LAU, MEI YING. Development of a Severity Measure for Fault Tree Analysis and an Intuitive Fault Tree Analysis Software Prototype. (Under the direction of Dr. David B. Kaber).
Despite usefulness of Fault Tree Analysis (FTA), limitations exist in comparison to other safety
analysis techniques. Substantial effort is required for assessment of single fault outcome and
determination of an outcome probability. Through a literature review and examination of
available functions in commercial FTA software products, it was observed that FTA lacks a
structured functional approach to account for the severity of intermediate events to a fault as well
as the severity of fault outcomes. To address this limitation, a novel Consequence
Severity-Probability approach is proposed for extension of static fault tree modeling. Related to this, to
limit the scope of the project, all fault tree presentations in this proposal are restricted to coherent
static fault trees, making use of only AND/OR gates, and not incorporating a time factor, as in
dynamic fault trees.
The project was divided in two phases. Phase I focused on development of the new analytical
method and a numerical demonstration. Phase II was dedicated to empirical validation of the
new approach. In the first phase, the new approach to event severity assessment, as part of FTA,
was introduced with a detailed application procedure, illustrated example, and a summary of the
algorithm. A sensitivity analysis was conducted based on a published accident case with
established severity assignments in order to eliminate any potential analyst bias influence on the
example severity classification. Results demonstrated that the new approach allows for further
insights into the effect of initiating events across severity levels that are lacking in Traditional
importance approach.
The second phase of project involved validation of the new approach by safety expert
unfamiliar with the new approach, the evaluation was conducted using a software prototype. A
FTA software prototype, with capability to perform both traditional FTA and new analyses, was
developed using Just-In-Mind prototyping tool. A leading FTA software product (TopEvent FTA
2017 Professional) was selected as foundation for prototype development based on an
application functionality review. Prototype interface design recommendations used in
development were obtained by administration of a heuristic evaluation with human factors
experts, including application of ten usability heuristics.
After prototype development, safety professionals were invited to conduct a task-oriented
evaluation. The experiment followed a within-subjects design with two test trials for each
participant by variations on the approach to obtain FTA outputs. Analyses were conducted and
results demonstrated that the new approach received higher perceived usefulness ratings from
experts while maintaining a comparative level of perceived usability and confidence ratings in
comparison to the traditional approach. The new approach was found to increased perceived
workload in comparison to the traditional approach with the additional event consequence
thinking exercises.
In summary, a novel Consequence Severity-Probability approach, allowing for integration of
severity measures into FTA, was developed and validated in this research. A detailed method
along with illustrated examples, an algorithm, and an intuitive FTA software prototype (with the
capability to conduct both traditional and new analyses) were generated. In addition, the new
method was validated by a case-based demonstration of method sensitivity and expert
evaluation. Usefulness ratings and cognitive workload for the CSP approach was found to be
significantly higher than that of the traditional approach while confidence level and perceived
exhibited a strong preference for the CSP approach and all perceived that the new approach
would have some impact on the traditional FTA measures. The project is expected to
significantly advance the existing FTA methodology for supporting fault risk analysis and safety
© Copyright 2019 By Mei Ying Lau
Development of a Severity Measure for Fault Tree Analysis and an Intuitive Fault Tree Analysis Software Prototype
by Mei Ying Lau
A dissertation submitted to the Graduate Faculty of North Carolina State University
in partial fulfillment of the requirements for the degree of
Doctor of Philosophy
Industrial Engineering
Raleigh, North Carolina 2019
APPROVED BY:
_______________________________ _______________________________
Dr. David Kaber Dr. Jing Feng
Committee Chair
_______________________________ _______________________________
ii
BIOGRAPHY
Mei Ying Lau obtained a Bachelors Degree from Illinois Institute of Technology with a
major in Biology and a minor in Psychology. She spent a year in the Human Factors Masters
Program at Embry-Riddle Aeronautical University. Prior to completion of her degree, she
transferred to North Carolina State University in hope of pursuing a Ph.D. She received her
Masters Degree from Industrial and System Engineering Program in North Carolina State
iii
ACKNOWLEDGEMENTS
There are a number of individuals who offered me the support and help necessary to
write this dissertation. I would like to express my appreciation and sincere thanks to all of them.
I would first like to express my gratitude to my advisor Dr. David Kaber for his constant
support and guidance throughout my research. He always managed to steer me in the right
direction whenever I sought his help. This project would never have attained this degree of depth
without his encouragement and guidance throughout the process. In addition, I would like to
thank Dr. Jing Feng, Dr. Karen Chen, and Dr. Russell King for serving on my committee. Their
inputs and expertise were highly valued and appreciated.
I would also like to thank the National Institute for Occupational Safety and Health
(NIOSH) for providing me the needed financial support through a NIOSH fellowship. Thanks to
all the Safety experts and Human Factors experts who participated in this research for their time
and efforts.
Finally, I must express my profound appreciation to my family including my parents and
brother for providing me with unfailing support and continuous encouragement throughout my
iv
TABLE OF CONTENTS
LIST OF TABLES ... vii
LIST OF FIGURES ... viii
1 Introduction ... 1
1.1 Overview of Fault Tree Analysis (FTA) ... 1
1.1.1 History and Definition ... 1
1.1.1.1 Static and Dynamic FTA ... 2
1.1.2 Fault Tree Structures ... 3
1.1.2.1 Event Types ... 3
1.1.2.2 Gate Types... 3
1.1.2.3 FT Construction Rules ... 4
1.1.3 Static Fault Tree Analysis Outputs ... 6
1.1.3.1 Cut Sets, Minimal Cut Set, and Single point failure ... 6
1.1.3.2 Cut Set Analytical Methods ... 7
1.1.3.2.1 MOCUS (Methods of Obtaining Cut Sets) or top-down reduction algorithm 7 1.1.3.2.2 Boolean algebraic reduction ... 9
1.1.3.2.3 Binary Decision Diagrams (BDDs) ... 10
1.1.3.3 Additional Uses of Cut Sets ... 12
1.1.3.3.1 Probability calculations ... 12
1.1.3.3.2 Common Cause Vulnerability & Probability ... 12
1.1.3.3.3 Importance & Rank ... 13
1.1.3.4 Success Trees and Path Sets ... 14
1.1.4 Extension to other analysis methods ... 16
1.1.5 FTA Methodology Limitations ... 17
1.2 Computer Application of FTA ... 20
1.2.1 FTA Software and Existing Software on Market ... 20
1.2.2 FTA User population ... 21
1.2.3 Preliminary FTA Software Assessment ... 22
1.2.3.1 Software Function Inventory ... 23
1.2.3.2 Software Usability Inventory ... 27
1.2.3.3 Software Composite Score ... 30
1.3 Research Motivation ... 31
2 Phase 1: Analytical Method Development and Demonstration ... 33
2.1 Method Description and Development ... 33
2.2 Analytical Procedure with Illustrated Example ... 35
Step 1 ... 36
Step 2 ... 36
Step 3 ... 37
Step 4 ... 38
Step 5 ... 39
2.2.1 Risk Identification and Assessment at Event Level ... 40
Step 6 ... 40
2.2.2 Identification of Major Contributors to Risks ... 43
Step 7 ... 43
v
Step 9 ... 46
Step 10 ... 47
Step 11 ... 48
Step 12 ... 49
Step 13 ... 50
2.3 Algorithm ... 52
2.4 Case Study Demonstration of Method Sensitivity ... 53
3 Phase 2: Empirical Validation ... 60
3.1 Validation Approach ... 60
3.2 Usability Analysis & Prototype development ... 61
3.2.1 Heuristic Evaluation... 61
3.2.1.1 Participants ... 62
3.2.1.2 Evaluation Procedure and Task ... 62
3.2.1.3 Results ... 62
3.2.2 Translation of Usability Issues into Design Features ... 65
3.2.3 Development of Software Prototype ... 67
3.3 Safety Expert Evaluation Experiment ... 67
3.3.1 Participant ... 67
3.3.2 Experimental Design ... 68
3.3.3 Task ... 69
3.3.4 Procedure ... 70
3.3.5 Data Analysis ... 71
4 Safety Expert Evaluation Results ... 72
4.1 Quantitative Responses ... 72
4.1.1 Cognitive Workload ... 72
4.1.2 System (Approach) Usability in Software ... 73
4.1.3 Perceived Usefulness ... 74
4.1.4 Perceived Confidence ... 74
4.1.5 Perceived Importance of FTA functions ... 75
4.2 Qualitative Responses ... 76
4.3 List of Expert Recommendations for Future Enhancement ... 76
5 Discussion ... 78
5.1 Result Discussion ... 78
5.2 Limitation ... 80
5.3 Application ... 82
5.4 Future Research and Direction ... 82
6 Conclusion ... 84
References ... 85
APPENDICES ... 88
Appendix A Software Function Table (Aside from FTA-specific functions) ... 89
Appendix B Tables of Software Violations on Usability Principles ... 90
Appendix C Algorithm... 92
Appendix D Heuristic Evaluation Worksheet ... 93
Appendix E Pre-trial Background Questionnaire ... 95
vi
Appendix G Post-task SUS Questionnaire ... 98
Appendix H Post-Trial Questionnaire: Expert Evaluation ... 99
Appendix I Software Cost Table ... 101
Appendix J CSL model from (Leung & R, 2017) ... 102
Appendix K Case Study: MOCUS procedure ... 103
Appendix L Usability Scores, Violations and Comments of Heuristic Principles ... 104
vii
LIST OF TABLES
Table 1-1 Event Types, Symbols, and Descriptions. ... 3
Table 1-2 Gate Types, Symbols, and Descriptions. ... 4
Table 1-3 Boolean Algebraic Laws. ... 10
Table 1-4 FTA Software Function Inventory Table... 26
Table 1-5 Usability Paradigms According to Dix et al (2004). ... 28
Table 1-6 Table of Usability Rating Categories... 29
Table 1-7 Usability Inventory for FTA Applications. ... 30
Table 1-8 Software Composite Score Table. ... 31
Table 2-1 Example of Risk Quantification at Levels of Outcome Severity... 35
Table 2-2 Example Severity Level Table ... 38
Table 2-3 Outcome Possibility Table ... 40
Table 2-4 Event Probability Table. ... 41
Table 2-5 MIL-STD-882E Mishap Risk Assessment Matrix along with Hazard Risk Index.43 Table 2-6 Cut-Set Importance Ranking Table. ... 48
Table 2-7 Initiator Associated Consequence Probability Table ... 49
Table 2-8 Initiator Importance Ranking Table ... 50
Table 2-9 Traditional Ranking Outcome. ... 51
Table 2-10 Case study of Traditional Importance outputs. ... 55
Table 2-11 Allowed Risk Table (from FAA), Safety Risk Assessment Matrix, and Tolerability Matrix (from ICAO) ... 56
Table 2-12 Case study Event-associated Risk Assessment Table... 57
Table 2-13 Case study Cut Set Consequence Probability Table ... 57
Table 2-14 Case study Initiator Consequence Probability Table ... 58
Table 3-1 Average Usability Scores Across Heuristic Principles ... 64
viii
LIST OF FIGURES
Figure 1-1 Fault Tree Example. ... 6
Figure 1-2 MOCUS Procedure. ... 9
Figure 1-3 Boolean Reduction Procedure. ... 10
Figure 1-4 Binary Decision Diagram (BDD) Procedure. ... 11
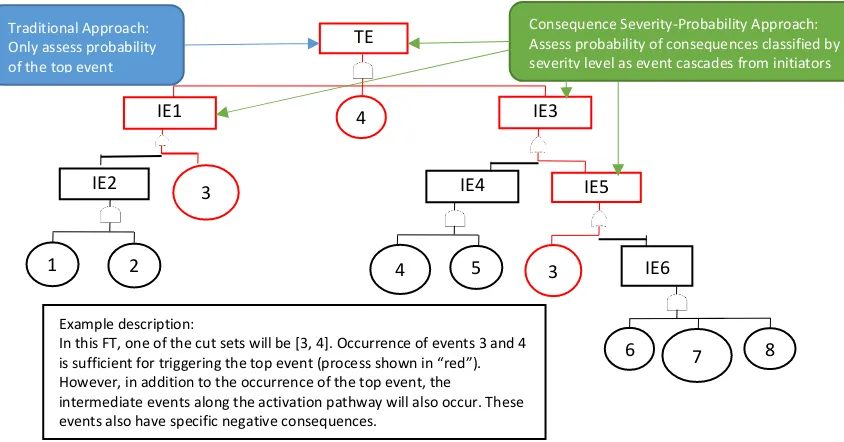
Figure 2-1 Difference between Traditional and Proposed Approach. ... 34
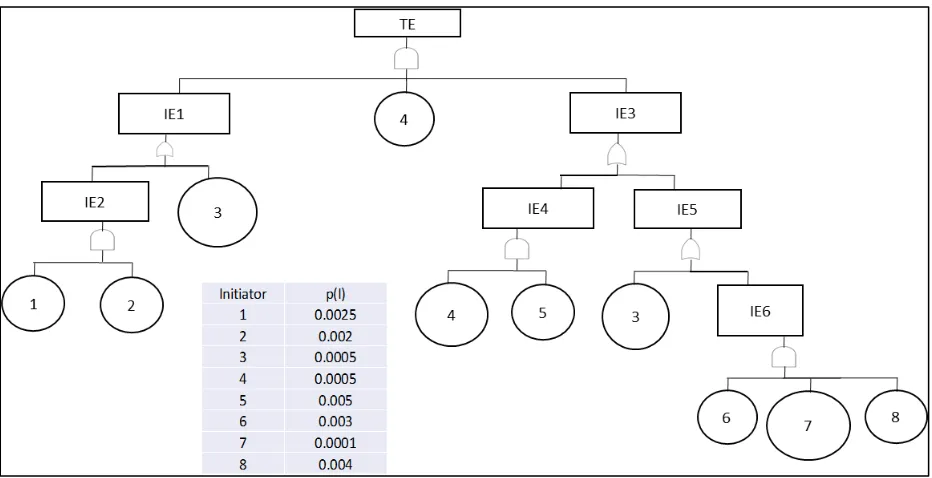
Figure 2-2 Fault Tree and Assignment of Probabilities to Initiators. ... 36
Figure 2-3 Outcome Probabilities Associated with Events Across Severity. ... 42
Figure 2-4 Event Risk Assessment Example. ... 43
Figure 2-5 Example of the Triggered Event Concept ... 45
Figure 2-6 Identification of Cut-Set Associated Events and Event Probability Tables ... 46
Figure 2-7 Calculation Process of Cut-Set Associated Consequence Probability Tables ... 47
Figure 2-8 Initiator Risk Assessment Example... 50
Figure 2-9 Summary of Algorithm for Consequence Severity Probability Determination. .. 53
Figure 2-10 Fault Tree derived from an existing CSL model (Leung & Rife, 2017) ... 54
Figure 3-1 Design Feature List. ... 66
Figure 4-1 Weighted TLX Rating Percentages Across Approaches... 73
Figure 4-2 Perceived Usefulness Ratings Across Approaches. ... 74
1
1 Introduction 1.1 Overview of Fault Tree Analysis (FTA)
1.1.1 History and Definition
Fault Tree Analysis (FTA) is a hazard analysis method developed in 1961 for U.S. Air Force by
Bell Telephone Laboratories for analysis of missile control systems. The method was later
expanded by Boeing Company in the area of aircraft manufacture. It became most wide-known
for applications in the nuclear industry since the investigation of the Three Mile Island reactor
meltdown in 1979. The first comprehensive FTA handbook was drafted by Willie in 1978,
updated in 1981 by Vesely et al. (for the US Nuclear Regulatory Commission), and revised yet
again with specification in aerospace applications by Stamatelatos et al. in 2002.
FTA is a system analysis method used to deduce potential events (causes) that can lead to
a particular undesirable outcome, such as explosion or other type of system failure. The method
assesses risks to a system by investigating cause and effect relationships, providing probabilities
of failures, identifying common causes, and providing details on single point failures; i.e.,
locations of exceptional vulnerability where one component failure may lead to failure of whole
system. FTA constructions identify system vulnerabilities and contribute to both design and
evaluation of countermeasures and possible redesigns.
FTA is applicable to any system that is composed of more than one event and interaction.
Unlike other system safety analysis, such Failure Modes and Effects Analysis (FMEA) or
Preliminary Hazard Analysis (PHA), which are often performed to identify all potential risks that
can be caused by a system, FTA only addresses one single undesirable event. However, FTA
offers more in-depth insights than other techniques by taking into consideration of the
2
identify what intermediate events lead to an unexpected disastrous event that has already
occurred.
FTA provides information about system components via risk or reliability calculations
for users to make informed decisions. While it is most often used retroactively, FTA can also be
applied during early design process before failure has a chance to occur. In order for FTA to be
applicable in the design process, the undesirable event must be foreseeable and tangible. To save
cost and time, FTA can be performed on the top one or two undesirable outcomes to ensure that
the worst will not happen during system performance. FTA is only accurate if all potentially
significant failure contributors are anticipated and considered. Thus, expert experiences and
inputs are particularly important in application of FTA before system implementation because
predictions of failure contributors are not as clear and factual as the those that contributed to a
failure that already occurred. However, in general, FTA is typically used as a reactive analysis
approach for identifying causality and corrective measures in response to critical or unexpected
hazards in system.
In the following subsections, a review is provided on specific types of FTA methods, the
structure and components of fault trees, rules for developing fault tree diagrams, and methods for
analysis and identification of critical events leading to a failure. Coverage is also provided on
methods for determining the importance of each event or a chain of events in a system failure.
This background is used a basis for identifying limitations of the FTA method and potential areas
for enhancement, particularly in terms of supporting risk assessment.
1.1.1.1 Static and Dynamic FTA
As FTA applications have expanded, two different types of FTA emerged, including: static
3
the timing of events (Čepin & Mavko, 2002). Additional analysis methodologies and
characteristics, such as time-dependent probabilities/risks and repair rates, are features of
dynamic fault trees. For the scope of this project, however, only applications of static fault trees
were examined.
1.1.2 Fault Tree Structures
1.1.2.1 Event Types
Events make up fault trees. The most basic fault tree includes one top event, a gate, and two
basic events. The more complicated the system and potential causes of the undesirable outcome
(top event), the larger the fault tree. An overview of various events, related symbols and their
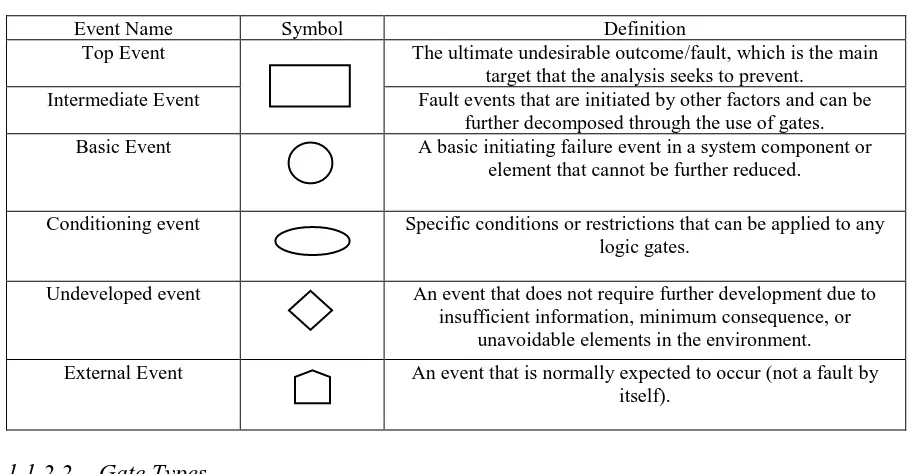
respective definitions is presented in Table 1-1.
Table 1-1 Event Types, Symbols, and Descriptions.
Event Name Symbol Definition
Top Event The ultimate undesirable outcome/fault, which is the main target that the analysis seeks to prevent.
Intermediate Event Fault events that are initiated by other factors and can be further decomposed through the use of gates. Basic Event A basic initiating failure event in a system component or
element that cannot be further reduced.
Conditioning event Specific conditions or restrictions that can be applied to any logic gates.
Undeveloped event An event that does not require further development due to insufficient information, minimum consequence, or
unavoidable elements in the environment. External Event An event that is normally expected to occur (not a fault by
itself).
1.1.2.2 Gate Types
Gates are used to connect events in a fault tree. Two basic types of fault tree gates are present
(the OR-gate and the AND-gate). All other gates are extensions or variations on these two basic
4
related symbols and their respective definitions is presented below in Table 1-2. With this
information on various gate types, it should be noted that the fault trees considered in this project
are coherent fault trees; that is, trees that only make use of AND/OR gates.
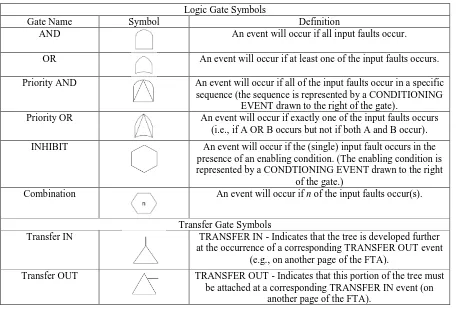
Table 1-2 Gate Types, Symbols, and Descriptions.
Logic Gate Symbols
Gate Name Symbol Definition
AND An event will occur if all input faults occur.
OR An event will occur if at least one of the input faults occurs. Priority AND An event will occur if all of the input faults occur in a specific
sequence (the sequence is represented by a CONDITIONING EVENT drawn to the right of the gate).
Priority OR An event will occur if exactly one of the input faults occurs (i.e., if A OR B occurs but not if both A and B occur). INHIBIT An event will occur if the (single) input fault occurs in the
presence of an enabling condition. (The enabling condition is represented by a CONDTIONING EVENT drawn to the right
of the gate.)
Combination An event will occur if n of the input faults occur(s).
Transfer Gate Symbols
Transfer IN TRANSFER IN - Indicates that the tree is developed further at the occurrence of a corresponding TRANSFER OUT event
(e.g., on another page of the FTA).
Transfer OUT TRANSFER OUT - Indicates that this portion of the tree must be attached at a corresponding TRANSFER IN event (on
another page of the FTA).
1.1.2.3 FT Construction Rules
Fault tree diagram construction procedures mainly involve defining a primary undesired event
and deducing immediate causes as well as the most basic, or primitive, causal events. There are
ground rules that are applicable to these procedures (Vesely et al., 1981; Stamatelatos et al.,
2002), including:
Ground Rule 1: Faults should be described in event boxes. The analyst should state
5
are all factors to consider in developing fault descriptions and adding events to a fault
tree.
Ground Rule 2: The analyst should consider the question, "Can this fault consist of a
component failure?". If the answer is "Yes", then the event should be classified as a
"state-of-component fault", add an OR-gate should be constructed below the event. The
analyst should identify primary failures that could produce the fault (i.e., failures that
occur within the operating parameters of design). The analyst should identify secondary
failures (i.e., failures that occur outside of operating parameters, such as excessive
environmental/operational stress). The analyst should also identify command failure
modes (or the absence of proper operation in context). If the answer to the component
failure question is "No", then the event is classified as a "state-of-system fault”. The
analyst needs to identify the minimum necessary and sufficient immediate cause(s). A
“state of system” fault event may require an AND-gate, an OR-gate, an INHIBIT-gate, or
possibly no gate at all.
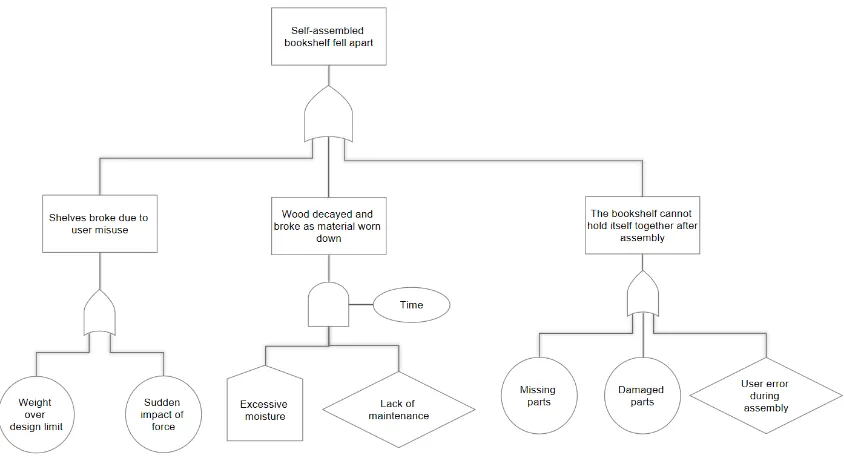
In addition to these ground rules, three additional rules are commonly used in fault tree
constructions. The first is the “No Miracles Rule”. All system components are assumed to be
normally functioning unless explicitly named in the fault tree. There are cases where the
cascading fault sequence may be unexpectedly stopped by a “miraculous failure” of another
component. However, analyst should not expect and rely on miracles to save a system. All
abnormal component states should be explicitly identified as another failure event in the fault
tree. The second common rule is “Complete-the-Gate Rule”. All inputs to a gate should be
completely defined before any further expansion of an event begins. That is, each level in the
6
“No Gate-to-Gate Rule”. Gate inputs should properly connect fault events but should never be
directly connected to other gates. Gates can only serve as inputs to an event and cannot replace
an event’s position under any circumstances. There must be an event between gates. An example
fault tree, reflecting application of these rules, is shown below in Figure 1-1.
Figure 1-1 Fault Tree Example.
1.1.3 Static Fault Tree Analysis Outputs
1.1.3.1 Cut Sets, Minimal Cut Set, and Single point failure
One of the most useful FTA outputs is cut sets. Cut sets (CS) are event lists of fault tree initiators
that, if all occur, will cause a top event. The larger the size of individual CS, the more events are
required to lead to the undesirable outcome and thus, the less vulnerable the system is to that
particular cut sets. (Several analytical methods that can yield cut sets are listed below in section
1.1.3.3.)
In FTA, cut sets typically undergo further manipulation to yield minimal cut sets (MCS).
Minimal cut sets are determined by eliminating redundant causes in a cut set, redundant cut sets
7
cut set plus other causes. Application of this process yields the minimal cut sets. Minimal cut
sets are the minimal events that, if they occur, would most definitely lead to a top event. Both CS
and MCS lists identify vulnerability points of a system and allow for allocation of resources to be
prioritized as targets for safety improvements.
In general, the number of CS and MCS lists tend to increase with the size of the fault tree.
A minimized version of a fault tree can be constructed based on the MCSs for easier
comprehension, visualization, and potential further analysis.
The most concerning form of a CS is comprised of single point failures. Single point
failures are events that, if they occur, will cause the top undesired event to occur. These are the
most vulnerable system failures that engineers must target to prevent accidents.
1.1.3.2 Cut Set Analytical Methods
A number of qualitative analysis algorithms have been introduced in history after the release of
the initial approach to cut set determination. The PREP method was developed in 1970 (Vesely
et al., 1981). This method has been replaced by other methods as time has progressed. Only three
of the most common and recent approaches (MOCUS, Boolean reduction, and BDD) will be
introduced in this proposal.
1.1.3.2.1 MOCUS (Methods of Obtaining Cut Sets) or top-down reduction algorithm
MOCUS was introduced in 1972 to replace PREP as a minimal cut set identifier (Vesely et al.,
1981). MOCUS operates in a top-down fashion with successive substitution of events into gates
in order to obtain "Boolean indicated cut sets" (BICS), also referred to as cut sets. If a tree
contains no replicated events, the cut sets for the tree represent MCSs. Otherwise, BICS resulting
8
obtain minimal cut sets. Unfortunately, only basic events are considered in this method but both
top and intermediate events are ignored.
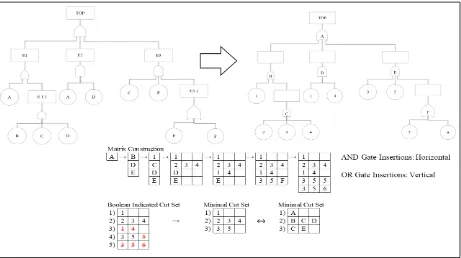
In applying MOCUS, unique identifiers are assigned to the elements of the fault tree,
including gates and initiators. The convention is for letters to be assigned to gates and for
numbers to be assigned to basic events or initiators. Numbers may be repeated with recurrences
of basic events in the system starting from the top event. After application of identifiers, a matrix
is constructed according to the following rules (also see Figure 1-2). “AND” gates appear as
horizontally organized letters in a MOCUS matrix. Identifiers for “OR” gates are organized
vertically in the MOCUS matrix. Once a matrix accounting for gates is complete, the gates are
substituted by the numbers (events) representing inputs to the gates. Letters for AND gates are
substituted horizontally by the numbered input while OR gate letters are substituted vertically
with the identified set of gate inputs. Each newly formed row resulting from OR gate
replacement carries-over all entries from the parent row. After all numerical substitutions have
been completed in the matrix, each row of the final matrix represents a Boolean indicated cut set.
An example of this procedure is presented in Figure 1-2. The particular analysis reveals a single
9
Figure 1-2 MOCUS Procedure.
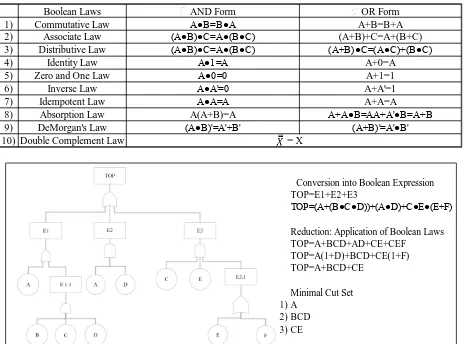
1.1.3.2.2 Boolean algebraic reduction
A fault tree can generally be considered as a logic diagram comprised of gates that connect
chains of faults from one to another. “AND” and “OR” gates represent the two most basic FTA
gates. The similarity between FTA gate functionality and Boolean operations allows Boolean
algebraic reduction to be applied as an approach for solving fault trees. There is a one-to-one
correspondence between the fault tree gate representation and Boolean algebraic symbol
representations. To be specific, the OR-gate is equivalent to the Boolean symbol “+” and the
AND-gate is equivalent to the Boolean symbol “•”. Fault trees can be translated into Boolean
equations, which can then be subjected to algebraic reduction until a minimal cut set is obtained.
The Boolean Laws facilitating expression reduction are shown in Table 1-3. An example is
provided below in Figure 1-3. An initial Boolean expression is developed for the top event. The
expression is expanded based on the presence of gates and inputs in the fault tree. Select Boolean
10
Table 1-3 Boolean Algebraic Laws.
Figure 1-3 Boolean Reduction Procedure.
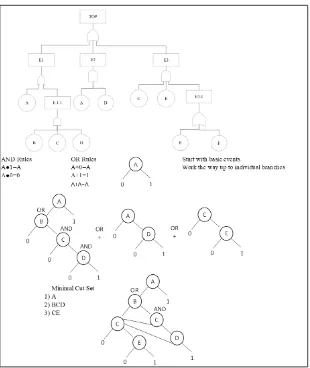
1.1.3.2.3 Binary Decision Diagrams (BDDs)
The Binary Decision Diagram method is a more recent analytical method in comparison to
MOCUS and Boolean algebraic reduction. The form of BDD used for FTA is referred to as
Reduced Ordered BDD and is a bottom-up approach that works directly with logical expressions
instead of cut sets (Stamatelatos et al., 2002). The BDD has been demonstrated to be effective in
application to “non-coherent” fault trees (i.e., fault trees that use or imply NOT gates) and large
FTA models through optimizing truncation/modularization techniques (Beeson & Andrews,
2003; Jung, Han & Ha, 2004; Deng, Wang & Guo, 2015). The BDD procedure begins at the
bottom of the fault tree with the basic events. Each basic event is associated with a single-node in
Boolean Laws AND Form OR Form
1) Commutative Law A●B=B●A A+B=B+A
2) Associate Law (A●B)●C=A●(B●C) (A+B)+C=A+(B+C)
3) Distributive Law (A●B)●C=A●(B●C) (A+B)●C=(A●C)+(B●C)
4) Identity Law A●1=A A+0=A
5) Zero and One Law A●0=0 A+1=1
6) Inverse Law A●A'=0 A+A'=1
7) Idempotent Law A●A=A A+A=A
8) Absorption Law A(A+B)=A A+A●B=A A+A'●B=A+B
9) DeMorgan's Law (A●B)'=A'+B' (A+B)'=A'●B'
10) Double Complement Law = X
Conversion into Boolean Expression TOP=E1+E2+E3
TOP=(A+(B●C●D))+(A●D)+C●E●(E+F)
Reduction: Application of Boolean Laws TOP=A+BCD+AD+CE+CEF
TOP=A(1+D)+BCD+CE(1+F) TOP=A+BCD+CE
Minimal Cut Set 1) A
11
a BDD. These BDDs are then combined following the logic of the gates with the guidance of the
Boolean laws defined in Table 1-3. Whichever event occurs first is identified as the root node
with the gate operation applied to the ‘children’ nodes (i.e., other subsequent events). Whenever
a redundant node representing the same event is found, one branch of the diagram can be
removed. Cut sets represent a set of nodes or events on a failure path that results in a perfect
likelihood of occurrence (1) of the top event. An example application of the procedure is shown
in Figure 1-4.
12
1.1.3.3 Additional Uses of Cut Sets
The usefulness of cut set extends beyond simple identification of causes that may lead to a top
event. Determination of cut sets can also be used to evaluate the probability of top events,
vulnerability to common causes and the importance of specific cut sets and initiators (basic
event) in a system failure.
1.1.3.3.1 Probability calculations
The probability of a top event in a fault tree is the calculated chance of the top undesirable event
occurring under current circumstances. Since cut sets represent groups of initiators that guarantee
the occurrence of a top event, given that all events in the set occur, the top event probability can
be calculated if the probabilities of basic events are known. In most cases, top event probability
is equivalent to the sum of the cut set probabilities. Individual cut set probability is determined as
the product (multiplication) of all the probabilities for initiators in the set. Likewise,
intermediate event probabilities can be calculated using the same approach.
1.1.3.3.2 Common Cause Vulnerability & Probability
Common cause failures (CCFs) are two or more component failures resulting from a common
cause. This type of failure is particularly important in that ignoring common cause susceptibility
of any system can lead to significant underestimation of top event probability, especially when
redundant identical components are used in system construction (Stamatelatos et al., 2002).
There are two ways to identify or account for CCF contributions in a fault tree. First, CCFs can
be added to a fault tree model as an additional initiator. For example, if component failure is a
basic event and it is possible that a common cause may lead to the failure, the initiator is
converted to an intermediate event, an OR gate is added below, and inputs are developed to
13
assigning unique letter subscripts to basic events that may be affected by common causes, such
as heat, moisture, maintenance, and human error. In such cases, causes of events vary and thus,
certain initiators may have multiple or no subscripts.
Common causes can be later examined in minimal cut sets. If events in a minimal cut set
have identical subscripts on all initiators, then the top event in the fault tree is vulnerable to
common causes. If at least two independent individual failures, associated with the same
common cause, appear in a cut set, the cut set should be marked and examined by an analyst
(Vrbanić, Košutić, Vuković & Šimić, 2003). Control recommendations and cause-specific
remedies should be applied to address such vulnerabilities.
The FTA probability model assumes that events are independent. However, if one failure
occurs that is associated with a common cause, it is likely that other related failures will occur.
The probability of each common cause should be analyzed and applied to the probability of
occurrence of each basic event in a fault tree, which may be susceptible to the common cause.
The top event probability can be calculated based on minimal cut set determination and
accounting for the likelihood of common causes. While this form of FTA was not further
explored in this project, the system sensitivity of a system to common causes can also be further
analyzed.
1.1.3.3.3 Importance & Rank
Importance and ranks of cut sets are useful tools for prioritizing system issues and identifying the
relative contribution of cut sets or specific events to top event probability. Several types of
common importance measures are available for Static Fault Tree Analysis, as summarized by
Cobo (1996), including Birnbuam’s structural importance, Risk Reduction Worth (RRW), Risk
14
importance measures, Birnbuam’s structural importance, RRW, and RAW all focus on
examining the importance of specific initiators to a top event. Variations in techniques involve
observing changes in top event probability by setting initiator failure probability to 0 (the system
always working) and/or 1 (a system certain to fail). The Fussell-Vesely (F-V) Importance
approach supports a wide range of applications and is capable of revealing the importance of a
cut set and initiators to top event probability. In this approach, the importance of a cut set (Ic) is
calculated by dividing the probability of the specific cut set by the top event probability (which is
assumed to be the equivalent of the sum of all cut set probability). Based on the resulting values,
cut sets can be ranked in terms of their importance. The higher the importance value, the higher
the rank (with the highest rank being “1”). The cut set ranked as first is the most problematic cut
set for the fault tree and system designers should prioritize the set for safety action. Based on the
calculated cut set importance values (Ic), individual initiator importance can be determined. The
probability values for each of the cut sets in which the initiator appears are added together. The
importance (Ie) for individual initiating events can then be obtained by dividing the probability
for the initiator by the top event probability. The calculated importance and rank of initiators
then allows for analysts to identify initiating events/components of a system that are particularly
at risk.
1.1.3.4 Success Trees and Path Sets
A fault tree can be easily transformed into its logical complement, a success tree (ST), which is
also called a dual tree or dual fault tree. While fault trees are useful for identifying vulnerabilities
in a system, success trees are useful for identifying factors that can guarantee prevention of a top
event disaster. The success tree focuses on how a system can succeed and is handy for trade-off
15
success tree, an analyst exchanges all the AND gates in a fault tree for OR gates and vice versa.
All events in the fault tree are then exchanged for their complement; that is, all fault inputs
would be exchanged for success inputs. The resulting tree will be the success tree.
Through implementation of success trees, path sets (also referred to as success sets) can
be obtained. A path set is the complement of a cut set. It is the set of fault tree initiators for
which the absence of occurrence guarantees that the top event cannot occur (Stamatelatos et al.,
2002). The cut set of the success tree are essentially the path set of the original fault tree. The
path sets can be generated by applying one of the cut set methods to the newly constructed
success tree. There is also an alternative way to obtain path sets bypassing the construction of the
success tree. If the minimal cut sets are determined for the original fault tree, the minimal path
sets can be generated by complementing the minimal cut sets using Boolean algebra, specifically
DeMorgan's theorem and other Boolean laws identified in Table 1-3. For example, if our
minimal cut set expression is T=A+B•C, the complement would be (A+B•C)`, which can be
converted to A`•(B•C)’ using DeMorgan’s theorem and subsequently converted to A`•(B`+C`)
with application of the same theorem. Applying the distributive law, the minimal path sets can be
identified from the following expression T=A`•B`+A`•C`. The minimal path sets of the fault tree
in this case would be A`•B` and A`•C`.
A path set, similar to a cut set, can be reduced to a minimal path set (i.e., the smallest
number of events for which the absence of occurrence will prevent the top event) by using the
same algorithm as is applied in obtaining a minimal cut set. The resulting minimal path set
identifies for an analyst the minimum necessary means to achieve success (i.e, ensuring safety by
guaranteeing non-occurrence of the top event). If any of the events within a path set occur,
16
path sets serving as a basis for identifying means by which to ensure system reliability and
prevent system failure, path sets also provide a bridge to Reliability Block Diagram construction
(mechanism explained below).
1.1.4 Extension to other analysis methods
Despite the usefulness of FTA, additional information and recommendations can often be
generated through use of other system analysis techniques. Some of these techniques can be
applied based on the FTA construction. Although the symbols and structures of various formal
diagrams may differ, most of the underlying logical constructs of a fault tree are interchangeable
with components of other cause and effect analysis techniques. Two complementary methods
that can be extended from FTA results include Event Trees and Reliability Block Diagrams.
In contrast to FTA, event tree analysis (ETA) is a bottom-up approach that starts with a
single initiator and expands to cover all potential consequences. While the two approaches may
appear to be completely opposite at first glance, an event tree is actually similar to a Binary
Decision Diagram (BDD), which is one approach to FTA that was covered earlier. Related to
this, ETA branching structures can be represented using fault tree events. The top event
probability in a FTA is also often exported as a branch probability in an ETA. One challenge
analysts should be aware of in developing event trees is the need for chronological ordering of
events. Static fault trees often only examine a group of events that occur, and thus, lack
time-related properties representing sequential event relationships, as presented in an ETA. In general,
the judgment of an analyst is important to model an ET based on a FT and to ensure that events
are presented in a logical manner.
Fault trees and reliability block diagrams (RBDs) are both analytical logic-based methods
17
While the symbols and structures of the two diagram types may appear to differ, many of the
features of each diagram are based on the same logic. RBDs represent successful pathways to
system operation based on components function. Thus, fault trees can simulate a corresponding
RBD based on the manipulation of cut sets and path sets. Each path set represents a successful
left to right path through a RBD while cut sets represent the set of events in a RBD interrupt all
success paths.
1.1.5 FTA Methodology Limitations
Despite the usefulness of FTA, there are some disadvantages of the method by comparison with
other safety analysis methods that facilitate risk assessment. Fault tree analysis targets a single
foreseeable outcome and requires extensive knowledge of a system, as well as expert time and
effort. Furthermore, the FTA approach only assesses the probability of a top event and the
importance of initiating events or cut sets relative to the occurrence of the top event. In other
words, the risk assessment as part of FTA is limited to the probability of event occurrence but
does not account for the severity of outcomes.
In general, hazard risks are quantified using the following equation:
Risk (consequence/time) = Frequency (events/time) * Severity (consequence/event) (1) Unlike other safety analysis techniques including FMEA (Failure Mode and Effects Analysis),
PHA (Preliminary Hazard Analysis), ETA (Event Tree Analysis) and more, FTA is the only
method that does not assess the severity of outcomes of hazard exposure. Severity is not
examined as part of FTA because the focus is on prevention of a single “consequence”, the top
event. However, multiple system faults (intermediate events) are typically encoded in a fault tree
and each event may result in negative consequences. Unfortunately, the current approaches to
18
To further examine this limitation of FTA, an additional literature review was conducted
using the Summon Database with the keyword search phrase of [fault tree analysis AND severity
AND ("cut set" OR "initiator") AND ("importance" OR "ranking")]. Articles were required to be
available online and peer-reviewed for consideration in the review process. The initial search
yielded 112 articles. The focus of the review was on identification of methods supporting
evaluation of consequences of severity within the structure of FTA. Any studies that made use of
severity evaluations prior to, or after, FTA by employing other safety analysis methods were not
considered relevant. Consequently, any studies presenting the application and/or integration of
multiple safety analysis techniques to evaluate hazard exposures were excluded. With these
inclusion and exclusion criteria, only one study emerged as being relevant to the search (Lindhe,
Rosén, Norberg & Bergstedt, 2009).
Lindhe et al. (2009) study incorporated consideration of the consequence or severity of
hazard exposure events within the scope of FTA. Their analysis involved a dynamic fault tree
with hazard risk calculated by means of Monte Carlo simulation. They also identified the
possibility of further investigation of risk reduction options through Bayesian analysis or risk
matrices, but no application was presented in their paper. It should be noted that the Lindhe et al.
assessment approach was quantitative but case specific (i.e., lost customer time). The authors
considered the duration of a system failure and the number of persons affected as measures for
quantifying the level of hazard risk. The consequences of intermediate events in their fault tree
were limited to consequences that could result from the top event. That is, any intermediate event
was not identified as having unique outcomes relative to the top event. Furthermore, risks were
only determined for sub-systems; that is, any intermediate events directly beneath the top event,
19
limited in terms of consequence attributes and number of intermediate events that were
considered.
Aside from this specific literature search, another article describing the development of
risk assessment techniques was also reviewed (Khan, Rathnayaka & Ahmed, 2015). This article
pointed to a lack of consideration of event severity as part of FTA. This limitation of FTA is
typically addressed by analysts making use of other safety analysis techniques, including but not
limited to FMEA, ETA, PRA, Cause-Consequence analysis (CCA), Bow-tie analysis (BTA),
Bayesian Network analysis (BNA), and Evidential Reasoning (ER) approaches. These methods
can make use of FTA outputs (such as minimal cut sets (MCS) or the probability of a top event)
and support evaluation of the severity of specific hazard exposure. The FTA technique alone,
however, does not examine event or consequence severity.
Based on this research, there is an absence of a systematic and structured approach to
accounting for the severity of hazard consequences as part of FTA. The goal of FTA is focused
on prevention of a single top event. In the context of FTA, the concept of risk refers to the extent
to which a basic event or cut set contributes to the likelihood of a top event. Therefore, FTA can
often be interpreted as limited in scope in comparison to other safety analysis techniques.
Substantial time and effort are required to evaluate a single negative system outcome, which
must also be foreseeable by the analyst; however, the method does not provide a basis for
severity analysis and by extension, actual risk assessment. Having said this, the construction of a
fault tree, leading up to the targeted catastrophic top event, is generally defined by cascading
intermediate events. While often overlooked by analysts, most of these intermediate events also
20
into consideration in FTA. With this in mind, the present work seeks to expand the scope of FTA
in terms of negative outcomes of intermediate events and evaluation of severity of consequences.
The following sections present a review of existing electronic software tools for applying
FTA. This market survey is intended to further establish the absence of tools for assessing the
severity of event outcomes/consequences as part of FTA applications. The review also serves to
identify superior tools that may provide a platform for an applied extension of the FTA
methodology.
1.2 Computer Application of FTA
1.2.1 FTA Software and Existing Software on Market
While Fault Tree Analysis can be performed by manual calculations with pencil and paper, the
analyst workload of hand-construction of fault trees and performing analyses can be cumbersome
and laborious, especially in cases where the fault tree has many branches. FTA software
applications have been developed to minimize analyst workload. These applications are
particularly useful when analyzing large and complex fault trees. They are also useful for
detection of analysis errors that analysts can easily overlook during hand-calculations. Many
packages also provide fault tree validation support for novice users in form of error feedback.
In general, FTA software applications have two main functions: (1) fault tree graph
construction; and (2) FTA computations to yield various outputs (e.g., cut sets). A specific online
search of software applications with the keywords “fault tree analysis” revealed 13 major
commercially available FTA software packages on the market that provide different degrees of
function fulfillment. FTA programs that can be found online include FaultTree+ (Reliability
workbench), Windchill FTA, Relyence Fault Tree, TopEvent FTA 2017 Professional, Fault Tree
21
Microsoft Visio, SmartDraw, and Edraw. A table of these software applications and related
license expenses are shown in Appendix I. All of these applications were reviewed regarding
their functionality as well as usability.
1.2.2 FTA User population
As previously mentioned, FTA is a technique used to identify causes of failure, vulnerabilities,
and/or reliability of systems. While a fault tree diagram can be developed for almost any type of
situation leading to undesirable outcomes, its use is mainly focused in area of safety engineering.
There are many well-known examples of FTA being applied after accidents have occurred for
cause analysis and prevention of future accidents. There are also many examples of FTA being
used during product development and/or implementation to minimize the likelihood of the most
disastrous anticipated outcome. In other words, FTA is applicable to prospective system analysis
at the design stage, existing active system analysis, and system post-disaster analysis. As long as
there are identifiable system elements for analysis, FTA can be used to identify system
vulnerabilities and root causes of a particular disaster.
Fault tree analysis may have a wide field of application but analysts that make use of the
approach represent a relatively small community of safety professionals with various levels of
expertise. Safety professionals may come from various backgrounds including designers,
engineers, investigators and various field experts, whose job descriptions include system safety
inspections. The present assessment of current FTA software applications takes into
consideration all potential user types, from the inexperienced novices that only know basic FTA
rules to practiced safety professional with years of application experience. Based on the stage of
system development and/or implementation, as well as the level of user expertise, the particular
22
investigator may emphasize the need for detection of primary contributors and top-event
probability reduction. Whereas, the focus of analysis for a product/system designer may be on
reducing the potential of a negative consequence of the top-event, as much as possible, given
limited resources. On the other hand, a system evaluator that handles system maintenance or
evaluation of new technology purchases may want to focus a FTA on ways to keep a system
running (success tree) or identification of common cause failures (vulnerabilities) in the system.
In summary, different users may approach FTA with different intentions and levels of expertise;
however, it is important for FTA tools to meet the needs of various users, including facilitation
of hazard severity assessments.
1.2.3 Preliminary FTA Software Assessment
Given the diversity of the potential user population and corresponding needs, this section focuses
on identifying a superior software application that addresses the range of FTA methods and is
usable in nature. A preliminary software assessment is conducted on the 13 commercially
available FTA software programs currently available on the market.
To evaluate the features of these programs, a function inventory table was developed.
Those software programs found to address the majority of user needs were then examined from a
usability perspective, including an inventory of usability features, based on identified usability
paradigms. Finally, a composite “score” was generated for each application based on the
FTA-essential function inventory and application usability ratings. Using this composite score, the
currently available applications were compared. The FTA application satisfying the most user
needs and providing the most usable access of features was identified as the superior market
23
1.2.3.1 Software Function Inventory
A function inventory was developed to assess the functional capabilities of the commercial FTA
software programs. The inventory was used to identify a superior platform for development of
the prototype FTA software. Although dynamic fault tree functionalities may be present in some
specific programs, due to the scope of the present project, these functions were not examined. As
a basis for the functional assessment of current commercial FTA programs, three broad
categories of desirable static FTA functions were identified. These categories included: (1) fault
tree construction; (2) fault tree analysis; and (3) extension of results to other analyses. Due to
page size limitations, this table has been divided into three sections. The section presenting the
inventory of FTA functions, which is directly relevant to the present study, is shown in Table
1-4. The other two sections of the table are presented in Appendix A.
As users seek to construct a fault tree, it is expected that an application will provide tools
for accurate representation of events and gates and that the user will be able to manipulate the
event/gate positions in a tree. These specific application features were identified and inspected
when each existing application was used for constructing a fault tree. Certain applications
provide additional features that allow for display of a fault tree in a table format and
addition/manipulation of event/gate properties directly in the table. Consequently, these features
also became points of analysis in FT construction. The capabilities of the software application to
support extensions of FTA (as identified in Section 1.1.4) were also analyzed. The table
presented in Appendix A lists these extensions.
With respect to the FTA category of desired functions, all of the static fault tree analysis
24
for inspection were the availability of different methods for obtaining cut sets and the
transparency of application processes (i.e., whether users can inspect a calculation, if so desired).
In order to investigate the available functions of a software package, a common task of
building a specific fault tree and obtaining all possible static fault tree analysis outputs was
systematically performed with each of the programs to test for availability of individual features.
Individual application capabilities to transfer FTA results to other analysis methods were noted
in the function inventory table along with detailed notes/critiques on application features (see
Appendix A).
Of the 13 FTA products on the market, three applications (Microsoft Visio, SmartDraw,
and Edraw) were found to be only simple graphing tools with no analysis capabilities. The
software programs including EMFTA and Fault tree analyser took went a step further than
graphing but only included limited computation capabilities for cut set determination and
generation of probabilities. Consequently, only eight of the 13 FTA products on market were
found to satisfy (to some degree) the advanced set of static FTA computational capabilities.
Among these eight products, a common issue was found in accurate representation of events as
part of fault trees. In these products, intermediate events are merged with gates; that is,
intermediate events are treated as descriptions at a gate rather than stand-alone, independent
events. This form of representation is often counter to experienced user mental models.
Furthermore, the representation suggests gate-to-gate connections, which violates the
fundamental FTA rule of ‘no gate to gate connections’. The offending feature is most likely
present in commercial FTA software applications for ease of computation from a programming
standpoint. Other various issues were encountered during performance of the use-case scenario,
25
Unfortunately, none of the identified software applications were found to support all of
the desired FTA functions. As the primary objective of FTA is to generate outputs that can be
used to identify pathways to a top-event as well as the likelihood of the event, emphasis was
placed on this particular category as part of the functional evaluation of the software packages. A
total of nine desired FTA functions were identified. Among these, three functions were identified
as being less common among applications. These included (calculation) transparency, multiple
cut set methods, and Success Tree (Path set) output. Among the 13 candidate applications, only
two packages supported these functions. In order to accelerate the evaluation process, the
candidate applications were evaluated in terms of the number of satisfied FTA functions with the
expectation of fulfilling at least six functions. Any application with six or more available FTA
functions (from the list of nine) was considered as being capable of satisfying most user needs.
Consequently, these applications were further analyzed in terms of performance and usability. As
a result of the functional analysis, only four applications proceeded to the usability evaluation
26
Table 1-4 FTA Software Function Inventory Table.
Event Probability Input Top Event Probability calculation Common Cause Vulnerability
Minimal cut set (MCS) Output
Transparency (Option to Display Process)
Multiple cut set
method Importance
Ranking by Importance
Success Tree (Path Set) Output
TopEvent FTA 2017
Professional Y Y N Y N Y Y Y N 6
PTC Windchill Quality
Solutions ver. 11 Y Y Y Y N N Y N N 5
FaultTree+ (Reliability
workbench) Y Y Y Y N N Y Y Y 7
Relyence Fault Tree Y Y N Y N N Y Y N 5
RAM commander FTA Y Y Y Y N N Y Y N 6
ITEM ToolKit › Fault Tree Y Y Y Y N N Y Y Y 7
BlockSim (reliasoft-synthesis
11) Y Y N Y N N N N N 3
EMFTA Y Y N Y N N N N N 3
Fault tree analyser Y Y N Y N N N N N 3
Microsoft Visio N N N N N N N N N 0
SmartDraw N N N N N N N N N 0
Edraw N N N N N N N N N 0
Software
Total Available FTA-specific
27
1.2.3.2 Software Usability Inventory
During the design of FTA software applications, many functional capabilities may be taken into
consideration; however, current interface design suggest that consideration of usability features
is less common. During the functional analysis, and execution of the use-case scenario, use of
application functions beyond graphing was at times, not intuitive and unnecessarily complicated.
Some functions require users to rely heavily on manuals or help functions. Certain functions
were hard to use even with the aid of the user manual, indicating a lack of user support. It may be
the case that the design of some programs was targeted at safety expert, but many features of
these applications are simply not user friendly for novices. In order to further investigate these
potential application usability issues, a structured usability assessment was conducted.
The four software programs (TopEvent FTA 2017 Professional, FaultTree+ within
Reliability workbench, RAM commander FTA, and Fault Tree module within ITEM ToolKit)
that were identified to contain most of the desired FTA functionalities were submitted to a
preliminary usability assessment. The usability paradigms and principles described by Dix,
Finlay, Abowd, and Beale (2004) were used as inspection guidelines. According to Dix et al.,
there are three main usability paradigms, including: learnability, flexibility, and robustness.
Learnability measures how easily novice users can learn to effectively navigate and interact with
a system. Flexibility examines the different information and interaction pathways between the
user and system. Lastly, robustness views the level of support provided to the user to achieve a
desired goal. Each category contains individual principles. The list of principles and
28
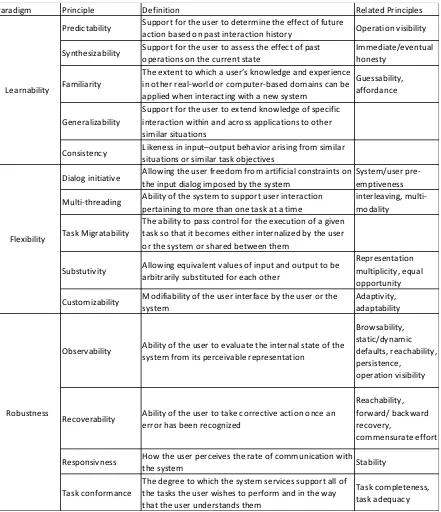
Table 1-5 Usability Paradigms According to Dix et al (2004).
The FTA software applications were evaluated in terms of the identified usability
paradigms, in general, and violations of the specific usability principles. Appendix B presents
tables of the individual application violations of usability principles. A Likert scale from 1 to 5
(see Table 1-6) was used for rating the degree of violation of each principle by the severity of
Paradigm Principle Definition Related Principles
Predictability Support for the user to determine the effect of future
action based on past interaction history Operation visibility Synthesizability Support for the user to assess the effect of past
operations on the current state
Immediate/eventual honesty
Familiarity
The extent to which a user’s knowledge and experience in other real-world or computer-based domains can be applied when interacting with a new system
Guessability, affordance
Generalizability
Support for the user to extend knowledge of specific interaction within and across applications to other similar situations
Consistency Likeness in input–output behavior arising from similar situations or similar task objectives
Dialog initiative Allowing the user freedom from artificial constraints on the input dialog imposed by the system
System/user pre-emptiveness Multi-threading Ability of the system to support user interaction
pertaining to more than one task at a time
interleaving, multi-modality
Task Migratability
The ability to pass control for the execution of a given task so that it becomes either internalized by the user or the system or shared between them
Substutivity Allowing equivalent values of input and output to be arbitrarily substituted for each other
Representation multiplicity, equal opportunity Customizability Modifiability of the user interface by the user or the
system
Adaptivity, adaptability
Observability Ability of the user to evaluate the internal state of the system from its perceivable representation
Browsability, static/dynamic defaults, reachability, persistence,
operation visibility
Recoverability Ability of the user to take corrective action once an error has been recognized
Reachability, forward/ backward recovery,
commensurate effort
Responsivness How the user perceives the rate of communication with
the system Stability
Task conformance
The degree to which the system services support all of the tasks the user wishes to perform and in the way that the user understands them
Task completeness, task adequacy Robustness
29
usability problems (Dix et al., 2004). Factors such as perceived severity of problems, problem
frequency, as well as the effort needed to overcome a problem, were all taken into consideration
in judging the level of principle violations (Dix et al, 2004).
Table 1-6 Table of Usability Rating Categories.
Rating Categories Evaluation criteria
1 Usability Catastrophic; imperative to fix before release
Severe issue that cannot be overcome by effort and prevent success task completion or
increase possibility of error
2 Major usability problem Considerable effort needed to overcome issue
3 Minor usability problem Common issue that can be overcome with a
little effort
4 Cosmetic problem only Minor cosmetic issues that does not directly
impact task performance 5 I don't agree that this is a usability problem at all No usability problem
A total usability score was generated for each software application based on the usability
principle ratings. A total of 70 points were possible for the 14 identified usability principles. The
greater the degree of application violation of individual usability principles, the lower the overall
usability score. An average usability rating across principles (total rating/number of principles)
was also calculated along with a percentage of adherence to usability principles (total rating/total
possible score).
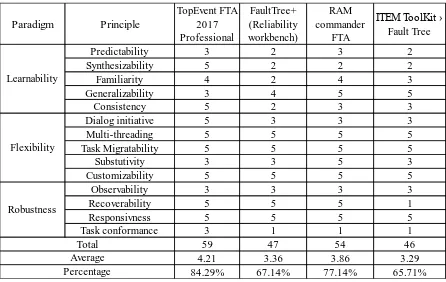
Table 1-7 presents a summary of the usability analysis for the FTA applications,
according to the identified paradigms and principles. The FTA software application TopEvent
FTA 2017 Professional was identified as the most usable software with a total score of 59 and
84.29% adherence to the identified usability principles. On average, this application had a
usability rating of approximately 4.2. This average rating exceeded the usability ratings of the
30
Table 1-7 Usability Inventory for FTA Applications.
1.2.3.3 Software Composite Score
The last step of the FTA software assessment involved determining a common composite score
that could be used for comparison of programs. The main factors in the composite score were the
usability scores and the number of available FTA functions. The score was generated with the
following equation:
Composite score = Average usability score * Number of available FTA functions (2)
The resulting scores are presented in Table 1-8. According to the results presented in Table 1-8,
TopEvent FTA 2017 Professional was rated as the leading software that has most of the
user-desired function and highest usability rating.
Paradigm Principle TopEvent FTA 2017 Professional FaultTree+ (Reliability workbench) RAM commander FTA
ITEM ToolKit › Fault Tree
Predictability 3 2 3 2
Synthesizability 5 2 2 2
Familiarity 4 2 4 3
Generalizability 3 4 5 5
Consistency 5 2 3 3
Dialog initiative 5 3 3 3
Multi-threading 5 5 5 5
Task Migratability 5 5 5 5
Substutivity 3 3 5 3
Customizability 5 5 5 5
Observability 3 3 3 3
Recoverability 5 5 5 1
Responsivness 5 5 5 5
Task conformance 3 1 1 1
59 47 54 46
4.21 3.36 3.86 3.29
84.29% 67.14% 77.14% 65.71%
31
Table 1-8 Software Composite Score Table.
ID Software
Average Usability Score Across Principles
Available FTA Essential Functions
Composite Score of Software
1 TopEvent FTA 2017 Professional 4.21 6 25.29
2 FaultTree+ (Reliability workbench) 3.36 7 23.50
3 RAM commander FTA 3.86 6 23.14
4 ITEM ToolKit › Fault Tree 3.29 7 23.00
1.3 Research Motivation
Based on the limitations of Static FTA identified through literature review, as well as the
analysis on available functions of commercial FTA software applications, it was concluded that
there is an absence of tools and applications for assessing hazard severity as part of FTA.
Methodological consideration of consequence severity in FTA is practically non-existent in both
the literature or commercially available software packages. There is a need to develop a
structural method that researchers and analysts can use to account for severity of event
consequences as part of FTA.
The proposed project is focused on the introduction of a novel structured approach to
examination of the probability of consequences occurring at specific levels of severity within a
FTA application. The goal of the project is to broaden the scope of FTA and allow for a more
reliable and sensitive way to prioritize allocation of safety engineering resources to risky
fault-inducing system events.
The project is divided into two phases with each addressing a different major objective.
Phase I focuses on analytical method development and demonstration (a numerical example).
Phase II is focused on empirical validation of an extension of FTA as implemented through a
software prototype. In the first phase, the new approach to event severity assessment, as part of
32
various event risks is presented based on existing case data. The second phase of the project
builds on this basis and seeks to validate the approach through an experiment involving expert
evaluation of the methodology. The leading FTA software application, as identified in Section
1.2.3.3, was used as a foundation for developing a prototype to present the new severity