EFFECT OF LOADING RATE ON DUCTILE-BRITTLE TRANSITION
TEMPERATURE BY REFERENCE TEMPERATURE (
T
0) AND MASTER
CURVE APPROACH FOR A MODIFIED 9Cr-1Mo STEEL
A. Moitra, S. Sathyanarayanan, G. Sasikala, A. K. Bhaduri Materials Technology Division,
Indira Gandhi Centre for Atomic Research, Kalpakkam, Tamilnadu, INDIA-603102 E-mail of corresponding author: [email protected]
ABSTRACT
Towards evaluation of the ductile to brittle transition temperature (DBTT) of ferritic steels, the ASTM E 1921 based reference temperature (T0) and the associate Master Curve approach have now been widely recognized,
however, till date the standard restricts itself to static/quasi-static loading rates. It is well recognized that the flow stress of rate sensitive material increases with the strain rate and thus it is imperative that the increase in loading rate would lead to limited plasticity induced brittleness, reflected in higher T0. There have been efforts in literature for
developing empirical correlations to derive T0 at higher loading rates from T0 at quasi static loading rates or vice
versa. The loading rate is often expressed in terms of stress intensity factor rate (dK/dt), with unit MPa√m s-1. dK/dt
is approximately equal to 104-105 MPa√m s-1 for low velocity tests at 1-2 ms-1 and dK/dt ~ 106 MPa√m s-1 for
normal velocity impact tests at ~5 ms-1. There is a need to experimentally validate the extent of change in T 0 with
higher loading rates, especially for the 9Cr-1Mo family of steels, proposed to be used as wrapper material in the upcoming commercial liquid sodium cooled fast breeder reactors. The present study is directed towards determining
T0 for modified 9Cr-1Mo steel at loading rates of 1.12, 3 and 5 m/s.
The material under dynamic loading actually is subjected to a series of forward and reflective stress waves, at least in the initial part of the loading, observed as high frequency oscillations in the time or load-displacement traces. Thus for determining the dynamic fracture toughness of materials the inertia effect on the fracture load determination is very important in data analysis, especially for higher loading rates and/or for brittle materials. The amplitudes of the consecutive oscillations are expected to die down with time after the impact and considered negligible after a period of 2τ -3τ, where τ is the period of inertial oscillation, a function of specimen type and geometry and speed of sound through this material. The time period, τ, is taken as 27 μs for the present campaign, implying that after 3τ i.e. 81 μs, all the measured fracture loads are free from any inertial effects. However, at a lower loading rate, i.e ~ 1 m/s, the amplitude of the oscillations are negligible. Thus the time to fracture (tf) with respect to the 2τ -3τ time span is an important parameter, especially for the loading rates of 3 and 5
m/s, in ensuring the accuracy of the fracture load determination for evaluating the dynamic fracture toughness. It is observed that the time to fracture (tf) for the loading rate of 3 m/s has exceeded the 3τ time span for all the
specimens, the minimum being 100 μs, where as a few specimens for the loading rate of 5 m/s have failed to meet this criteria. Here it is observed that out of eight specimens tested at different temperatures ranging from −25 to 30 °C, four specimens are at the border line of 2τ-3τ regime and one specimen with tf = 10 μs fails to qualify even for
consideration. An alternative analytical technique has been used to derive the fracture load for those specimens.
T0 values determined were 8.8 and 11.2 °C for the loading rates of 1.12 and 3 m/s respectively, and increases
drastically to 26.2 °C for a loading rate of 5 m/s. This shift is little higher than that predicted empirically (~14 °C) for conventional pressure vessel steels.
INTRODUCTION
Towards evaluation of the ductile to brittle transition temperature (DBTT) of ferritic steels, the ASTM E 1921[1] based reference temperature (T0) and the associate Master Curve approach has now been widely recognized,
however, till date the standard restricts itself within the purview of static to quasi-static loading rates. It is well recognized that the flow stress of the rate sensitive material increases with the strain rate and thus it is imperative that the increase in loading rate would lead to limited plasticity induced brittleness, reflected in higher T0. To this
end, there have been efforts for developing empirical correlations to derive T0 for higher loading rates from
experimentally obtained T0 at a quasi static loading rate. Wallin in 1997 [2] and Wallin and Planman in 2001 [3] had
dK/dt is approximately equal to 104-105 MPa√m s-1 for low velocity tests at 1-2 ms-1 and dK/dt ~ 106 MPa√m s-1 for
normal velocity impact tests at ~5 ms-1. In another effort, Yoon et al. in 2001 [4] also have proposed a few empirical
correlations based on dK/dt. Amongst various equations proposed by Yoon et al., the following represent the highest and the lowest values respectively:
For A515 steel, T0 = 6.1 ln (dK/dt) 18 (1)
For A533B weld, T0 = 2.7 ln (dK/dt) 87 (2)
In a more generalised form, Schindler et al. in 1995 [5] have proposed the following equation for the shift in
T0, associated with the change in test velocity or the stress intensity factor rate as:
(22 0.016 )log ref (22 0.016 )log ref
y y
test test
K V
T
K V
(3)
where y is the yield stress at the test temperature/strain rate. Applicability of these equations in predicting T0 at
higher loading rates has been verified by Moitra in 2003 [6] and Moitra et al. in 2005 [7], while evaluating the DBTT for plain 9Cr-1Mo steel, with tempered martensitic microstructure. From the eqn. 1 & 2, for tests at 1.12 and 5.12 m/s, the T0 yielded a shift of 14 and 6.2 °C respectively. However, eqn.3 showed a shift of ~ 7 °C based on the
stress intensity based calculation and 7.5 °C based on velocity based estimation. However, experimental
determination of the shift in T0 with higher loading rates has been awaiting for these class of steels, proposed to be
used as wrapper material in the upcoming commercial liquid sodium cooled fast breeder reactors. This effort has been directed towards filling up that gap with a Mod.9Cr-1Mo steel.
MATERIAL AND EXPERIMENTAL
The material under investigation is an Modified 9Cr-1Mo steel, with chemical composition of C-0.12, Mn-0.38, P-0.02, S-0.007, Si-0.47, Cr-9.42, Mo-1.0, Ni-0.13, Al-0.021, Nb-0.1, V-0.25, N-0.068, Fe-balance. The material in normalized and tempered condition possess a tempered martensitic structure.
The test protocol to evaluate T0 under loading rate of 1.12 ms-1 (referred as T0dy) using instrumented Charpy
impact test with pre cracked Charpy specimens has been discussed in detail in few of the publications by Moitra et al. [6,7] and Sathyanarayanan et al [8] for 9Cr-1Mo steel and Mod.9Cr-1Mo steel respectively. The present campaign with test velocities 3 ms-1 and 5 ms-1 have been carried out in the Accelerated Drop Weight Testing
Machine, newly installed at IGCAR, Kalpakkam. The usual steps to derive the T0dy have been the same as followed
for the loading rate of 1.12 m/s.
RESULTS AND DISCUSSION
The concept of evaluation of ductile to brittle transition temperature via reference temperature approach can be summarized as a macroscopic engineering conclusion derived from local events in microstructural scale. The significant premises on which the concept is based upon can be pointed as, firstly, it appreciates the application of fracture mechanics concepts in terms of elastic-plastic assessment of the fracture toughness of the material under investigation, secondly, it takes into account the inherent scatter in fracture toughness originating from the variation of the energy involved in the crack initiation process owing to the difference in size, shape and orientation of the randomly distributed carbides at the process zone. It is meaningfully assumed that the crack initiation leading to a cleavage crack has occurred at the weakest points, referred as the ‘the weakest link’ and the scatter is explained by an extreme value statistical model, the Weibull distribution.
matrix surrounding the carbide is expected to play a dominant role in determining the fracture toughness of these classes of materials. As the loading rate increases, the local strain rate also simultaneously increases leading to a higher flow stress for a rate sensitive material. This in turn would lead to difficulties for the matrix surrounding the carbide to be strained, thus preventing the buildup stress around the carbide to be relaxed, and paving the way for an easier crack initiation by decohesion of the carbide-matrix interface. Contrary to the plain 9Cr-1Mo steel, for the modified 9Cr-1Mo under present investigation, the crack initiation mechanism has been identified as the grain boundary embrittlement by Sathyanarayanan et al. in 2008 [8]. Here also the restriction of local plasticity imposed by higher loading rate is expected to raise the level of local stress buildup and ease the crack initiation process by decohesion of the boundaries. In this connection it may be recalled that though there is a synergy for the influence of higher loading rate on both the crack initiation mechanisms, the overall fracture toughness at a temperature for the latter has been observed to be lower at the loading rate of 1.12 m.s-1 as the stress required for grain boundary
decohesion (~ 1600-1800 MPa) is much lower than the stress required for cracbide-matrix decohesion (~ 2200-2400 MPa). The significant increase in T0dy (~ 60 °C) for the modified 9Cr-1Mo steel as compared to the plain 9Cr-1Mo
steel is the reflection of this fact [10]. Overall, irrespective of the crack initiation mechanism involved in the material, the increase in loading rate actually makes the material to crack in a more brittle manner and should be reflected in the increase in the ductile brittle transition temperature. This is reflected in the T0dyvalues obtained for
Mod.9Cr-1Mo steel in the loading rates of 1.12, 3 and 5 m.s-1, as given in Table 1, 2 and 3.
Apart from the metallurgical significance of higher loading rate on the fracture toughness, there has been a mechanistic influence on the testing protocol, which needs to be discussed. The material under dynamic loading actually undergoes a series of forward and reflective stress waves, at least in the initial part of the loading, and is observed as high frequency oscillations in the load-time or load-displacement traces. Thus in determining the dynamic fracture toughness of materials the inertia effect on the fracture load determination is very important in data analysis, especially for higher loading rates or for that of brittle materials. The amplitudes of the consecutive oscillations are expected to die down with time after the impact and considered negligible after a period of 2τ -3τ [11 Ireland], where τ is the period of inertial oscillation, a function of specimen type and geometry and speed of sound through this material. A few estimation procedure of τ is available in the literature. Earlier in 1978, Server [12] JTEV-1978] has proposed an empirical equation incorporating specimen dimensions and compliance for estimating τ for a specimen with span to width ratio (s/w) of 4 as:
τ = 3.36 (w/S0)(YBCs)0.5 (4)
where B is specimen thickness (10 mm here), Cs is the specimen compliance, Y is the Young’s modulus and S0 is the
speed of sound in the specimen material. YBCs is also referred as Cs*, the non-dimensional specimen compliance,
and expressed as a function a0/w [12, 13]. Using this equation for the present case of deeply cracked specimen with a0/w~0.5 and considering velocity of sound as 6000 m/s in steel the τ is estimated to be 43 μs. Later Liu et al. [14]
has conducted a more rigorous and analytical solution of the displacement of the three point loaded beam under dynamic loading which is proposed to be composed of two components, a vibration term and a displacement term caused by the dynamic load. In his analysis Liu has considered that the Charpy specimen undergoes a forced second grade vibration (shown in Fig. 1) in both half lengths in the same phase and calculated the period of vibration as given in eqn.5.
Fig.1 Forced Second Grade VibrationMode
ω = (π/s)2 (YJ/ρA)0.5, and τ = 1/ω (5)
where J is the inertia moment of cracked specimen, ρ is the density of the material and A is the cross-sectional area of the specimen. With a span length of 55 mm, τ is calculated to be 32 μs, much less than Server’s equation. Following another empirical correlation, similar to Server, proposed by Ireland [15, 1997] as:
τ = 1.68 (l/S0)(B/l)0.5(YwCs)0.5, where Cs = l3/(4YwB3) (6)
with span as 40 mm and velocity of sound in steel as 6000 m/s, the period for vibration, τ is estimated to be 22.4 μs. For the analysis of the fracture load to determine the dynamic fracture toughness in the present campaign, it is being
thought that an analytical solution is more realistic than an empirical one and thus, the Liu’s proposition is more acceptable than the others. In the present situation the span length of 40 mm instead of 55 mm (used by Liu et al.
[14]) would further reduce the τ. From an engineering stand point, the time period, τ, is taken as 27 μs (average of 22 and 32 μs) for the present campaign, implying that after 3τ i.e 81 μs, all the measured fracture loads are free from any inertial effects. One observation can be noted that in all the above treatments for evaluating the period of vibration (τ), the loading rate has never been a part of the equation. However, the loading rate does influence the amplitude of the oscillations, which increases with the loading rate. Figures 2a, 2b and 2c shows the load-displacement traces obtained from the present campaign with loading rates of 1.12, 3 and 5 m/s respectively.
(a) (b) (c)
Fig.2 (a,b,c) representative load-displacement plots obtained at loading rates 1.12, 3 and 5 m/s
It can be noted that when the amplitude of vibration is negligible for the loading rate of 1.12 m/s, it is significantly present in loading rate of 3m/s and visually dominant for the loading rate of 5 m/s. Thus the time to fracture (tf) with respect to the 2τ -3τ time span is an important parameter, especially for the loading rates of 3 and 5
m/s, in ensuring the accuracy of the fracture load determination towards evaluating the dynamic fracture toughness. The relevant results obtained for the loading rate of 1.12 m/s and the calculated T0dy is given in Table.
Table 1. KJd of different specimens and Tody Mod. 9Cr-1Mo steel at a loading rate of 1.12 m/s
Tables 2 summarizes the KJd, obtained from different specimens and Tody of this steel at a loading rate of 3
m/s along with the estimated time to fracture (tf) for each specimens. It is observed that the time to fracture (tf) for
the loading rate of 3 m/s has exceed the 3τ i.e 67.2 μs time span for all the specimens, the minimum being 100 μs for the specimen No. NT16. Thus the loads taken for calculation of the dynamic fracture toughness in 3 m/s loading rate are considered free from inertial effects. It may be noted that due to practical reasons, the tests have been carried out at different temperatures instead of a single temperature. Thus the multi-temperature approach, as suggested in ASTM E 1921 has been adopted for evaluating T0dy.
Spec.
No: Test Temp. (°C) Crack Length (ao, mm)
KJd (MPa.m0.5)
for 10 mm thickness
Validity limits (MPa.m0.5)
(10 mm)
Validity
Results To
dy
(°C)
C8 -30 5.30 54.92 141 Valid
8.8
C9 -30 5.40 65.93 151 Valid
C6 -30 5.35 82.55 148 Valid
C11 -30 5.39 61.75 148 Valid
C12 -30 5.33 105.19 148 Valid
C13 -30 5.31 61.40 148 Valid
C14 -30 5.32 82.01 148 Valid
C7 -30 5.47 65.26 150 Valid
C10 -30 5.32 86.13 151 Valid
0.0 0.5 1.0 1.5 2.0 2.5
0 1 2 3 4 5 6 7 Load, kN displacement, mm
Loading Rate 1.12 m/s c12
-2 0 2 4 6 8 10 12 14 16 18 20 -2 0 2 4 6 8 lo a d , kN
displacement, mm Loading Rate 3.0 m/s NT18
-2 0 2 4 6 8 10 12 14 -1 0 1 2 3 4 5 6 lo a d , kN
Spec.
No: Temp. Test (°C)
Crack Length (ao,
mm)
Time to Fracture,
(tf, μs)
KJd
(MPa.m0.5)
for 10 mm thickness
Validity limits (MPa.m0.5)
(10 mm)
Validity
Results T0
dy
(°C)
NT 16 0 5.15 100 58.39 150 Valid
11.9
NT 17 0 5.21 110 79.78 150 Valid
NT 20 10 5.19 140 109.52 152 Valid
NT 21 10 5.29 250 112.58 152 Valid
NT 22 10 5.39 140 113.61 152 Valid
NT 23 20 5.13 320 179.89 155 Invalid
NT 24 20 5.43 350 193.54 155 Invalid
NT 25 20 5.56 150 182.92 155 Invalid
NT 18 20 5.24 140 110.63 155 Valid
Table 2. KJd of different specimens and Tody Mod. 9Cr-1Mo steel at a loading rate of 3 m/s
However, the time to fracture has been much less for loading rate of 5 m/s. Here it is observed that out of eight specimens tested at different temperatures ranging from −25 to 30 °C, four specimens (Nos. NT11, NT12, NT14, NT19) are at the border line of 2τ-3τ regime and one specimen (NT4) with tf = 10 μs fails to qualify even for
consideration. For the tf in the borderline situation, there are ways have been suggested in literature for a meaningful
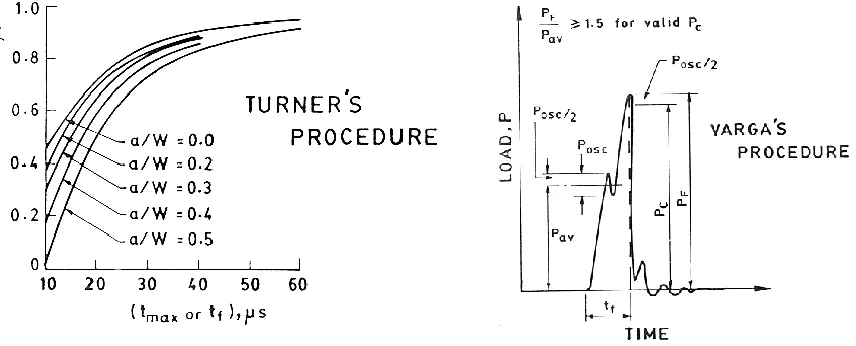
estimation of fracture load. Initially, Turner [16], based on a beam-on-foundation model, has suggested correction factors (γ) for tup loads, and plotted with respect to the a0/w ratio, as given in Fig. 3. In another procedure, Varga
[17], proposed to derive a critical load (PC) from traces showing failure at tf < 2τ and given in Fig. 4. For the above
four specimens, both the procedures (Turner’s and Varga’s) are applied to derive a meaningful fracture load for dynamic fracture toughness estimation.
Fig.3. Turner’s procedure for fracture load estimation Fig.4. Varga’s procedure for fracture load estimation
The relevant results along with the revised load estimations with Turner’s and Varga’s procedure are given in Tables 3 and 4 respectively. Similar to the case of loading rate of 3 m/s, here also the multi-temperature approach, as suggested in ASTM E 1921 has been adopted for evaluating T0dy. It can be seen that the Vargas’ procedure gives
slightly conservative load, and is reflected on the higher T0dy at the loading rate of 5 m/s. For a conservative DBTT
*Load correction for marginal cases with respect to tf. ** Not Considered due to low tf.
Table 3. KJd of different specimens and Tody Mod. 9Cr-1Mo steel at a loading rate of 5 m/s using Turner’s Procedure
Spec. No: Test Temp . (°C)
Crack Length (ao)
mm
Time to Fracture, (tf, μs)
Correcte d load, Varga, (kN)
KJd
(MPa.m0.5) Validity limits
(MPa.m0.5)
Validity
Results T0
dy
(°C)
NT 11* -25 5.19 60 *4.1 46.57 155 Valid
26.6
NT 12* -20 5.38 70 *4.0 48.24 157 Valid
NT 13 -10 5.21 110 90.51 184 Valid
NT 14* 0 5.49 70 *5.86 73.70 183 Valid
NT 3 21 4.97 120 83.25 182 Valid
NT 4** 21 6.67 10 --- --- --- ---
NT 19* 21 5.22 70 *6.0 68.57 181 Valid
NT 15 30 5.25 310 234 179 Invalid
*Load correction for marginal cases with respect to tf, ** Not Considered due to low tf.
Table 4. KJd of different specimens and Tody Mod. 9Cr-1Mo steel at a loading rate of 5 m/s using Varga’s Procedure.
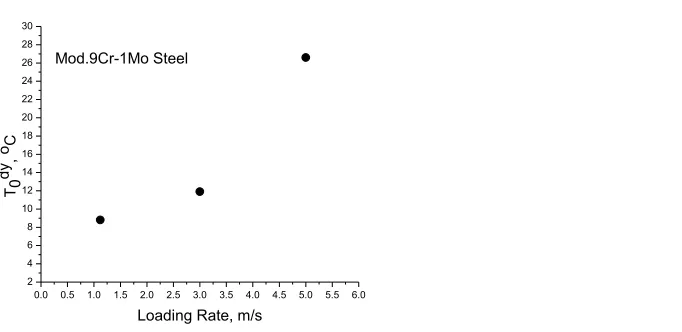
The variation of T0dy with the loading rate is given in Fig. 5. T0dy values determined were 8.8 and 11.2 °C for the
loading rates of 1.12 and 3 m/s respectively, and increases drastically to 26.2 °C for a loading rate of 5 m/s. This shift is little higher than that predicted empirically (~14 °C) for conventional pressure vessel steels, as estimated by Yoon et al. in 2001 [4].
Fig. 5 Variation of T0dy with the loading rate for the Mod.9Cr-1Mo steel.
Spec.
No: Temp. Test (°C)
Crack Length (ao) mm
Time to Fracture,
(tf, μs)
Correcte d load, Turner (kN)
KJd
(MPa.m0.5) Validity limits
(MPa.m0.5)
Validity
Results T0
dy
(°C)
NT 11* -25 5.19 60 *5.23 59.81 155 Valid
24.0
NT 12* -20 5.38 70 *5.23 63.49 157 Valid
NT 13 -10 5.21 110 90.51 184 Valid
NT 14* 0 5.49 70 *6.84 85.95 183 Valid
NT 3 21 4.97 120 83.25 182 Valid
NT 4** 21 6.67 10 --- --- --- ---
NT 19* 21 5.22 70 *7.09 81.05 181 Valid
NT 15 30 5.25 310 234 179 Invalid
0.0 0.5 1.0 1.5 2.0 2.5 3.0 3.5 4.0 4.5 5.0 5.5 6.0 2
4 6 8 10 12 14 16 18 20 22 24 26 28 30
T0 dy, o C
CONCLUSION
T0dy values determined were 8.8 and 11.2 °C for the loading rates of 1.12 and 3 m/s respectively, and
increases drastically to 26.2 °C for a loading rate of 5 m/s. This shift is little higher than that predicted empirically (~14 °C) for conventional pressure vessel steels, as estimated by Yoon et al. in 2001 [4]. The above result also indicates that the stress intensity rate (dK/dt) based approaches to estimate the effect of loading rate has been more closer to the experimental observations.
REFERENCES
[1] ASTM E 1921-05 ‘”Test Method for Determination of Reference Temperature, To, for Ferritic Steels in the Transition Range”, ASTM, 2005.
[2] Wallin K., Advaces in Fracture Research (Proc. Int. Conf. Fracture, ICF-9), B.L. Karihaloo, Y.W. Mai, M.I. Ripley and R.O. Ritchie (Eds.), Sydney, Australia, Vol. 5 (1997) p.2333.
[3] Wallin K. and Planman T., IAEA Specialist Meeting on Master Curve Testing and Result Application., 17-19 September, Prague, Czech Republic, 2001.
[4] Yoon K.K., Hall J.B., Van Der Sluys, Higuchi M and Lida K., The 2001 ASME Pressure Vessel and Piping Conference, July 23-26, Atlanta, Georgia, USA (2001) p.1.
[5] Schindler H.J., Varga. T., Njo D.H. and Prantl G., Materials Aging and Component Life Extension, Vol. 2, V. Bicego, A. Nitta, R. Viswanathan [Eds.], Proc. of Int. Symp. on Material Ageing and Component Life Extension, Milan, Italy, 10-13 Oct. (1995) p.1367.
[6] Moitra A., ‘Ductile-Brittle Transition Temperatures and Dynamic Fracture Toughness of 9Cr-1Mo Steel’, PhD Thesis, Banaras Hindu University, 2003.
[7] Moitra A., Sreenivasan P.R., Mannan S.L. and Singh V., Metallurgical and Materials Transactions A., 36A
(2005) 2957.
[8] Sathyanarayanan S., Moitra A., Samuel K. G., Sasikala G., Ray S.K., Singh V., Mater. Sci. & Engineering –A, 488, Issue 1-2 (2008) p.519.
[9] Ritchi R.O., Knott J.F. and Rice J.R., J. Mech. Phys. Solids. 21 (1973) p.395.
[10] Chen J.H., Wang. Q, Wang G.Z. and Li. Z., Acta Materialia, 51 (2003) p.1841.
[11] Ireland D.R., in Instrumented Impact Testing, ASTM STP 563, American Society for Testing and Materials, Philadelphia (1974) p.3.
[12] Server W.L., J Testing Evaluation, 6(1978) p.29.
[13] Sreenivasan P.R., Trans. Indan Inst. Met., 49, No.5, (1996) p.677.
[14] Liu Y., Zhu J., and Zhou H., Engg. Frac. Mech, 39, No.6, (1991) p.955
[15] Ireland D.R. in Proc. Int. Conf. On Dynamic Fracture Toughness, Cambridge, UK, The Welding Institute, (1997) p.45.
[16] Turner C.E. in Impact Testing of Metals, ASTM STP 466, American Society of Testing and Materials, Philadelphia (1970) p.93.