and Interactions with Leaf and Stem Rust Pathogens. (Under the direction of Drs. David S. Marshall and Shijin Hu).
Wheat is a key crop for global food security, and the staple food for 30% of the world population. It provides about 20% of the food proteins and calories to more than 4.5 billion people in 94 developing countries. By 2050, the world will need 70% more food, nearly 4 billion tonnes of cereals, most of which are needed in developing countries, where elevated ozone and resurgent rust diseases are challenges. However, there is limited information on how ozone and rust currently interact with wheat plants, and how these interactions influence the entire wheat phytobiome. Moreover, there is no information on the relative ozone responses of key breeding material and associated genetic markers, which significantly limit breeding wheat for ozone tolerance.
The first objective of this dissertation was to identify the relative ozone responses of key host germplasm, such as a panel of eight rust near-universal susceptible genotypes, and to investigate their suitability for breeding and phytobiome research. Visible injury results showed consistent differential O3 responses in two gas exposure systems. Thatcher and
LMPG-6 were the most sensitive genotype, whereas Chinese Spring and Little Club were the most tolerant. Biomass data showed similar results, accept for Rusty that was ranked moderately susceptible according to visible injury, and was the most sensitive according to biomass production. LMPG-6 could be used as O3-sensitive, in contrast to Chinese Spring. Similarly,
Thatcher is a suitable O3-sensitive in contrast to Little Club or Morocco for studying O3 effects
on different races of leaf rust.
The second objective of was to identify the genetic control of O3 tolerance at the
chromosome level in the wheat variety Chinese Spring. Tolerance is currently identified only to the subgenome level (subgenome AABB). Visible injury results suggested that the observed O3 tolerance is correlated with chromosomes 7A, with no evidence for sensitivity factors
varieties, suitable for the eastern United States. O3 responses of 12 hard and 10 soft red winter
wheat genotypes were tested against some varieties representing other cereal species. Injury results indicated that winter wheat were more tolerant than spring wheat, similar in sensitivity to oat, and more sensitive than triticale and barley. Tested hard wheat genotypes were found to be more sensitive to O3 than soft wheat. This indicated the importance of the O3 responses
of parents used to breed for improved hardness. Tested red wheat genotypes showed decreasing sensitivity as function of release date, with higher rate of declining sensitivity for varieties released after the year 2000. The visible injury difference between Coker 9553 and MD01W28-08-11 was confirmed by yield trials in open-top chambers. These two parents have contrasting adult-plant responses to stem rust (including races in Ug99-lineage), therefore, they are a suitable pair for simultaneous breeding for both stressors.
The fourth objective was to dissect the effects of O3 and CO2 concentration, exposure
timing and duration on the disease components of stem and leaf rusts on winter wheat. Consistent disease increase of both leaf and stem rust of wheat were evident under near-ambient but not under relatively high O3 concentrations. The O3-induced disease increase was
by
Alsayed M.S. Mashaheet
A dissertation submitted to the Graduate Faculty of North Carolina State University
in partial fulfillment of the requirements for the degree of
Doctor of Philosophy
Plant Pathology
Raleigh, North Carolina 2016
APPROVED BY:
_______________________________ _______________________________
Dr. David S. Marshall Dr. Shuijin Hu
DEDICATION
To my wife and “life” Camellia, my daughters Habeba and Jana, and my son Adam, for always being the best supportive family. To my Mom, who devoted all her days and nights encouraging me to finish this dissertation. To the memory of my Dad and grandparents, who lived and died, fighting for me. To my brothers and sisters, who worked very hard making sure, I am getting the education I had in my dreams. To my nieces and nephews, for continuously motivating me, and I hope this will be just the first PhD dissertation in our small family, with many more to come.
BIOGRAPHY
Alsayed Mohamed Saad Mashaheet was borne, and grew up in a small village ‘Sabry’, in a small district ‘Dilingat’, in the largest agricultural governorate in Egypt ‘Beheira’. He loved science and science communication since his early childhood. In 2000, Sayed joined Alexandria University, to pursue Bachelor of Science in Agriculture. Soon he realized that this is where he belongs, and he completed his B.Sc. in 2004, with excellence and honor degree. In 2006, Sayed started his faculty position at Alexandria University, teaching environmental plant diseases.
Sayed received his Master’s degree in 2010, in a joint-supervision program, under Samia Madkour from Alexandria University in Egypt, and Costas Saitanis from the Agricultural University of Athens, Greece. He conducted his master’s research in Athens in 2008, using sensitive plants to biomonitor ambient ozone pollution. In 2012, Sayed was awarded a fully funded PhD scholarship by the mission sector of the Egyptian ministry of higher education, to study elevated ozone interactions with rust diseases on wheat. In the fall of 2012, Sayed joined the Department of Plant Pathology at North Carolina State University, where he had the privilege of being advised by professors known for their global contribution in the fight against elevated ozone and wheat rusts.
ACKNOWLEDGMENTS
I would like to thank my committee members Drs. David Marshall, Shuijin Hu, Kent Burkey, and David Livingston for their extraordinary support and guidance during my PhD program. To Dr. Marshall for his leadership, and the application driven approach he taught me, Dr. Hu for expanding my focus from the wheat/rust pathosystem into a whole ecosystem and global impacts. To Dr. Burkey for being the first one I looked for to discuss new ideas, experiment details, procedures, and results, and for allowing me to use all the exposure systems available, and for spending hours in the greenhouse and exposure facilities to support all research stages. To Dr. Livingston for his guidance during my first lab experience in the US, and expanding my knowledge of histological host/pathogen interactions.
I would especially like to thank Dr. David Marshall for all the support he provided and opportunities I had as a member of his research group. I could not have asked for a better mentor during my PhD and CoAT programs, role model in his national and international contributions, and teacher who amazingly delivers science, politics, and real field experiences into the classroom.
data management. I especially thank all the aforementioned people for their assistance with field plot preparation, planting, harvest, washing roots and for all the long days spent with me at work over the last four years.
I am so thankful for all the help I received from Dr. Marshall’s wheat breeding group including Bill Brown, Lynda Whitcher, Charlie Glover, Myron Fountain, and Gabe Supino, for their assistance securing seed sources, planting, moving plants between facilities, harvesting and post-harvest analysis. Special thanks to Bill brown for all the endless skills he shared with me regarding wheat and wheat rusts, and for maintaining wheat seeds and rust spores, vernalizing and planting thousands of plants. Special thanks are also to Lynda Whitcher for training me on the single head threshers, SCKCS, NIR, DNA extractions and SNP marker analysis. Special thanks are to Sarah Whitcher, for her support during the first wheat harvest, and post-harvest data collection.
TABLE OF CONTENTS
LIST OF TABLES ... xi
LIST OF FIGURES ... xii
1. General Introduction ... 1
1.1. Relative O3 responses of key wheat breeding materials, and the genetic control and markers associated ... 1
1.1.1. Elevated Ozone (E-O3) and Climate Change ... 1
1.1.1.1. Formation, life time, transmission, removal and deposition of Tropospheric O3 ………./2
1.1.1.2. Deposition, diffusion, and flux of tropospheric O3 into plant canopy and tissue ………..5
1.1.1.3. Perception of O3 stress in plant tissue ... 6
1.1.1.4. ROS intracellular perception and Active production ... 7
1.1.1.5. Activation of MAP kinase cascades and Ethylene production ... 8
1.1.1.6. Development and spread of visible O3-lesions ... 8
1.1.2. Potential plant tolerance mechanisms to Elevated Ozone (E-O3) ... 9
1.1.2.1. Canopy architecture... 9
1.1.2.2. Cuticle modification ... 9
1.1.2.3. Regulation of O3 flux to leaves (stomatal control). ... 9
1.1.2.4. ROS detoxification by ascorbate (ASC) in the apoplast and cell wall repair and protection... 10
1.1.2.5. Plasma membrane ... 11
1.1.2.6. Containment of the visible O3-lesions ... 11
1.1.3. Wheat responses to O3 Stress ... 12
1.1.3.1. Wheat Importance ... 12
1.1.3.2. Wheat Evolution ... 12
1.1.3.3. Wheat Classes and Diversity ... 14
1.1.3.4. Wheat sensitivity to O3 ... 15
1.1.3.5. Factors limiting wheat breeding for O3 tolerance ... 18
1.1.4. Parsimonious Strategies for Breeding Resilient O3-Tolerant Wheat ... 22
1.1.4.1. Exploring O3 tolerance in Large Number of Wheat Breeding Materials ... 23
1.1.4.2. Identification of genetic markers... 24
1.1.4.4. Pre-release Screening ... 24
1.1.4.5. Validation of Seedling Screening with O3-Yield Responses ... 25
1.1.5. O3-Exposure Systems and Experimental Error Control in Wheat O3-Screenings 26 1.1.5.1. O3-Exposure Regimes ... 26
1.1.5.2. O3-Exposure Systems ... 29
1.1.5.3. Standardization of Visible Injury Scores ... 34
1.2. Disease Triangle for Wheat Rust under Elevated Ground-level O3 Concentrations ... 38
1.2.1. Causal Agents and Spread of Wheat Rust Pathogens... 38
1.2.2. General Cycle of Rust Diseases and Possible O3 Effects ... 39
1.2.2.1. Dissemination ... 40
1.2.2.2. Transmission ... 40
1.2.2.3. Inoculation ... 41
1.2.2.4. Spore Germination ... 41
1.2.2.5. Penetration ... 42
1.2.2.6. Infection ... 43
1.2.2.7. Invasion ... 45
1.2.2.8. Sporulation ... 46
1.2.3. Disease Components of Wheat Rusts ... 47
1.2.3.1. Incubation Period ... 47
1.2.3.2. Latent Period ... 47
1.2.3.3. Disease Severity and Percent Sporulation Area ... 48
1.2.3.4. Disease Incidence (Prevalence) ... 50
1.2.3.5. Receptivity (Pustule Density)... 50
1.2.3.6. Spore Production ... 50
1.2.3.7. Reaction/Infection Types ... 51
1.2.3.8. Average Coefficient of Infection (ACI) ... 52
1.2.4. Traditional Disease Triangle of Stem Rust under O3 Stress ... 53
1.2.5. Three-dimensional vertices model for wheat rust under elevated O3 ... 55
1.2.5.1. The sub-components of the host’s effect... 55
1.2.5.2. The sub-components of the pathogen’s effect... 59
1.2.5.3. The sub-components of the environment’s effect ... 60
1.3.1. Ozone Responses of the Rust Near-Universal Susceptible Panel of Wheat
Genotypes, and their Applications in Breeding and Phytobiome Research ... 62
1.3.2. Identification of the Genetic Control of Ozone Tolerance in Wheat (Triticum aestivum L. cv. Chinese Spring) at the Chromosome Level... 62
1.3.3. Relative O3-Responses of Some Winter Wheat Genotypes, and Their Suitability for Breeding Resilient Varieties... 62
1.3.4. Dissecting the Effects of O3 and CO2 Concentration, Exposure Timing and Duration on the Disease Components of Stem and Leaf Rusts on Winter Wheat. ... 63
2. Ozone Responses of the Rust Near-Universal Susceptible Panel of Wheat Genotypes, and their Applications in Breeding and Phytobiome Research. ... 64
2.1. Abstract ... 64
2.2. Introduction ... 65
2.3. Materials and Methods ... 70
2.3.1. Plant materials ... 70
2.3.2. Ozone treatment ... 70
2.3.3. O3 Injury Assessment ... 71
2.3.4. Dry Matter Accumulation Rate ... 71
2.3.5. Statistical Analysis ... 73
2.4. Results ... 73
2.4.1. Ozone Injury ... 73
2.4.1.1. Seedling Screening in CSTRs ... 73
2.4.1.2. Seedling Screening in OPECs ... 74
2.4.2. Dry Matter Accumulation Parameters ... 76
2.5. Discussion ... 81
3. Identification of the Genetic Control of Ozone Tolerance in Wheat (Triticum aestivum L. cv. Chinese Spring) at the Chromosome Level. ... 84
3.1. Abstract ... 84
3.2. Introduction ... 85
3.3. Materials and Methods ... 88
3.3.1. Plant Materials ... 88
3.3.2. Ozone treatment ... 88
3.3.3. Ozone Injury Assessment ... 88
3.3.4. Dry Matter Accumulation Rate ... 88
3.4. Results ... 90
3.4.1. Ozone Injury ... 90
3.4.2. Dry Matter Accumulation Rate ... 92
3.5. Discussion ... 95
4. Relative O3-Responses of Some Winter Wheat Genotypes, and Their Suitability for Breeding Rust and Ozone Tolerant Varieties. ... 98
4.1. Abstract ... 98
4.2. Introduction ... 100
4.3. Materials and Methods ... 105
4.3.1. O3-monitoring data... 105
4.3.2. Experiment (1): Investigation of relative O3 responses of some genotypes of spring and winter wheat, oat, barley, and triticale at the seedling stage. ... 106
4.3.3. Experiment (2): Investigation of relative O3-yield responses of two winter wheat genotypes with differential visible injury responses during 2015. ... 108
4.4. Results ... 108
4.4.1. O3-monitoring data... 108
4.4.2. Results of Experiment (1): ... 113
4.4.3. Results of Experiment (2): ... 117
4.5. Discussion ... 118
5. Dissecting the Effects of O3 and CO2 Concentration, Exposure Timing and Duration on the Disease Components of Stem and Leaf Rusts on Winter Wheat ... 122
5.1. Abstract ... 122
5.2. Introduction ... 124
Research Objectives: ... 131
5.3. Experiment (1): Effects of Near-Ambient O3 and CO2 on Disease Components of Leaf Rust, on O3-sensitive Winter Wheat Varieties, with Different Reaction Types to Rust ……….132
5.3.1. Material and Methods of Experiment (1) ... 132
5.3.1.1. Plant Materials... 132
5.3.1.2. Gas Exposure... 132
5.3.1.3. Disease Inoculation ... 133
5.3.1.4. Disease Estimation ... 133
5.3.1.5. Statistical Analysis ... 133
5.3.2.1. Disease Severity of Leaf Rust ... 135
5.3.2.2. Pustule Size on Flag Leaf ... 137
5.3.2.3. Area under sporulation curve (AUSC) on Flag Leaf ... 137
5.4. Experiment (2): Effects of Near-Ambient O3 and CO2 on Disease Severity of Stem Rust, on O3-sensitive Winter Wheat Varieties, with Different Reaction Types ... 140
5.4.1. Material and Methods of Experiment (2) ... 140
5.4.2. Results and Discussion of Experiment (2) ... 140
5.4.2.1. Percent sporulation area of Stem rust ... 140
5.5. Experiment (3): Effects of Different O3 Concentrations on Stem Rust at Seedling Stage ……….142
5.5.1. Material and Methods of Experiment (3) ... 142
5.5.2. Results and discussion of Experiment (3) ... 145
5.6. Experiment (4): Effects of O3 and CO2 concentration, exposure timing and duration on stem rust on winter wheat at seedling stage ... 147
5.6.1. Material and Methods of Experiment (4) ... 147
5.6.2. Results and Discussion of Experiment (4) ... 149
5.7. General Discussion and Conclusion ... 151
LIST OF TABLES
Table (1): Relative ozone responses of eight rust near-universal susceptible wheat genotypes, conducted under different ozone levels, for different exposure periods, in two different systems: Continuous Stirred Tank Reactors (CSTRs) and Outdoor Plant Environment Chambers (OPECs). Varieties were ranked according to their overall responses in two screening studies. ... 76 Table (2): Different genotypes of winter and spring wheat, winter barley, oat and triticale and their market classes, accession ID, and date of cultivars release or variety and breeding line selection. ... 107 Table (3): Reports on the interactions of elevated O3, CO2 and rust pathogens on wheat plants.
LIST OF FIGURES
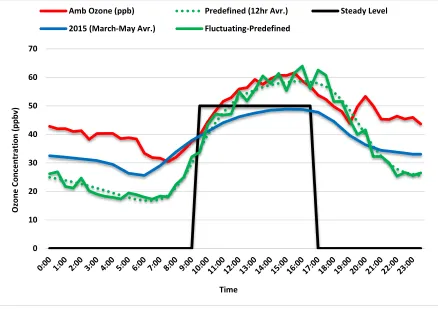
Figure (1): Changes in O3 concentrations overtime using different O3 exposure regimes.
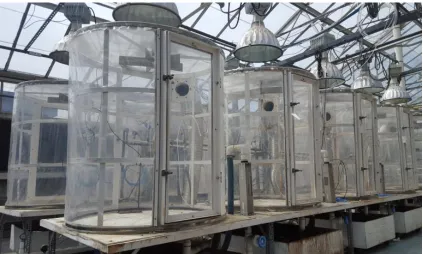
Average diurnal profile of the 2015 active growing season (March-May), and April 21, 2016 (50 ppb 12 average) are given as examples for short- and long-term ambient levels. Ambient data were monitored at the USDA-ARS Plant Science Unit field site, 5 km south of Raleigh, NC, U.S.A. Elevation was 110 m above sea level, and provided by Samuel Ray & Walt Pursley. ... 29 Figure (2): Continuous Stirred Tank Reactors (CSTRs) inside a charcoal filtered greenhouse. Plant Research Unite, USDA-ARS, Raleigh, NC, USA. ... 30 Figure (3): Outdoor-Plant Environment Chambers (OPECs). Plant Science Unite Field, USDA-ARS, Raleigh, NC, U.S.A... 31 Figure (4): Open-top Chambers (OTCs). Plant Science Unite Field, USDA-ARS, Raleigh, NC, U.S.A... 32 Figure (5): Air Exclusion System (AES). Plant Science Unite Field, USDA-ARS, Raleigh, NC, U.S.A. ... 33 Figure 6: Wheat canopy structure at seedling stage [13, 22 (Zadoks et al., 1974)] and adult-plant stage (18, 46 Zadoks). Modified from (Tottman, 1987). ... 35 Figure (7): Simple (Pask et al., 2012; Peterson et al., 1948; Roelfs et al., 1992) and polynomial linear relationship (CIMMYT, 1986) between Disease Severity Scores and actual Percent Sporulation Area. ... 49 Figure (8): Traditional disease triangle with the host, pathogen and the environment on the triangle vertices. ... 54 Figure (9): Disease triangle with the host, pathogen, and the environment on the three sides of the triangle, showing more weight to the environmental effects (i.e. longer side). The host and the pathogen are equally represented (similar side lengths). ... 54 Figure (10): Three-Dimensional Vertices Model, a robust disease triangle variant, illustrating sub-components of each of the three major disease factors (host, pathogen, and environment). ... 56 Figure (11): Ozone Injury Scoring Guide. O3 visible symptoms exposed to O3 in Continuous
Stirred Tank Reactors (CSTRs). Percent injury were assessed using scanned detached leaf images, analyzed using APS Assess 2.2 (APS, Saint Paul, Minnesota, USA). ... 72 Figure (12): O3 injury on the fourth leaf of seven rust near-universal susceptible genotypes, at
were visually estimated, under constant light conditions according 0-100% scale. Mean separation by Tukey’s post-hoc test. ... 74 Figure (13): O3 injury on the 3rd-5th leaf of eight rust near-universal susceptible genotypes, at
three different O3 levels, exposed for 14 days (12hrs/day, at 25°C and 50% RH) in OPECs.
Injury was visually estimated, under constant light conditions according 0-100% scale. Mean separation by Tukey’s post-hoc test. ... 75 Figure (14): The initial dry weight (gm) of the eight genotypes at 30 days after planting (DAP), and prior to O3 treatment in OPECs. ... 77
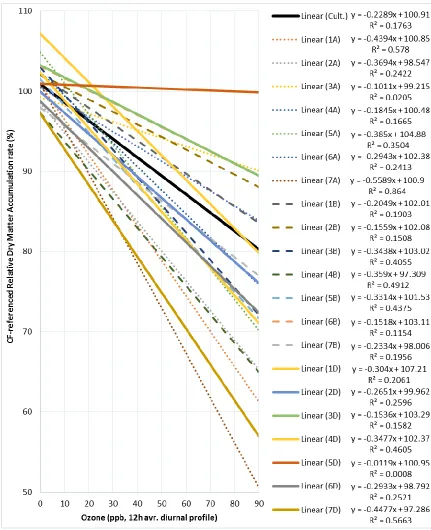
Figure (15): The regression line of the dry matter accumulation rate on the initial weight of the eight genotypes under different O3 treatments. ... 78
Figure (16): The regression line of the dry matter accumulation rate on the initial weight of the seven bread wheat genotypes under different O3 treatments. ... 78
Figure (17): Relative dry matter accumulation rate of eight rust near-universal susceptible genotypes at different O3 levels (12hrs/day, at 25°C and 50% RH, for 14 days in OPECs),
referenced to their RDMAR in Charcoal filtered air (O3= zero ppb). ... 79
Figure (18): Regression lines of post-treatment dry matter of eight rust near-universal susceptible genotypes referenced to the genotype average dry matter in Charcoal filtered air (O3= zero ppb). Tested O3 treatments were CF, 50, 70 and 90 ppb (12hrs/day, at 25°C and 50%
RH, for 14 days in OPECs). ... 80 Figure (19): O3 injury on the fourth leaf of Chinese Spring variety and its 21 monosomic lines,
at four different O3 levels, exposed for 5 days (7hrs/day, at 25°C and 60% RH) in CSTRs.
Upper and lower decision limits (UDL and LDL, respectively) at α=0.05 are determined using Dunnett-Hsu adjustment. ... 90 Figure (20): O3 injury on the 3rd-5th leaf of Chinese Spring variety and its 21 monosomic lines,
at three different O3 levels, exposed for 14 days (12hrs/day, at 25°C and 50% RH) in OPECs.
Figure (23): Relative dry matter accumulation rate of Chinese Spring wheat and its 21 monosomic lines at different O3 levels (12hrs/day, at 25°C and 50% RH, for 14 days in
OPECs), referenced to their RDAR in Charcoal filtered air (O3= zero ppb). ... 94
Figure (24): Ozone monitoring data during wheat active growing season (March-May), summarized as 12hr daily average, at wheat open field plots in a sub-urban location, at the USDA-ARS Plant Science Unit field site, 5 km south of Raleigh, NC, U.S.A. Elevation was 110 m above sea level, and provided by Samuel Ray & Walt Pursley. ... 109 Figure (25): Trends in monthly and active growing average O3 concentrations monitored at a
typical sub-urban location, in Raleigh NC, during wheat active growing season (March-May). Initial data were summarized as 12hr daily average. Data provided by Samuel Ray & Walt Pursley, USDA-ARS, Plant Research Unit, Raleigh, NC, USA. ... 110 Figure (26): Hourly average O3 monitoring data during the wheat active growing season
(March-May 2015), at the USDA-ARS Plant Science Unit field site, 5 km south of Raleigh, NC, U.S.A. Elevation was 110 m above sea level, and provided by Samuel Ray & Walt Pursley. ... 111 Figure (27): Hourly-average O3 concentrations at the USDA-ARS OTC field site in a
sub-urban location, in Raleigh NC, during wheat grain filling stage (April 23 - May 3, 2015). Data provided by Samuel Ray & Walt Pursley, USDA-ARS, Plant Research Unit, Raleigh, NC, USA... 112 Figure (28): Relative O3 injury response on the fourth leaf on the main stem of 24 genotypes
winter wheat, comparing to tow genotypes of winter wheat oat and barley, and one winter genotype of triticale. Data are averages of visual injury estimated after seven days of exposure to 50, 75, and 100 ppb O3, for 7hr d-1, in continuous stirred tank reactors (CSTRs), at the
seedling stage. (Error bar = SE., α = 0.05). ... 113 Figure (29): O3 injury response on the fourth leaf on the main stem of 23 genotypes of winter
wheat, comparing to three genotypes of spring wheat, two genotypes of winter oat and barley, and one winter genotype of triticale. Data are averages of visual injury estimated after seven days of exposure across three O3 concentrations (50, 75, and 100 ppb, for 8hr d-1), in continuous
stirred tank reactors (CSTRs), at seedling stage. (Different letters indicate significant differences according to Tukey’s adjustment at α=0.05). ... 115 Figure (30): Trends in average O3 visible responses visually estimated on the fourth leaf on
Figure (31): Trends in average O3 visible responses visually estimated on the fourth leaf on
the main stem of some soft and hard red winter wheat varieties, released or selected in the United States since the year 2000. The black line represents the slope of all data points. ... 116 Figure (32): O3-yield responses of two soft red winter wheat genotypes, exposed from heading
to harvest, to different O3 treatments (CF, 50, 75 and 100 ppb, 12hr average O3, diurnal profile),
in Open-top field Chambers (OTCs)... 117 Figure (33): The relationships between the assessed percent sporulation area using APS Assess 2.2 and the corresponding disease severity scores illustrated in the CIMMYT Rust Scoring Guide scale (CIMMYT, 1986), and the published modified Cobb scale (Pask et al., 2012; Peterson et al., 1948; Roelfs et al., 1992)... 134 Figure (34): Effects of gas treatments on average disease severity of leaf rust race MMTNB, on four winter wheat varieties with different reaction types [Coker 9553 (susceptible), NC Neuse (moderately susceptible) Jamestown (moderately resistant) and NuEast (resistant)]. Four treatments [CF (10 ppb O3, 400 ppm CO2), O3 (50 ppb O3, 400 ppm CO2), O3+CO2 (50
ppb O3, 570 ppm CO2), and CO2 (10 ppb O3, 570 ppm CO2)] were applied in OPECs, at 60%
relative humidity, and 25, 16°C day/night temperature cycle. Data is the average of two replicates of each gas treatment, with three plant per genotype in each. Disease severity was visually estimated, on flag and second top leaf, on the main stem and the first tiller, and scores were averaged per plant for analysis. Significant differences in means were determined by Tukey’s tests. Letters apply only within variety. ... 136 Figure (35): Effect of Gas treatment on pustule size (mm3) of leaf rust race MMTNB, on four winter wheat varieties with different reaction types [Coker 9553 (susceptible), NC Neuse (moderately susceptible) Jamestown (moderately resistant) and NuEast (resistant)]. Treatments included four different combinations of O3 and CO2 [CF (10 ppb O3, 400 ppm
CO2), O3 (50 ppb O3, 400 ppm CO2), O3+CO2 (50 ppb O3, 570 ppm CO2), and CO2 (10 ppb
O3, 570 ppm CO2)], at 60% relative humidity, and 25, 16°C day/night temperature cycle. Data
is the average of two replicates of each gas treatment, with three plants per genotype in each. Pustule length and width were measured on middle of flag of the main stem, and were used for pustule size calculation. Significant differences in means were determined by Tukey’s tests. Letters apply only within variety. ... 138 Figure (36): Effect of four combinations of CO2 (400, 570 ppm) and O3 (10, 50 ppb) on latent
Figure (37): Effect of Gas treatment on percent sporulation are of stem rust race QFCSC, on winter wheat varieties Coker 9553 (susceptible) and NC Neuse (resistant). Four different gas treatments were conducted in OPECs [CF (0 ppb O3, 400 ppm CO2), O3 (50 ppb O3, 400 ppm
CO2), O3+CO2 (50 ppb O3, 570 ppm CO2), and CO2 (0 ppb O3, 570 ppm CO2)], at 60% relative
humidity, and 25, 16°C day/night temperature cycle. Data is the average of two replicates of each gas treatment, with three plants per genotype in each. Significant differences in mean were determined by Tukey’s tests. Letters apply only within variety. ... 141 Figure (38): Target 24hr diurnal profiles for the three O3 treatments with 12hr average of 50,
70 and 90 ppb, applied in Outdoor-plant Environment Chambers (OPECs), to study the effects of different O3 concentration on stem rust at seedling stage. ... 143
Figure (39): Timeline for O3 treatment, stem rust inoculation, and disease sampling, used to
study the effects of different O3 concentrations on stem rust at the seedling stage in experiment
(3). ... 144 Figure (40): Assessment of percent sporulation area using scanning laves and image analysis using APS Assess 2.2. Top leaf shows the actual stem rust sporulation area, and the bottom leaf shows the sporulation area identified by the APS Assess 2.2... 144 Figure (41): Effect of continuous treatment with different O3 concentrations (50, 70, and 90
ppb 12hr average of 24hr diurnal profile on percent sporulation area of stem rust (race QFCSC) at two leaf positions [top leaf (T) and second top leaf (T-1)]) on the main stem (a), and at 3 different times after inoculation (7, 14, 21 DAI) (b). Winter wheat cultivar Coker-9553 used was grown in OPECs, at 50% RH, 25/16 °C (day/night), and 400 ppm CO2. ... 146
Figure (42): Timeline for stem rust inoculation and assessment, and different timing and duration of gas exposure, and their relation to disease stage, used to study the effects of different O3 and CO2 concentration, exposure timing and duration on stem rust on winter wheat
at seedling stage in experiment (4). ... 148 Figure (43): Effect of gas treatments [CF control (0 ppb O3, 400 ppm CO2), O3 (50 ppb O3,
400 ppm CO2), O3+CO2 (50 ppb O3, 570 ppm CO2), and CO2 (0 ppb O3, 570 ppm CO2)],
exposure timing (relative to the disease stage) and duration (1-6 weeks) on stem rust (race QFCSC) on percent sporulation area at two leaf position [top leaf (T) and second top leaf (T-1)]) on the main stem, at 3 different times after inoculation (7, 14, 21 DAI) on winter wheat cultivar Coker-9553, grown in OPECs, at 50% RH, 25/16 °C (day/night), and 400 ppm CO2.
... 150 Figure (44): Green islands surrounding stem rust pustules on O3-stressed leaves of winter
1.
General Introduction
Sustainable increase in wheat (Triticum aestivum L.) production is needed for attaining global food security. This sustainability requires resilient wheat cultivars that can cope simultaneously with major biotic and abiotic stresses, while maintaining healthy phytobiomes, and high yield. The rapidly evolving rust pathogens and the elevated ambient ozone levels (E-O3) are two concomitant threats and limiting factors to wheat production worldwide. However,
they are not addressed simultaneously, despite of the necessity and the potential, under current limited resources. This is due to the lack of information needed in two main areas: (1) the relative O3 responses of key wheat breeding materials, and the genetic control and markers
associated with these responses, and (2) the effects of O3 responses of wheat cultivars on wheat
interactions with rust pathogen, under current and future carbon dioxide (CO2) concentrations.
This dissertation aims at identifying and addressing some significant knowledge gap in these two critical areas.
1.1. Relative O3 responses of key wheat breeding materials, and the genetic
control and markers associated
1.1.1. Elevated Ozone (E-O3) and Climate Change
warming gases that imposes eminent threat to humans, animals and plants, as well as their biological and physical environments (De Kok et al., 2016).
Ozone is a colorless gas has been associated to electrical storms during all the human history, yet it was first identified and named as a distinct chemical compound by Schönbein in 1840, and its molecular formula as a triatomic Oxygen molecule was determined in 1865 by Soret and confirmed by him in 1867 (McElroy and Fogal, 2008). The name Ozone was derived from the Greek word ozein which means “to smell”, due to its slightly sweet, water melon-like odor, that could be recognized at very low concentrations as low as 7.6 - 36 ppb (Iriti and Faoro, 2009).
Ozone in the atmosphere is spatially classified into two pools: stratospheric O3 (also
known as ozone layer) and tropospheric or ground level O3 (also known as surface O3 or
ambient O3). Unlike the protective O3 naturally formed in the stratosphere, O3 in the ground
level layer of the troposphere is a secondary air pollutant and a greenhouse gas, associated with human hospital admission and mortality (Schwartz, 2016), as well as phytotoxicity (Li et al., 2015). The phytotoxic effects of O3 were recognized as early as 1958, when atypical diseases
symptoms were observed on ponderosa pine needles in the near of Los Angeles, and on tobacco leaves in the eastern USA, which were attributed to photochemical smog containing ozone as the major phytotoxic component (Heggestad and Middleton, 1959).
1.1.1.1. Formation, life time, transmission, removal and deposition of Tropospheric O3
Ground level tropospheric O3 at a given location could be classified into three origins:
(1) stratosphere-originated, (2) long- or short-term transmitted, and locally originated O3
(Cooper et al., 2014). In the year 2000, the total tropospheric O3 budget were estimated to be
The only reliable quantitative ozone measurements from preindustrial non-anthropogenic O3 levels in the late 19th century were made at Montsouris near Paris where
ozone averaged 11 ± 2 ppb from 1876 to 1910 and maximum concentration during the 19th century occurred during spring (Volz and Kley, 1988). This non-anthropogenic O3 originates
from several sources such as stratospheric O3 transferred to the troposphere, lightning, and
photochemical reactions between precursors emitted from natural sources. O3 concentrations
has been increased over the 20th century due to human activities, with highly variable localized
peaks that shifted towards summer (Cooper et al., 2014). These local concentrations are determined by precursors’ concentrations, baseline O3 concentrations (O3 concentrations in
free-air before being affected by local O3 formation), local peak O3 concentrations, and
seasonal cycle (Colette et al., 2016).
Tropospheric O3 is formed by photochemical reactions between nitrogen oxides (NOx)
and non-methane volatile organic compounds (NMVOC) (Booker et al., 2009). These reactions are dependent on the sun light, concentration of precursors and the ratio between them, and favored by high temperatures and stagnant weather condition (Khoder, 2009; Madkour and Laurence, 2002). Besides the precursors’ concentrations, weather and meteorological conditions are major factors controlling stratosphere-troposphere O3 exchange,
long- and short-term O3 transmission, and local O3 formation, which eventually determine
local O3 concentrations. Local O3 formation is also highly dependent on the ratio between the
two major precursor groups (NOx and NMVOCs), as unbalanced ratios result in titration effect
of the dominant precursor removing O3 that is already formed (Monks et al., 2015), especially
if NOx is the dominant precursor (Archibald et al., 2011). Therefore, in some areas, O3
formation could be NOx-limited or VOC-limited (Chang et al., 2016).
Ambient O3 pollution is a diverse problem both spatially and temporally. Spatial
variations in O3 levels result from the relative location of sources of the precursors, and the
ratio between them (NOx/VOCs) (Khoder, 2009). Whereas, the temporal variations result
light, all of which are contributing to seasonal and diurnal variations in O3 levels (Khoder,
2009). Tropospheric O3 levels usually are low in the morning and increase after sunrise to
achieve the peak in the afternoon and evening (Wang et al., 2008). Similarly, O3
concentrations in the northern hemisphere are usually low in winter and increase in spring to reach the peak in summer (Fiore et al., 2009). These two types of O3 peaks coincide with high
plant activity during the day, and growing season for most of the major crops in spring and summer.
O3 is not only an urban pollutant, as it is transmitted along with its precursors to
sub-urban and rural areas, where humans, animals and plants are experiencing higher O3
concentrations (Sicard et al., 2016). The lifetime of O3 molecules are 22±2 days in the
troposphere, which allow regional and hemispheric-scale transmission (Stevenson et al., 2006). For example, O3 transmitted from significant sources in Asia seems to be contributing
to increased background O3 levels in remote areas with low or decreased precursors’ emissions
in Europe and North America (Fiore et al., 2009; Sicard et al., 2016). This could be clearly observed in the increased base-line O3 levels in the free air of the troposphere since 1970,
despite the reduced precursors’ emission in Europe and North America (Cooper et al., 2014).
Ground level O3 showed varied regional trends from 1990 until 2010 (Monks et al.,
2015). In Western Europe, ambient O3 levels increased in the 1990s then leveled off or
decreased after 2000, meanwhile, rural O3 levels in eastern USA have decreased in summer,
leveled off in spring, but increased in winter (Cooper et al., 2014). This decrease is mainly due to the decreased precursors’ emission (Monks et al., 2015). Contrarily, in the western USA more than half of the rural sites showed increased O3 levels in spring (Cooper et al.,
2014). Shifts in the high O3 peaks season has been observed since 1970s, as peaks tends to
shift (3-6 days/decade) to take place earlier during spring, becoming more similar to the preindustrial trend (Cooper et al., 2014; Parrish et al., 2013).
The yearly average surface O3 base line, measured in the marine boundary layer, of
29-49 ppb (Cooper et al., 2014). O3 levels increase from sea level with the increase in altitude as
values measured at higher altitude from different parts of the world ranged from 37-59 ppb (Cooper et al., 2014). In both of the previous data sets, the highest concentrations were recorded in western Japan, due to its location immediately downwind of precursor emissions from continental East Asia where ozone has increase rapidly since 1980, and is expected to continue increasing until 2050 (Lee et al., 2014). O3 concentrations in urban polluted areas all
over the world are significantly higher than base line, especially in China, where midday summertime (June, July, August) median ozone mixing ratio of 75 ppb is common (Cooper et al., 2014).
1.1.1.2. Deposition, diffusion, and flux of tropospheric O3 into plant canopy and tissue
After being formed in the atmosphere, O3 molecule could be scavenged or removed
from air by several mechanisms, such as UV interception, rain, deposition to dust particles and soil or and chemical reactions with other gases such as NOx and VOCs (Fares et al., 2012).
Because of its lifetime (about 22 days), O3 could also be transferred and diffused into plant
canopy, where O3 molecule could be titrated by plant produced VOCs (biogenic VOCs), or
could be deposited onto plant cuticle (Monks et al., 2015). Limited dry deposition onto cuticle (Cape et al., 2009), makes O3 flux through dry cuticle effectively negligible (Kerstiens and
Lendzian, 1989). However, cuticle deposition may represent a major sink for O3 if the
receptive canopy is wet (Altimir et al., 2006), because of its relatively high solubility in water (10 times more than CO2) on leaf surface (Zuccarini, 2009), which enables it to penetrate into
the leaf, when this water is absorbed via stomata. This could increase the effective O3 flux into
the leaf causing acute symptoms at O3 levels expected only to cause chronic effects (Altimir
et al., 2006). However, in some cases water films over leaves may reduce deposition (Monks et al., 2015). The O3 molecule could also be titrated close to soil surface by NOx emitted
O3 molecules could also penetrate directly through opened stomata and dissolve into
reactive oxygen species (ROS), including singlet oxygen (1O2), hydroxyl radicals (HO˙),
superoxide (O2˙-) or hydrogen peroxide (H2O2), in the apoplast (Miller et al., 2010). These
ROS react directly in the apoplastic fluid with extracellular proteins, the cell wall and/or plasma membrane (Pellinen et al., 1999; Vahisalu et al., 2010). Under moderate external O3
concentrations, the influx of O3 and ROS generated during the early phase will be detoxified
by the apoplastic antioxidants capacity (such as ascorbate). However, under high external O3
concentrations, high stomatal conductance, low mesophyll resistance to gas diffusion, late and/or partial stomatal closure response, late and/or insufficient antioxidant response, the influx of O3 during the early phase exceeds the apoplastic antioxidant capacity to detoxify ROS
formed from O3 degradation (Vaultier and Jolivet, 2015).
1.1.1.3. Perception of O3 stress in plant tissue
ROS produced by O3 dissolution in the apoplast probably do not directly enter the cells
to activate ROS-generating systems. Current evidence suggests the initial ROS formation activates the heterotrimeric Gβγ-protein directly or indirectly, via oxidation at the cell surface. Changes induced by O3 or O3-dervitives in cell wall, or changes induced by cell wall derived
H2O2 in the apoplast are possible initial steps of O3-stress signaling (Vaultier and Jolivet,
2015).
for O3 signal perception at the cell surface (Vaultier and Jolivet, 2015; Wrzaczek et al.,
2010).
The reaction of non-biological ROS (derived from the degradation of O3 in the leaf
apoplast) with the extracellular ascorbate pool causes relative increases in cytosolic calcium [Ca2+]
cyt. This proportional increase in [Ca2+]cyt induces the Ca2+ influx and the activation of
an anion channel. In turn, the Ca2+ activates anion channels causing plasma membrane depolarization and subsequently, O3 signal amplification by activating a plasma membrane
NADPH-oxidase (Kadono et al., 2010). H2O2 resulting from NADPH-oxidase activity
increases [Ca2+]cyt by activating the plasma membrane Ca2+ channels, acting as a feedback loop
on anion channel activation in a biphasic calcium signal (Kadono et al., 2010). This short-lived, spike-like elevation in [Ca2+]cyt, followed by the smaller and more prolonged increase is
an O3-induced calcium signature (Short et al., 2012).
1.1.1.4. ROS intracellular perception and Active production
When ROS formation from O3 exceeds the apoplastic antioxidant capacity, an
endogenous, active, self-propagating ROS generation tacks place. This active oxidative burst, which continues after the end of the O3 exposure is similar to the one observed in
hypersensitive response (HR) that takes place in host-pathogen incompatible reactions, and leads to the programmed cell death (PCD) (Kangasjärvi et al., 2005). O3 intracellular
signaling goes through three processes, perception, transduction, and response induction by the network of regulatory mechanisms in the cells affected. It involves at least three separate signaling cascades downstream of the perception of O3. First, Gβ or Gβγ signaling to the
chloroplast (Joo et al., 2005). Second, the activation of MAP kinases by O3 (Joo et al., 2005).
Third, Gα subunit required for O3-lesion formation (Booker et al., 2004; Joo et al., 2005).
O3-induced ROS production starts first in the chloroplasts of the stomatal guard cells,
and spreads later to the adjacent cells (Joo et al., 2005). The early chloroplastic oxidative burst is a result of signaling through the Gβγ-protein complex that is perceived in the chloroplast
This intracellular ROS are likely to be sensed through accumulation, which alters the redox balance of the cell (Van Breusegem et al., 2001). This first peak of ROS is perceived by the Gα protein that activates NADPH oxidases on the plasma membrane to produce extracellular
ROS (second peak), which spread to the adjacent cells and is perceived by Gβγ-protein
complex, mediating the intercellular signaling, which in turn, repeats the two peaks cycle again in the neighboring cells (Kangasjärvi et al., 2005).
1.1.1.5. Activation of MAP kinase cascades and Ethylene production
The activation of mitogen-activated protein kinase (MAPK) cascades also starts within minutes from the beginning of O3 exposure in parallel to G-proteins; however, it is independent
from the G-protein pathway and does not involve G-proteins. It also does not appear to be directly involved in the activation of ROS production, since it takes place in both O3-sensitive
and -tolerant accessions (Kangasjärvi et al., 2005). Activation of MAP kinases by phosphorylation generally leads to nuclear localization of transcription factors and their activation by the MAPK. Among MAP kinases, AtMPK6 and AtMPK3 are rapidly activated by O3. The activation of AtMPK6 results in increased ethylene synthesis only in the sensitive
accessions. The down-regulation of ethylene synthesis is slower or less efficient in the O3
-sensitive accessions comparing to the tolerant ones (Kangasjärvi et al., 2005). The endogenous, cell death-driving ROS production triggered by O3 is ethylene-dependent (Kanna
et al., 2003).
1.1.1.6. Development and spread of visible O3-lesions
Ethylene and salicylic acid (SA) are needed for the development of the visible O3
-lesions. The endogenous, cell death-driving ROS production triggered by O3 is
ethylene-dependent (Kanna et al., 2003). Ozone exposure induces SA synthesis within a few hours after the beginning of the exposure. ROS production drives the SA-dependent cell death. SA has a vital role in cell death, and that without SA, active PCD is not initiated in O3- exposed
1.1.2. Potential plant tolerance mechanisms to Elevated Ozone (E-O3) 1.1.2.1. Canopy architecture
Plant canopies with higher leaf area index (LAI) had lower O3 concentrations in the
lower canopy than canopies with lower LAI (Finkelstein et al., 2004). This means that canopy closure could give some protection to the lower canopy with older and more sensitive leaves, which may lead to more tolerance.
1.1.2.2. Cuticle modification
Epicuticular waxes are directly in contact with atmospheric O3, so that, they are
putative sites of primary perception. However, O3-induced alterations to these epicuticular
waxes had no effect on O3 responses in most of the cases (Vaultier and Jolivet, 2015). In
contrast, comparative metabolite profiling among birch genotypes showed that some compounds related to leaf cuticle wax formation could provide growth-related tolerance to O3
(Kontunen‐Soppela et al., 2007).
1.1.2.3. Regulation of O3 flux to leaves (stomatal control).
The magnitude of ROS from O3 breakdown in the apoplast of plant leaves is determined
by the amount of O3 entering the leaf through stomatal opening, and the apoplast antioxidant
capacity. The early responses guard cells to O3 stress determine the flux into the leaf. Plants
responding to O3 with adequate stomatal responses are more likely to be more tolerant.
However, O3 is known to interfere with guard cells functions, and therefore stomatal
conductance. O3-induced ROS in the guard cells were found to induce stomatal closure and/or
inhibit of stomatal opening, eventually decreasing stomatal conductance, which is considered a plant protective mechanism (Hill and Littlefield, 1969).
There are several different mechanisms, by which O3 induces stomatal closure in
mechanisms in the apoplast. However, stomatal closure is restrictive to gas exchange; therefore, O3-induced stomatal closure counteracts CO2 absorption and O2 release required for
photosynthesis, as well as, transpiration needed for evaporative cooling under heat stress. For example, O3-induced stomatal closure in Siebold's beech during early summer reduced ozone
influx and allowed the maximum photosynthetic capacity to be reached, but was not sufficient to protect the photosynthetic system in late summer and fall (Hoshika et al., 2013).
E-O3 is also known to inhibit stomatal closure of sensitive plants by inducing ethylene
production that suppresses ABA role in stomatal closure (Wilkinson and Davies, 2009; Wilkinson and Davies, 2010; Wilkinson et al., 2011). Varieties with less ethylene production under O3 stress will have better stomatal control of O3 flux.
1.1.2.4. ROS detoxification by ascorbate (ASC) in the apoplast and cell wall repair and protection
Early detection and quick responses upon O3 penetration are essential for tolerance. It
requires the combination of stomatal control of ozone flux, adequate total capacity for scavenging of ROS, and re-equilibrium of detoxification system. In addition, metabolic changes are required to allow enough supply of reducing power and carbon skeletons for repair and detoxification. These functions are required for O3 tolerance despite the decrease in
photosynthetic activity. It is clear that these acclimation responses are effective only against short-term peaks, and cannot continue for extended periods as those encountered under chronic exposure, because the continued O3 flux will reduce carbon availability, in addition to the
increase in demand for reducing power and energy. All these will leads to disequilibrium and to cell death (Dizengremel et al., 2009). Increased cell wall lignification, and the up-regulation of the phenyl-propanoid pathway in leaves under long-term ozone exposure are some examples for repair and acclimation mechanisms (Cabane et al., 2012).
et al., 2005). This was based on the lack of O3 protection provided by higher ascorbate content
in the sensitive clone (NC-S) than in the tolerant clone (NC-R) which had lower ascorbate. 1.1.2.5. Plasma membrane
Activation of phospholipases by O3-induced H2O2 counteracts the oxidation of
membrane unsaturated fatty acid and results in phosphatidic acid, which decreases H2O2
-promoted programmed cell death (Zhang et al., 2003). Oxylipins derived from oxygenation of polyunsaturated fatty acids of plasma membrane works as key signaling molecules that mediate O3-stress control mechanisms. JA, the plant hormone is an example of oxylipin, that
gradually controls O3-induced programmed cell death in sensitive reactions making them
gradually less sensitive (Santino et al., 2013).
1.1.2.6. Containment of the visible O3-lesions
Two different hormonal mechanisms can be suggested to be responsible for the containment of lesion spread. Ethylene itself can contribute to the containment of the ethylene-dependent O3 lesion propagation since ethylene causes desensitization of the cells to its own
action (Wang et al., 2002). The ethylene receptor acts as a suppressor of ethylene signaling when it is not in contact with the hormone and this suppression is released after ethylene binds to the receptor. Thus, the O3-induced synthesis of new ethylene receptor proteins could lead to
decreased ethylene sensitivity and down-regulation of ethylene-dependent lesion spread. The down-regulation of ethylene synthesis seems to be slower or less efficient in the O3-sensitive
accessions (Kangasjärvi et al., 2005).
In the oxidative cell death cycle, jasmonic acid (JA) and methyl jasmonate (MeJA) protect tissues from ROS-induced cell death and thus counteract the effects of SA and ethylene. O3-induced cell death was inhibited when tobacco plants were pretreated with jasmonate with
signaling. This interaction is mutually antagonistic, since ethylene also inhibited JA-induced gene expression (Tuominen et al., 2004). JA affects ethylene signaling at the receptor level by decreasing ethylene sensitivity in a receptor-dependent manner. Therefore, JA induce up-regulation of an ethylene receptor isoform (Schenk et al., 2000).
At the tissue level, the balance between ethylene, SA, and JA signaling probably shifts temporally and spatially, so that the SA- and ET-driven processes prevail in the first cells affected by O3. Nevertheless, the further away from the site of initiation, the JA pathways
become increasingly more induced to overcome the first processes and containment of cell death follows (Kangasjärvi et al., 2005).
1.1.3. Wheat responses to O3 Stress 1.1.3.1. Wheat Importance
Wheat is a key crop for global food security, and the staple food for 30% of the world population, with 711 million tonnes produced in 2013, around 44% of which produced in Asia (FAO, 2016). It provides 21% of the food calories consumed globally and 20% of the protein to more than 4.5 billion people in 94 developing countries (Braun et al., 2010). In some countries, such as those in North Africa, per capita consumption of wheat is as high as 240 kg per annum, provides nearly 55% of the carbohydrates (Joshi et al., 2011). By 2050, the world will need 70% more food, nearly 4 billion tonnes of cereals, most of which are needed in developing countries (Shiferaw et al., 2013; Tester and Langridge, 2010).
1.1.3.2. Wheat Evolution
Wheat has an allohexaploid genome, consists of three closely related, diploid subgenomes, AA, BB and DD (Eversole et al., 2014). The A and B genomes diverged from a common ancestor around 7 million years ago. Genome D evolved from A and B genomes 1-2 million years later, through homoploid hybrid speciation (Marcussen et al., 1-2014). Around 0.36-0.5 million years ago, a tetraploid (AABB) species evolved through hybridization between two diploid species, the first is an einkorn wheat, similar to modern Triticum urartu
(genome AA), which resembles cultivated wheat - morphologically and in spike and seed development - much more than any of its other progenitors (Ling et al., 2013). The second diploid species is an extinct or undiscovered goatgrass species, closely related to the Sitopsis
section of Aegilops (genome BB) (Haider, 2013). This tetraploidization lead to the primitive form of domesticated tetraploid wheat, closely related to Triticum turgidum subsp durum, (genomes AABB). The allohexaploid bread wheat (Triticum aestivum L., 2n = 6x = 42 chromosomes; genomic code AABBDD) has evolved around 10 thousand years ago in the Fertile Crescent (Heun et al., 1997; Salamini et al., 2002). It was a result of an allohexaploidization between the primitive tetraploid wheat and a goatgrass (Aegilops tauschii), which contributed genome DD, and led to the formation of bread wheat (Marcussen et al., 2014).
1.1.3.3. Wheat Classes and Diversity
Wheat is a very diverse crop; varieties are visually classified according to the endosperm texture or hardness (soft or hard) and color (white or red), as well as, growth habit (winter or spring) (Thomason et al., 2009). Hardness is determined by the strength of binding between the starch granules and the protein network surrounding them. Soft wheat has loose binding between starch and protein matrix, due to lower protein percentage, usually less than 10%, which makes it easy to grind, and gives soft-texture flour, suitable for high dense products baked to low moisture content, such as cookies and crackers. Hard wheat has stronger binding between starch and protein matrix, due to higher protein content (about 12%) which makes it more difficult to grind, and produces a coarse-texture flour, with more broken starch granules with high water uptake and provides more fermentable sugars for yeast, and therefore more suitable for yeast-leavened bread, such as pan bread (Thomason et al., 2009).
The growth habit of wheat is determined by the vernalization requirement, and freeze and heat tolerance. Vernalization is extended exposure to cold temperatures at seedling stage that is required for flowering induction (Roll-Hansen, 1985). Winter wheat is more freeze tolerant and requires vernalization to flower, however, it is less heat tolerant, and extended heat stress could result in devernalization, and failure to switch from vegetative growth to flowering. Spring wheat is freeze sensitive, and suffers from “winter kill” which is the death of some stems when exposed to freezing stress. However, it more heat tolerant and flowers without vernalization.
In the United States, there are five main classes of bread wheat, [in addition to durum wheat (Triticum turgidum subsp durum)] (Thomason et al., 2009). These classes are:
2- Hard Red Winter Wheat (HRW): Suitable for semi-arid regions, such as the Plains states. It has a wide range of protein content (averaging about 12%) percent, usually used for pan bread, rolls, and general-purpose flour.
3- Hard Red Spring (HRS): Suitable for the Midwest. It is used for croissants, rolls, bagels and pizza crust. It is also used to improve flour blends for bread and Asian noodles.
4- Soft White: Suitable for the Pacific Northwest, low protein content (less than 10 %), usually used for making cakes, muffins, cookies and pastries.
5- Hard White: Suitable for Central and Western states, low protein content (less than 10 %), usually used for making cakes, muffins, cookies and pastries. The newest wheat class of the US, closely related to the HRW, usually used in Asian noodles, hard rolls, bulgur, and yeast breads.
There are increasing efforts aiming at breeding in HRW wheat varieties adapted to the mid-Atlantic region, to provide local sources of bread flour, and save the consumers the transportation costs of transferring the HRW from the plains states (Thomason et al., 2009).
1.1.3.4. Wheat sensitivity to O3
Wheat is one of the most sensitive crops to O3, at all growth stages (Singh and
Current O3 levels during wheat growing season are high enough to cause average global
yield reduction of 7-12 %, and this is expected to continue in the future to reach 9-18 % by 2030 (Avnery et al., 2011a; Avnery et al., 2011b; Feng and Kobayashi, 2009). However, these effects of O3 on wheat are not uniform across the world, as the highest yield reductions
are usually experienced in developing and heavily populated countries, such as China and India, and these reductions are expected to continue and even increase (Feng et al., 2012; Singh and Agrawal, 2010; Van Dingenen et al., 2009).
In general, wheat is known to be more sensitive than other cereal species (Selldén and Pleijel, 1995). Oat (Arena sativa L) is considered relatively insensitive (Pleijel et al., 1994), However, two spring oat varieties were found to have similar O3 responses to two spring wheat
varieties, and none of them appeared to be O3 sensitive (Hartikainen et al., 2012). On the
other hand, Barley (Hordeum vulgare L) is considered an O3-insensitive crop (Mills et al.,
2007; Selldén and Pleijel, 1995).
A meta analysis of the yield responses reported in 53 studies (1980 and 2007) did not find yield differences due to the growth habit (Feng et al., 2008). However, these authors came to this conclusion despite the fact that winter wheat showed similar negative responses at 20% higher concentrations than spring wheat, which should indicate that winter wheat is more tolerant to O3 than spring wheat. Meanwhile, spring wheat was more sensitive in terms of O3
effects on chlorophyll content, which might be an indicator for greater visible symptoms, which was not considered in this particular comparison of the meta-analysis. The reported O3
-induced stomatal closure in spring wheat and the reduction in chlorophyll content are indicators of an over-reaction to O3 stress through restricting gas exchange which might have resulted in
Because O3 in known to induce senescence, and the role of antioxidant capacity of the
tissue in tolerance, O3 symptoms on wheat usually develop first on the older leaves, which are
in the lower canopy, and from the tip of the leaf, where the older tissue is located. In addition, wheat yield is more sensitive to O3 exposure during grain filling stage than younger stages
(Fiscus et al., 2005).
Reported trends in ground level O3 concentrations in different regions around the world
(Cooper et al., 2014; Lee et al., 2014; Monks et al., 2015; Parrish et al., 2013) indicate that O3 will continue to be major challenge to wheat production all over the world. In China, O3
levels are increasing O3 throughout the entire wheat-growing season, and are expected to
continue increasing until 2050. In the western USA, winter and spring are experiencing increasing O3 levels, despite the decrease in summer, with peaks shifting more towards the
important wheat grain-filling stage near the end of the season, in late spring. Increased levels in winter, without major changes in the already high concentrations in spring, suggest that O3
stress on wheat grown in eastern USA is not decreasing. In Western Europe, ambient O3 levels
leveled off or decreased after 2000, at levels already high enough to impact wheat.
Yearly average baseline O3 at rural or remote sites of the northern hemisphere (29-49
ppb) increase to even higher levels (37-59 ppb) with increasing altitude from sea level (Cooper et al., 2014) indicates that wheat is O3 stressed nearly everywhere grown. This stress is even
higher near polluted areas where high O3 concentrations are common. Therefore, future wheat
varieties with O3 tolerance are critical for maintaining or increasing wheat yield.
O3 also affects wheat interactions with abiotic stresses such as drought. For example,
O3-induced ethylene interferes with stomatal closure and causes reduced drought tolerance
(Wilkinson et al., 2011). This results in increased yield reductions under combined drought and O3 stress when compared to drought alone (Xu et al., 2007). Cross-tolerance to O3 and
drought was not observed in wheat (Biswas and Jiang, 2011). In addition, O3 affects wheat
2015). This was due to increased NH4+ availability and decreased microbial ability to retain
NH4+, which increases nitrogen losses. However, these effects were less pronounced in O3
-tolerant than O3-senstive cultivars. Soil microbial communities in wheat fields are indirectly
affected by O3 treatment, and these effects are dependent on the O3 response of the wheat
cultivar grown (Li et al., 2012). When treated with O3, the tolerant varieties had more influence
on soil biota than sensitive varieties, which may have influenced soil organic matter decomposition, nutrient turnover, and probably greenhouse gas emission.
1.1.3.5. Factors limiting wheat breeding for O3 tolerance
Despite the necessity and the potential for breeding O3-tolerance wheat cultivars, the
breeding efforts in this critical area for global food security are very limited for the following reasons:
1.1.3.5.1. The lack of awareness that plants are more sensitive to O3 than humans are.
Although it has been known for several decades that plants are more sensitive to O3
than humans are, the implementations are yet generally recognized. A clear sign of this problem is the lack of O3 monitoring stations in agricultural areas in many parts of the world.
Monitoring O3 in agricultural rural areas is critical for quantifying effects on plants, animals,
and human in those areas, as O3 effects experienced in rural areas are higher than in urban
areas (Monks et al., 2015). Another sign is the absence of O3 monitoring parameters and
summaries routinely released that would reflect the effects on plants. Because wheat plants are exposed to O3 throughout their entire growing season, they accumulate O3 damage. Extended
periods of exposure require estimating O3 cumulative doses and communicating those
estimates with growers. Current air quality standards consider O3 levels below 50 to be within
1.1.3.5.2. The misperception of the scale of the problem for wheat production.
Wheat is one of the most sensitive crops to O3, at all growth stages (Singh and
Agrawal, 2010). Ozone effects on wheat plants are taking place at a global scale, however, they are more significant in developing countries, where food security is already endangered and more food production is needed (Shiferaw et al., 2013; Tester and Langridge, 2010). O3
transport ranges from local to hemispheric scales with increasing baseline O3 worldwide,
including areas where emission of precursors has been controlled and reduced. This dynamic indicates that E-O3 will continue to be a problem on a global scale (Cooper et al., 2014; Lee
et al., 2014; Monks et al., 2015; Parrish et al., 2013).
1.1.3.5.3. The expectation that active selection for O3 tolerance is not needed, as inadvertent or natural selection for O3-tolerance is taking place, as a result of having diverse wheat varieties encountered by O3 stress worldwide every season.
Unlike elevated CO2 that undergoes a gradual increase in atmospheric concentrations
due its long lifetime, E-O3 is a diverse problem both spatially and temporally, due to its short
lifetime, and the wide variety of factors controlling O3 concentrations over time and space.
These variations offset the consistent O3 selection pressure required for conventional breeding
procedures to make breeding progress (Ainsworth et al., 2008). In addition, wheat is an annual crop, harvested and planted every year, which does not allow natural selection to occur as in the case of perennials (Barnes et al., 1990). Furthermore, O3 symptoms on wheat could
be easily confounded by other stresses or misdiagnosed, which prevent growers and breeders from establishing the required connection between yield loss and O3 damage. Without
recognizing the cost of O3 sensitivity, growers and breeders will not be selecting varieties to
be grown or used for breeding based upon the O3 responses. This problem was confirmed by
stomatal conductance, and less mesophyll resistance to gas diffusion, and consequently higher photosynthesis (Biswas et al., 2008b; Biswas et al., 2013), which enhances O3 uptake
resulting in greater O3 sensitivity, especially when selection is conducted under inconsistent
O3 pressure (Ainsworth et al., 2008).
1.1.3.5.4. The lack of information on the phenotypic diversity of O3 responses among key breeding material.
Although differences in O3 responses were documented among wheat varieties (Biswas
et al., 2013; Mills et al., 2011; Wilkinson et al., 2011), there is a lack of information on O3
responses of key varieties currently used for agricultural production, and as parents for breeding future cultivars. Differential O3 responses are documented among wheat varieties
(Biswas et al., 2008b), indicating the importance of identifying the relative O3 responses of
varieties to be used in breeding programs, studying O3 effects on wheat performance, and the
interactions with other phytobiome components. Winter wheat should be considered as a source of O3 tolerance for spring wheat. There are reports from different parts of the world
showing increased O3-sensitivity in modern varieties of both spring (Barnes et al., 1990;
Pleijel et al., 2006; Velissariou et al., 1992), and winter wheat (Biswas et al., 2008a; Biswas et al., 2008b; Biswas et al., 2013). However, there is limited information on the difference in O3 responses between soft and hard red winter wheat cultivars, and the trends in O3 response
over time.
Screening the O3 responses of breeding material that is being used in breeding programs
for other significant traits (e.g. rust resistance, heat and drought tolerance) is an important approach to provide breeders with suitable breeding materials for O3 tolerance. It will enable
breeding varieties that are more resilient (tolerant to environmental stresses and resistant to pathogens at the same time). It will also compensate for the striking lack in efforts and resources currently devoted to breeding wheat for O3 tolerance (Ainsworth et al., 2008; Mills
by the Borlaug Global Rust Initiative (BGRI) (McIntosh and Pretorius, 2011) for breeding for O3 tolerance could be a unique model for breeding for O3 tolerance. Populations made by
crossing breeding lines bearing novel rust-resistance genes, with rust universal susceptibles genotypes of contrasting O3 response, are ideal material for such an effort.
1.1.3.5.5. The lack of information on the genetic nature and heritability of O3 tolerance.
Despite the observed differences in O3 responses among wheat varieties, and the
current consensus that O3 tolerance is a genetically controlled trait (Barnes et al., 1999; Li et
al., 2015; Singh and Jwa, 2013), there is a severe lack of information about the heritability of O3 tolerance in wheat, and the genetic gain the tolerance delivers (Burkart et al., 2013).
Currently identified QTLs or markers associated with O3 tolerance are limited to rice (Frei,
2015; Kim et al., 2004), Arabidopsis (Brosché et al., 2010) and soybean (Burton et al., 2016). There is only one report (Biswas et al., 2008a) on the source of O3 responses in
hexaploid wheat, which attributed the origin of O3 sensitivity in bread wheat to subgenome
DD. However, to our knowledge, there are no reports on the genetic control of O3 responses at
the chromosome level. A screening of the 21 monosomic lines (each of which lack one chromosome) of any wheat variety against its full genome could correlate O3 response
(sensitivity of tolerance) to one chromosome. Ideal materials for this purpose are Chinese Spring and its 21 monosomic lines. Since they were first developed in 1953, these monosomic lines were used to associate wheat traits to specific chromosomes (Sasaki et al., 1963). However, to our knowledge; such materials have never been used for identifying O3 genetic
control at the chromosome level.
Several studies used a doubled haploid population of the cross between Chinese Spring (low abscisic acid) and SQ1(low abscisic acid), in an attempt to identify QTLs associated with high yield under O3 stress (Quarrie et al., 2005a; Quarrie et al., 2006; Quarrie et al., 2007).


![Figure 6: Wheat canopy structure at seedling stage [13, 22 (Zadoks et al., 1974)] and adult-](https://thumb-us.123doks.com/thumbv2/123dok_us/1391153.1171829/54.612.102.530.79.538/figure-wheat-canopy-structure-seedling-stage-zadoks-adult.webp)