Deriving Performance Requirements and Test Cases with
the Performance Refinement and Evolution Model (PREM)
Chih-Wei Ho
Dept. of Computer Science, North Carolina State Univ.
890 Oval Drive, Campus Box 8206
Raleigh, NC 27695-8206, USA
+1-919-513-5082
[email protected]
Laurie Williams
Dept. of Computer Science, North Carolina State Univ.
890 Oval Drive, Campus Box 8206
Raleigh, NC 27695-8206, USA
+1-919-513-4151
[email protected]
ABSTRACT
Performance is one important attribute of a software system. To develop a software system of acceptable performance, the team needs to specify precise performance requirements, design appro-priate test cases, and use approappro-priate techniques to analyze the performance characteristics. However, the lack of a management framework for performance engineering may impair the effec-tiveness of the techniques. In this paper, we propose the Perform-ance Refinement and Evolution Model (PREM) as a performPerform-ance management framework. Based on the specification of quantita-tive measurement and workloads, PREM classifies performance requirements into four levels. At each level, we show what infor-mation should be included in the requirement, and what tech-niques can be used to estimate the performance. We use PREM on a Web-based student project to define the performance re-quirements. The process of performance requirements specifica-tion and example results are provided in this paper.
Keywords
Software performance engineering process; software performance testing; performance requirements.
1.
INTRODUCTION
Performance is an important non-functional requirement for a software system. A system that runs too slowly is likely to be rejected by all users. Failure to achieve some expected perform-ance level might make the system unusable, and the project might fail or get cancelled if the system performance objective is not met [34]. To build a software system with acceptable perform-ance, the development team needs to take performance into con-sideration through the whole development cycle [12]. Many models, techniques, and methodologies have been proposed to address software performance issues. A development team needs to apply several performance engineering techniques to achieve the desired performance level. However, the lack of a manage-ment framework for performance engineering may impair the effectiveness of the techniques. For example, if an unnecessarily complicated performance model is used during the early stages, the development team may need to make assumptions for the unknown but required factors for the model. The assumptions may render the model inaccurate or even useless. The develop-ment team needs to choose proper performance techniques, based on the understanding of the performance characteristics of the system, for the techniques to provide useful information.
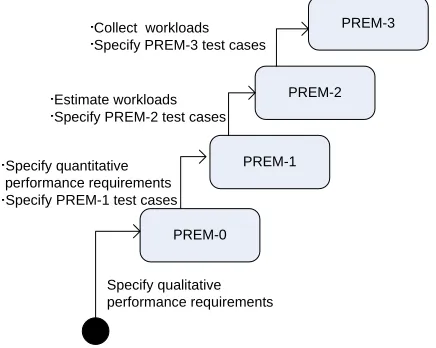
We propose the Performance Refinement and Evolution Model (PREM) as a framework to manage software performance devel-opment. PREM, as illustrated in Figure 1, is a four-level model. Quantitative requirements and workloads specifications distin-guish the levels. A higher level means the better understanding of the performance characteristics. At each level, the model de-scribes how the performance requirements and test cases are specified and proper approaches to analyze the performance. The development team can design the performance engineering proc-ess and organize the engineering activities based on PREM. With PREM, the development team starts from Level 0, specifying PREM-0 performance requirements. Then the team can apply the techniques from PREM-0 to understand the performance charac-teristics of the system. When more performance characcharac-teristics are obtained, the development team can go to a higher PREM level, until the specified requirements are good enough for the project.
In this paper, we use a Web application to demonstrate how PREM can be applied. The example used in this paper is iTrust, an on-line medical record system. We will use this example to demonstrate how the performance engineering process is de-signed, and the how the performance requirements are refined and evolved.
The rest of the paper is organized as follows. Section 2 provides the background and related work for requirements specification
PREM-1
PREM-0
PREM-2 PREM-3
Specify qualitative performance requirements Specify quantitative
performance requirements Specify PREM-1 test cases
Estimate workloads Specify PREM-2 test cases
Collect workloads Specify PREM-3 test cases
and performance testing; Section 3 describes PREM in detail; Section 4 shows how PREM is applied in iTrust; and Section 5 concludes the paper and points out future research directions.
2.
BACKGROUND AND RELATED WORK
This section provides related research and literatures for software performance requirements specification and testing. An overview of Software Performance Engineering (SPE) [31, 33], from which several techniques are adapted in this paper, is also presented in this section.
2.1
Requirements Specification
Performance requirements can be specified qualitatively or quan-titatively. Quantitative specifications are usually preferred be-cause they are measurable and testable. Basili and Musa advocate that quantitative specification for the attributes of a final software product will lead to better software quality [5]. For performance requirements, Nixon suggests that both qualitative and quantita-tive specifications are needed, but different aspects are empha-sized at different stages of development [23]. At early stages, the development focus is on design decisions, and brief, qualitative specifications suffice for this purpose. At late stages, quantitative specifications are needed so that the performance of the final system can be evaluated with performance measurements. PREM follows the same character. At Level 0, requirements are fied qualitatively, while requirements of higher levels are speci-fied quantitatively and with more details.
Most software requirements are specified with natural languages [10]. However, requirements specified in a natural language can be imprecise [6, 7]. Some approaches have been proposed to detect imprecision in natural language specifications (for example, [11]) or to prevent the introduction of imprecision (for example, [25]). Several formal specification languages, such as the Z nota-tion [16] and Vienna Development Method [15], are also avail-able. Although not adopted widely in the industry, formal speci-fications are precise, and the specified behaviors can be proven mathematically. In PREM, we do not propose a new language construct for requirements specification. Instead, we point out the necessary elements for the specification. After the elements are specified for a requirement, they can be transformed to a language or presentation to the team’s preference.
2.2
Performance Testing
Specified workloads, or a collection of requests, need to be generated for performance testing. After the workloads are generated, performance measurements can be collected. The system complies with the performance requirements if the performance measurements meet the expectations stated in the requirements specification.
Average workloads and peak workloads are especially important for software performance testing [35]. Performance testing with average workloads shows how the system performs under regular usage from the users’ perspective. Performance testing with peak workloads provides information about performance degradation under heavy usage. For a software system, operational profiles can be used as average workloads [2]. An operational profile of a software system is a complete set of the operations the system performs, with the occurrence rates of the operations [21]. The
occurrence rates can be collected from the field usage, or obtained from existing business data, or from the information of a previous version or similar systems [22].
At early stages of development, operational profiles or workload data may not be available. In this case, the development team can estimate the workload. SPE, described in Section 2.4, provides a systematic way to estimate the system workloads and performance by building and solving performance models.
Quantitative performance measurements and workloads specifications are essential for software performance requirements and testing. Therefore, in PREM, we use the specification of quantitative measurements and workloads to assess the level for performance requirements and testing methods and to categorize performance analysis activities.
2.3
Performance Testing Tools
JUnit1 is a popular unit testing framework. Beginning from Ver-sion 4 which was released in 2006, JUnit provides a “timeout” parameter to support performance-related testing. A test method with a timeout parameter can only pass if the test is finished in the specified amount of time. Figure 2 shows an example of a test method with a timeout parameter. However, JUnit does not pro-vide any functionality to generate workloads for performance testing.
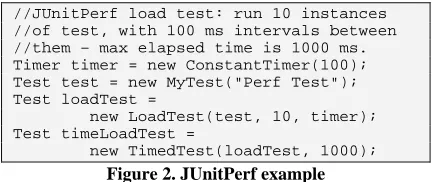
JUnitPerf2 is a library of JUnit decorators that perform both timed and load tests. Figure 3 shows an example of JUnitPerf perform-ance testing code. In the JUnitPerf example, the time between every two test instances is fixed. JUnitPerf can also generate a workload with a uniform distribution.
These JUnit-based test frameworks provide an easy, program-matic way to write performance test cases. However, JUnit-based test frameworks may be insufficient when a complex workload or performance scenario is favored. To design more complicated performance test cases, one should consider more advanced per-formance testing tools, for example, script-based (e.g., The Grinder3 [36]), user action recording and playback (e.g., Apache
1
http://www.junit.org
2
http://www.clarkware.com/software/JUnitPerf.html
3
http://grinder.sourceforge.net/
JUnit 4 timed test: only passes if it //finishes in 200 ms.
@Test(timeout=200) public void perfTest() {
//test scenario ...
}
Figure 3. JUnit timeout parameter example
//JUnitPerf load test: run 10 instances //of test, with 100 ms intervals between //them – max elapsed time is 1000 ms. Timer timer = new ConstantTimer(100); Test test = new MyTest("Perf Test"); Test loadTest =
new LoadTest(test, 10, timer); Test timeLoadTest =
new TimedTest(loadTest, 1000);
JMeter4 or OpenSTA5) or other commercial, high-end tools. Ad-vanced performance testing tools are usually designed with a distributed architecture where workloads are generated by multi-ple machines. This feature allows heavy workloads to be gener-ated by a limited number of resources.
2.4
Software Performance Engineering (SPE)
SPE [31, 33] is an approach to integrate performance engineering into software development process. In SPE, performance models are developed early in the software lifecycle to estimate the per-formance and to identify potential perper-formance problems. To make SPE effective, the authors of SPE suggest three modeling strategies [33]:
y Simple-Model Strategy: Early SPE models should be sim-ple and easy to solve. Simsim-ple models can provide quick feedback on whether the proposed software is likely to meet the performance goals.
y Best- and Worst-Case Strategy: Early in the development process, many details are not clear. To cope with this uncer-tainty, SPE uses best- and worst-case estimation for the fac-tors (e.g., resource constraints) that have impact on the per-formance of the system. If the prediction from the best-case situation is not acceptable, the team needs to find alternative design. If the worst-case performance is satisfactory, the de-sign should achieve the performance goal, and the team can proceed to the next stage of development. If the result is somewhere in between, the model analysis provides informa-tion as to which part of the software plays a more important role in performance.
y Adapt-to-Precision Strategy: Later in the development process, more software details are obtained. If the informa-tion has impact on the performance, it can be added to the SPE models to make the models more precise.
SPE uses two types of models: software execution model, and system execution model. The software execution model character-izes the resource and time requirements. Factors related to multi-ple workloads, which can affect the software performance, are specified in the system execution model. The software execution model can be easily built, and provides quick feedback on soft-ware performance. On the other hand, the system execution model provides analytical results of the system performance un-der multiple workloads.
In SPE, execution graphs are used to present software execution models. An execution graph specifies the steps in a performance scenario. Execution graphs are presented with nodes and arcs. A node presents a software component, and an arc presents transfer of control. The time required for the step is specified with each node. Graph reduction algorithms are used to solve the model and calculate the time needed for the performance scenario. The model presentation and the graph reduction algorithms are defined in Smith and Williams’ work [33].
The results from the software execution models are used to derive the parameters for the system execution models. The system
4
http://jakarta.apache.org/jmeter/
5
http://www.opensta.org/
execution models describing the hardware and software compo-nents in a system are based on queueing network models. Per-formance metrics, including the resource utilization, throughput, and waiting time for the requests, can be evaluated from the sys-tem execution models. Automatic tools are available for model analysis (for example, SPE·ED [32]).
Table 1 shows how SPE models and techniques fit in PREM. SPE focuses on quantitative performance evaluation, so no PREM-0 techniques are suggested. Performance requirements and testing approaches are not emphasized in SPE, either.
3.
PERFORMANCE REFINEMENT AND
EVOLUTION MODEL (PREM)
In this section, we provide an overview of PREM6. PREM pro-vides guidelines on the level of detail needed in a performance requirement, both in specification and testing. Performance engi-neering techniques are also classified in proper PREM levels. Therefore, the development team can analyze the performance using appropriate techniques.
3.1
Model Description
The structure of PREM is shown with a UML class diagram in Figure 4. The elements in this structure are explained as follows.
PREM: PREM is the model we discuss in this paper.
PREM Level: In PREM, performance requirements specifica-tions, testing, and activities are classified in four levels, starting from Level 0. A requirement or test case in a higher PREM level specifies more performance characteristics of the software system. To analyze performance specified at a certain PREM level, the development team can apply the activities at the same level.
6
PREM is based upon our previous work that was called the Per-formance Requirements Evolution Model [14].
Figure 4. The meta-model of PREM Table 1. PREM levels for SPE models and techniques
PREM-0 N/A
Starting Criteria: A PREM level has one or more starting crite-ria. The starting criteria show the required properties of the re-quirements before the activities at the PREM level can be applied.
Goal Criteria: A PREM level has one or more goal criteria. The goal criteria show the required properties of the requirements for them to be classified as being at a certain PREM level. If a per-formance requirement satisfies all the goal criteria of PREM level n, the requirement is called a PREM-n requirement. A perform-ance test case specified based on a PREM-n requirement is called a PREM-n test case. A performance analysis activity for PREM-n requirements is called a PREM-n activity.
Activity: When a requirement satisfies all the starting criteria of a PREM level, and the development team decides to achieve the PREM level, the team shall apply some of the activities for the level. After the selected activities are successfully performed, the performance requirement specification and related test cases shall achieve the goal criteria of the PREM level. This paper also sug-gests several techniques for each activity.
Performance Type: A performance type is an attribute that is used to describe the system performance. Currently, PREM is designed to work with the following performance types:
y Response time is the time requirement for the completion of an operation (e.g., transaction process time);
y Throughput presents the quantity of operations that need to complete in an amount of time (e.g., number of transactions per second).
Testing Approach: Performance testing shows whether the soft-ware system achieves the desired performance goals. The PREM testing approach shows how test cases shall be designed to reflect the performance requirement of a PREM level.
Specification Part: Specification parts are the elements that are used to specify requirements. A specification part may be manda-tory or optional. After the specification parts are identified for a requirement, transformation rules may be applied to generate presentations for the requirement. In some presentations, short names are more appropriate than full descriptions. Therefore, a specification part may be assigned with a shorter name, or alias.
Presentation: A presentation shows a requirement in a particular form that is transformed from the specification parts with a trans-formation rule. In this paper, we provide transtrans-formation rules for two important presentations: natural-language-based requirements specification, and performance test case. The following example shows how the transformation works.
At PREM Level-1, the response time requirement has three speci-fication parts: preparation, event, and time. To specify the re-sponse time requirement of an operation, these parts describe the preconditions that must hold before the operation, the event that initiates the operation, and the response time constraint for the operation. A possible combination of the parts is shown as fol-lows with the aliases in the parentheses.
preparation: (OpenLogInPage) the user opens the Log In page
event: (Submit) the user enters the valid user name and password, and clicks the Submit button
time: three seconds
A template is used for the natural language transformation rules. To generate a natural-language-based specification, the
specifica-tion parts in the template shall be replaced with corresponding contents. For PREM-1 response time requirements, the following template is used:
[After preparation, ]when event, the response time shall be less than time.
Applying the specification parts in the template, we can have a natural-language-based requirements specification:
After the user opens the Log In page, when the user enters the valid user name and password, and clicks the Submit button, the response time shall be less than three seconds.
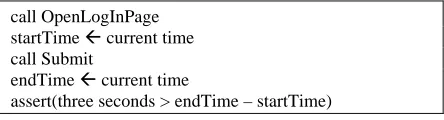
The test case transformation is done in the same manner. In this paper, the output of test case transformation is presented in pseudo code. A template, as shown in Figure 5, is used for PREM-1 test case transformation for response time requirements.
After applying the transformation rule, a test case for this re-quirement is generated. Figure 6 shows the generated test case.
The transformation rules shown in this paper are intended for general purposes. A development team should define specific transformation rules for the application domain. For example, test case transformation can be designed so that the result of transfor-mation is the script that can be used with the performance testing tool. The rest of this section presents PREM using this structure.
3.2
PREM Level-0
Starting Criteria: Functional requirements are specified in re-quirements documents.
Goal Criteria: Qualitative performance requirements are specified in requirements documents.
Testing Approach:
Qualitative evaluation.
PREM-0 represents performance requirements with only qualita-tive, casual descriptions. An example of PREM-0 requirement is: The authentication process shall be completed quickly. PREM-0 requirements are essentially placeholders for future work in per-formance requirement specification. By specifying PREM-0 requirements, customers identify the operations for which per-formance matters. PREM-0 requirements are the starting point which customer and developer will refine or evolve to more pre-cise specifications via PREM-1 or higher requirements.
call preparation.alias startTime Å current time call event.alias
endTime Å current time
assert(time > endTime – startTime)
Figure 5. An example of transformation rule
call OpenLogInPage startTime Å current time call Submit
endTime Å current time
assert(three seconds > endTime – startTime)
3.2.1
Activities
The main activity for PREM-0 is to identify performance re-quirements. Ideally all the functionalities of a software system should have good performance and consume the least amount of resources. However, in reality, time and budget constraints make this goal infeasible. Additionally, performance goals might con-flict with other requirements. For example, to make a functional-ity run faster, the development team might use an implementation that consumes more memory. Therefore, the first step toward software performance is to identify which parts of the system require more performance focus. The development team should focus on the requirements for which the performance is sensitive to the users. For example, product search should be responsive for an e-commerce Web site. On the other hand, the efficiency of off-line report generation is not visible from the users’ perspec-tive, and therefore the performance concern is less significant.
Qualitative PREM-0 requirements can be gathered from the dis-cussion with stakeholder such as the user representatives or the marketing department. The development team may ask the users to prioritize the requirements with respect of performance and performance types. The prioritization information shows the parts of the system of which the performance is important to the users.
Another PREM-0 requirements management approach is the Per-formance Requirements Framework (PeRF) [23]. Based on the Non-Functional Requirements Framework [24], PeRF provides a systematic way to organize and refine performance requirements, resolve conflicts among requirements, and justify requirements decisions. The development team can use PeRF to decide whether to move toward or away from a requirement.
3.2.2
Specification Parts
PREM-0 requirements help the development team focus on the appropriate performance requirements. At this level, brief, high-level performance requirements are sufficient for the team to make initial requirements decisions. A free-form, natural-language-based specification should be used for PREM-0 re-quirements. Therefore, we do not provide the specification parts for PREM-0 requirements. However, identifying PREM-0 re-quirements helps the team to find out the values for specification parts at higher PREM levels.
3.3
PREM Level-1
Starting Criteria: Performance requirements are defined quali-tatively in requirements documents.
Goal Criteria: y Quantitative performance requirements are specified in requirements documents.
y Appropriate test cases are specified. Testing
Approach:
Run the test scenario once and then take per-formance measurement.
PREM-1 represents performance requirements with quantita-tively-measurable expectations. An example of PREM-1 re-quirement is: After the user enters the user name and password, and clicks the Submit button on the Log In page, the response time for authentication and Main page rendering shall be within three seconds. Quantitatively measurable specification is the first step to test the requirement in an objective way.
3.3.1
Activities
The focus of PREM-1 is to specify quantitative requirements and expected performance level for the functionalities of the system. The steps for quantitative performance requirements specification are provided as follows.
3.3.1.1
Specify Performance Scenarios
A performance scenario describes specific steps involved in a particular software execution that demonstrates certain perform-ance characteristics of the software system. If use cases are em-ployed to describe the requirements, a scenario is an end-to-end sequence or flow specified in a use case. Performance scenarios are developed from performance requirements identified at PREM-0.
One presentation for performance scenarios is UML sequence diagrams with features from message sequence chart (MSC) [17]. The MSC extension allows the development team to specify op-tional steps, loops, and alternative steps in a sequence diagram. The sequence diagram plus MSC extension presentation is used in SPE. Because sequence diagrams and collaboration diagrams are semantically equivalent, performance scenarios can also be pre-sented with collaboration diagrams. However, sequence diagrams emphasize the time-ordering of the flow of events, and are more suitable for performance modeling [33].
3.3.1.2
Choose Performance Metrics
Before a quantitative expectation can be specified, the develop-ment team needs to choose a quantitative metric. Table 2 shows typical performance metrics for different performance types.
3.3.1.3
Specify Quantitative Requirements
After the performance scenario and metrics are determined, the next step is to specify quantitative expectations. Anecdotal ex-periences (e.g., [4, 29, 30]), although not validated, can offer some hints of how well a software system should perform. The development team should have more realistic estimations for the system under development, based on their own team’s experi-ences and the environments for the software.
Several types of models can be used to estimate the performance at PREM Level 1. Bertolino and Morandola show how UML sequence diagrams and deployment diagrams with proper annota-tion can be used to estimate the performance of a component-based system [8]. The execution graph described in SPE also provides PREM-1 estimation. A detail description of execution graph and reduction rules are provided in [31, 33]. In PREM-1 performance models, a performance scenario is broken into
sev-Table 2. Typical performance metrics (adapted from [13])
Performance
Type Performance Metrics
Response Time
Transaction processing time Page rendering time Query processing time
Throughput
eral small steps. Estimating the response time for each small step is usually easier than estimating the response time for the whole scenario. Additionally, performance test cases can be developed for the small steps. The “performance testing for the small” can help the development team identify the locations of performance problems.
3.3.2
Specification Parts
A response time requirement should point when the measurement is started being taken. Therefore, we use the following three parts to describe a PREM-1 response time requirement of an operation:
preparation: The phrases that describe the preconditions that must hold before the operation can be carried out. The preparation
part is optional.
event: A phrase that describes the event that initiates the operation on which the response time measurement is taken. Response time measurement starts as soon as the events have happened.
time: The constraint for the time needed to complete the opera-tion.
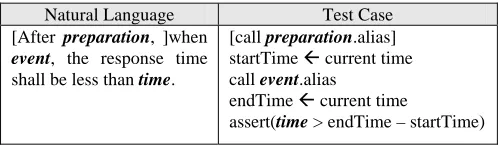
The transformation rules for PREM-1 response time requirements are shown in Table 3. The optional components are surrounded
with square brackets.
For a concurrent system, the specification of throughput is am-biguous if the workloads are not specified. Therefore, we do not provide the specification parts for PREM-1 throughput require-ments. To specify throughput requirements and test cases for concurrent systems, PREM-2 specification parts and transforma-tion rules should be used. However, in a system where tasks are processed sequentially, throughput is the reverse of response time. In such systems, throughput requirements can be translated to response time requirements.
3.4
PREM Level-2
Starting Criteria: Quantitative performance measurements are specified with the requirements.
Goal Criteria: y Estimated average or peak workloads are specified with the requirements in the re-quirements documents.
y Appropriate test cases are specified. Testing
Approach:
Generate asynchronous requests according to the specified workloads. After the requested operations are completed, take performance measurements.
PREM-2 performance requirements and test cases are specified with estimated workloads. Workloads specification describes the frequency of the requests for the functionalities of a software
system. From the users’ perspective, a software system has dif-ferent performance when the software is under difdif-ferent work-loads. Therefore, workloads specification is required for concrete performance requirements. An example of PREM-2 requirement is: After the user opens the Log In page, the user enters the valid user name and password, and clicks the Submit button. On aver-age, this scenario happens 20 times per minute. After the user opens the Log In page, when the user enters the valid user name and password, and clicks the Submit button, 80% of the response time shall be less than 3 seconds. PREM-2 requirements can be specified with either or both the peak or average workload estima-tions.
3.4.1
Activities
Workloads can be estimated based on experience or observation. However, the process to derive experience- or observation-based estimation tends to be ad-hoc. Joines et al. develop several work-sheets in [18] for performance estimation and testing. Some of the worksheets are used to estimate the workloads. Although based heavily on experience and observation, the worksheets list the necessary input data (for example, estimate of number of user visits per day and number of hours per day the system is used) and the possible source for the data. Compared to the ad-hoc approach, the worksheet approach is more systematic.
Sometimes the workloads information for a previous release or other similar systems is available. Such information is a good source of workloads estimation for the system under development. Although the system under development may not have exactly the same functionalities as the existing systems, the existing data can give us a good picture of how the system might be used. For example, if a new functionality is designed to replace two func-tionalities in the previous release, good workload estimation for the new functionality is the summation of the workloads of the two original ones. If the new functionality is not related to any-thing in the previous release, other estimation approaches can still be used.
If no workloads data from a previous release are available, we may still get the information from several alternative sources. For example, market or industrial research reports are available from the government7 or private research companies. Those research reports can provide a rough picture of how the software system might be used. The marketing or customer service department in the client organization might have similar data.
Several performance models can be used to evaluate the perform-ance under estimated workloads. For example, queueing network [19], where a software system is modeled as a network of servers and queues, is the basis for system execution model in SPE [33]. Some studies demonstrate the possibility of transforming software architecture specifications to queueing-network-based models. For example, Petriu and Shen propose a method to generate lay-ered queueing networks from UML collaboration and sequence diagrams [27]; Cortellessa and Mirandola demonstrate an incre-mental methodology to transform sequence diagrams and de-ployment diagrams to extended queueing network models [9];
7
For example, the market research reports available at the U.S. Government Export Portal (http://www.export.gov/ marketresearch.html).
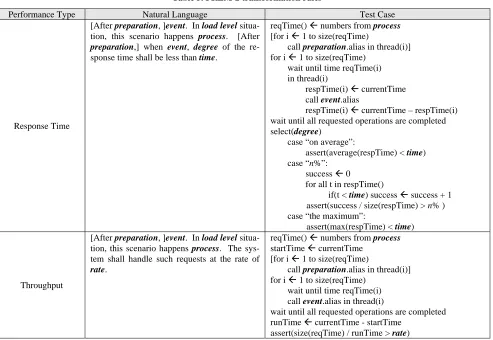
Table 3. PREM-1 response time transformation rules
Natural Language Test Case [After preparation, ]when
event, the response time shall be less than time.
[call preparation.alias] startTime Å current time call event.alias
endTime Å current time
Table 5. PREM-2 transformation rules
Performance Type Natural Language Test Case
Response Time
[After preparation, ]event. In load level situa-tion, this scenario happens process. [After
preparation,] when event, degree of the re-sponse time shall be less than time.
reqTime() Å numbers from process
[for i Å 1 to size(reqTime)
call preparation.alias in thread(i)] for i Å 1 to size(reqTime)
wait until time reqTime(i) in thread(i)
respTime(i) Å currentTime call event.alias
respTime(i) Å currentTime – respTime(i) wait until all requested operations are completed select(degree)
case “on average”:
assert(average(respTime) < time) case “n%”:
success Å 0 for all t in respTime()
if(t < time) success Å success + 1 assert(success / size(respTime) > n% ) case “the maximum”:
assert(max(respTime) < time)
Throughput
[After preparation, ]event. In load level situa-tion, this scenario happens process. The sys-tem shall handle such requests at the rate of
rate.
reqTime() Å numbers from process
startTime Å currentTime [for i Å 1 to size(reqTime)
call preparation.alias in thread(i)] for i Å 1 to size(reqTime)
wait until time reqTime(i) call event.alias in thread(i)
wait until all requested operations are completed runTime Å currentTime - startTime
assert(size(reqTime) / runTime > rate) Menascé and Gomaa present an approach to derive performance
models for client/server systems from class diagrams and collabo-ration diagrams [20]. Petriu and Woodside also show that layered queueing performance models can be generated from software requirements specified with scenario models, including activity diagrams, sequence diagrams, and use case maps [26]. A sum-mary of performance models is provided in [3].
3.4.2
Specification Parts
In addition to PREM-1 specification parts, the following parts are necessary to describe a PREM-2 response time requirement:
load level: A description of whether the peak or average work-loads are used. The value can be either “peak load” or “average.”
process: A series of ascending numbers that describe the instances of request arrival time for the system. Because different proc-esses require various parameters, specialized specification parts and transformation rules need to be specified for each type of process. For example, Table 4 shows the specification parts and transformation rules for a Poisson process.
degree: A phrase describing of the degree how the time constraint is satisfied. The value of degree can be one of following: “the average”, “n%”, or “the maximum.”
For throughput requirements, we need to specify the following parts:
preparation and event: As described in PREM-1 response time specification parts.
load level and process: As described in PREM-2 response time specification parts.
rate: The expected throughput of the requirement.
The transformation rules for PREM-2 performance requirements are shown in Table 5. The specification part load level is not used in the test case. However, in natural-language-based specification,
load level makes the specification clearer by showing whether the system is under the peak or average load. In the test case trans-formation rules, variables with parenthesis, for example, reqTime(), are arrays with the index starting from 1. The function “size” returns the size of the array; “average” returns the average of the numbers in the array; and “max” returns the largest number in the array. A special array, thread(), contains the threads that are used to create the concurrent requests. preparation and event
can be called in a thread contained in the thread() array.
3.5
PREM Level-3
Table 4. Specification parts and natural-language-based transformation rule for Poisson process
Spec. Parts Transformation Rule
t: the amount of time for performance testing
m: the mean value of the number of requests during t
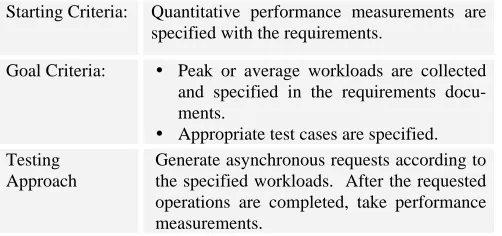
Starting Criteria: Quantitative performance measurements are specified with the requirements.
Goal Criteria: y Peak or average workloads are collected and specified in the requirements docu-ments.
y Appropriate test cases are specified. Testing
Approach
Generate asynchronous requests according to the specified workloads. After the requested operations are completed, take performance measurements.
PREM-3 represents quantitative performance requirements with workloads from collected data. An example of a PREM-3 re-quirement is “The system is running under the heaviest possible workloads defined in Appendix IV. The average response time for displaying the promotional message on the mobile tablet after a customer enters a lane where the promotional items are located shall be below 1 second.” At PREM Level-3, the workloads de-scription defines the workloads for different types of requests. If the description is too lengthy or complicated to be specified with the requirement, it can be moved to a separate document, such as Appendix IV in this example.
PREM-3 and PREM-2 share the same starting criteria. As soon as quantitative PREM-1 requirements are specified, the development team is ready to perform PREM-2 and PREM-3 activities. If PREM-3 is needed for a project, the development team can de-velop PREM-2 models and collect PREM-3 data at the same time. However, this does not suggest that a team should skip PREM Level 2. PREM-3 activities take much more time than PREM-2 activities. If PREM Level 2 is skipped, the requirements will stay at Level 1 until 3 data are collected. By applying PREM-2 activities, the team can have early estimation of the system per-formance. The only exception might be the situation where the workloads information from a very similar system, perhaps an earlier release of the system under development, is already avail-able. In such a situation, the existing data can be used directly, and PREM-2 can be skipped.
3.5.1
Activities
To test or analyze the average performance for a system, a work-load that represents the usage of the system needs to be generated. In a software system, the operational profile [21] can be used to describe the workload of the system [35]. An operational profile of a software system is a complete set of the operations the sys-tem performs, with the occurrence rates of the operations [21]. To collect operational profiles, an internal event counter needs to be implemented with the software [33]. Furthermore the time and duration for data collection need to be taken into consideration [35]. The data for peak and average workloads are available in different timeframes. Experiences show that, the time required to workload data collection ranges from two to twelve months [1].
If the operational profiles from a previous release or similar ap-plications are available, with a little modification, they can be used for the software under development. For this purpose, the team can benefit if minimal functionality is built into the software to collect operational profile information.
If no existing data are available, the development team can de-velop a quick prototype and collect operational profile data from
the prototype. For operational profiles, we should collect at least, for each incoming request, the time and the type of the request. Depending on the application, other data might also be relevant. For example, if a user can access an application from the local or external network, the location of the user should be recorded. The development team needs to determine the time and duration of data collection. For example, a shopping Web site may need to collect year-round data in order to understand the usage of the Web site during the shopping seasons, weekends, and other time. Because data collection requires time, the prototype should be provided as early as possible. In addition to prototypes, we can also use information from intermediate releases, such as alpha or beta ones. However, we need to know who the users are for the intermediate releases, and how different they use the system com-pared to the target customers [22].
3.5.2
Specification Parts
PREM-3 performance requirements specification and testing are similar to those of PREM-2. PREM-3 and PREM-2 requirements have the same specification parts. However, in PREM-3, work-loads for multiple types of requests are specified. For each type of request, we need to specify zero or more preparation, one
event, and one process. A natural language transformation rule for PREM-3 workloads specification is provided in Figure 7. The rest part of the requirement is similar to that at PREM Level-2. Similarly, in PREM-3, a multi-thread test case is used to generate the requests. The test case transformation rule can be adapted and modified from PREM-2.
4.
AN ILLUSTRATIVE EXAMPLE: iTrust
In this section, we demonstrate how PREM is used to design the performance engineering process for iTrust8. iTrust is a Web-based medical records application. iTrust was a student term project for a graduate-level Software Testing and Reliability course at North Carolina State University (NCSU). The course has a learning objective of combining appropriate testing tech-niques for the development of a reliable and secure system. The functional requirements of iTrust are specified by a surgeon in Pennsylvania. Use cases are used to describe the functional documents. The length of the functional requirements document is six pages, with eleven use cases. A complete set of functional requirements can be found at the project Web site. The project development time lasted three months, divided into five small iterations.
8
http://agile.csc.ncsu.edu/iTrust
The system is running in load level situation. [After prepa-ration1,] event1. This scenario happens process1. [After preparation2,] event2. This scenario happens process2. …
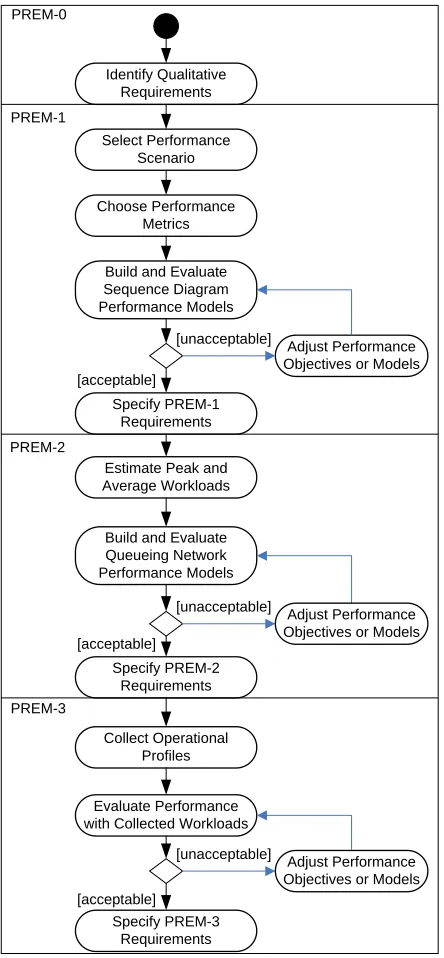
We use PREM to design the performance engineering process for iTrust, as shown in Figure 8. In this process, we assume that an automatic tool is used to transform the specification parts into performance requirements specifications and test cases. There-fore, the steps for test case specification are not shown in the process. The performance goal in this example is, for the soft-ware system, to pass PREM-3 test cases. The process is an exam-ple of PREM imexam-plementation. The development team should choose familiar techniques that are suitable for the project and customize the process. The rest of this section shows how the techniques in the process are applied. In this example, we assume
that iTrust is deployed in a virtual hospital. The medical workers access the system from the local area network, while the patients access the system from the Web. The performance requirements specifications are available at the project Website.
4.1
Identify Qualitative Requirements
Because of the small size of the requirements, we did not use PeRF to identify qualitative requirements. We decided to specify response time requirements for each use case, because response time is the most obvious performance attribute for the users. The only exception is the use case which specifies the format of log for each use case. We refer to this use case as Logging. For the Logging use case, we plan to specify throughput requirements.
In the following subsections, we use the View Records use case as the example to show how the performance requirements are de-rived. At this step, the performance requirement is specified as The system shall provide quick feedback when the user views the medical records.
4.2
Build and Evaluate PREM-1 Model
When requirements are specified with use cases, an end-to-end flow may be used for a scenario. In iTrust, each use case has several alternative subflows and exception subflows. The alterna-tive subflow shows an execution option for the use case, and the exception one shows an exception handling process if something goes wrong. If an alternative subflow has n exception subflows, where n is greater than or equal to 0, n + 1 scenarios can be iden-tified from this alternative subflow. The number of scenarios that can be identified from a use case is the sum of the number of sce-narios that can be identified from each alternative subflows in-cluded in the use case.
In the View Records use case, both a patient and a licensed health care profession (HCP) can view the medical records. The use case is specified with two subflows based on the role of the user. Between the two roles that may access this functionality, the li-censed HCP needs to view the records on a regular basis. There-fore, the licensed HCP viewing records is used as a performance scenario. The scenario with the response time estimation for each step is presented in a sequence diagram in Figure 9. In the sce-nario, the HCP sends the request to the Web server by confirming the patient’s ID for the records. The Web server then queries the medical records for the patient from the database, renders the Records Page with the query results, and forwards the page to the HCP. Summing up the time required for each step, the response time for the whole scenario is 1.5 seconds. Therefore, a PREM-1
Identify Qualitative Requirements
Select Performance Scenario
Choose Performance Metrics
Build and Evaluate Sequence Diagram Performance Models
Specify PREM-1 Requirements
Estimate Peak and Average Workloads
Build and Evaluate Queueing Network Performance Models
Specify PREM-2 Requirements
Collect Operational Profiles
Evaluate Performance with Collected Workloads
Specify PREM-3 Requirements
Adjust Performance Objectives or Models
Adjust Performance Objectives or Models
Adjust Performance Objectives or Models PREM-0
PREM-1
PREM-2
PREM-3
[acceptable]
[unacceptable]
[acceptable]
[acceptable]
[unacceptable]
[unacceptable]
Figure 8. The performance engineering process for iTrust
specification parts for the View Records use case are:
preparation: HCP enters the patient’s ID, and reaches the Con-firm page
event: HCP clicks the Confirm button
time: 1.5 seconds
4.3
Build and Evaluate PREM-2 Model
Because no existing data are available, we need to estimate how often the system receives a View Records request from HCP. After some observation, we find out that, on average, a HCP fin-ishes the examination in ten minutes. During the examination, the HCP needs to view the record once. If there are always 100 HCP on duty, the average request rate for View Records by a HCP is
17 . 0 100 600 /
1 × = requests per second.
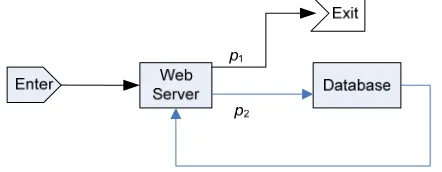
The response time for View Records can be evaluated with a queueing network model, which is shown in Figure 10. In the model, each rectangle represents a server with a queue. To solve the model, either manually or with an automatic tool, we need to derive the following parameters from the sequence diagram
model.
y Flow probabilities after the Web server: In the HCP Views Records scenario, the Web server is responsible for receiving the requests from HCP, rendering the Records page, and for-warding the Records page to HCP. After the Web server fin-ishes any of these jobs, one of three things might happen: the Web server queries the records from the database; the Web server inserts a log to the database; or the Records page is for-warded to the HCP and the scenario ends. Therefore, after the job leaves the Web server, the probability that the job flows to the database server (p2) is 0.67, and the probability that the
job exits the system is (p1) 0.33.
y The throughput of the Web server: Out of the three types of jobs performed by the Web server, two of them take 200 ms, and the other takes 300 ms. On average, the Web server fin-ishes a job in 2/3×200+1/3×300=700/3 ms = 7 / 30 sec-onds. Therefore, the throughput for the Web server is 30 / 7 = 4.29 jobs per second.
y The throughput of the database server: The average time for a database server to finish a job is 0.4 seconds. Therefore, the throughput for the database server is 2.5 jobs per second.
After these parameters are determined, we may solve the model with a tool or with manual computation. The solution shows that the average waiting time for this queueing network is 1.88 sec-onds. The formulas for solving the queueing network model are provided in the Appendix. The books by Ross [28] and Kleinrock [19] provide the mathematical background for solving various
types of queueing network models. If the estimated performance is acceptable, the PREM-2 specification parts for this response time requirement are:
preparation: As specified at PREM-1
event: As specified at PREM-1
Time: 1.88 seconds
load level: average
process: Poisson (t = 500 seconds, m = 85)
degree: the maximum
For the queueing model to have a solution, the request rate for View Records by a HCP must be lower than 1.23 requests per second. This may be used as peak load estimation. If the peak load or the estimated performance based on the peak load is not satisfactory to the client, the throughput of the Web or database servers needs to be improved. The improvement can be achieved by, for example, optimizing the implementation or upgrade the hardware.
4.4
Collect Operational Profiles
Before the implementation of iTrust, we have decided to go through all PREM Levels. Therefore, operational profile data collection mechanism is built with the system. When the server receives a request, the user ID, the time and type of the request is logged to the database. The collected data are used in the queue-ing network models periodically to make sure the evaluated per-formance is still within the acceptable range. At the end of data collection, if the estimated performance is acceptable, the col-lected data are used in PREM-3 requirements specifications.
4.5
Potential Pitfalls
As we were specifying the performance requirements for iTrust, we found that the specification parts proposed in this paper are best suitable for event-based software behaviors. We can use the proposed specification parts to specify the performance require-ments for operations triggered by external events, such as user interaction. However, specifying the parts that contain phrases (for example, preparation and event) is tricky for an operation without external triggers. Additionally, the natural language transformation rule might produce specifications that look rather odd for non-user-interactive programs. For example, we may specify a performance requirement for off-line report generation: Report A shall be generated within thirty minutes. If we use “the system starts generating report A” as the event, the transformed result is: When the system starts generating report A, the response time shall be less than thirty minutes. The result is, although clear, less straightforward than the intended specification. For these requirements, other transformation rules may be applied. For example, the following rule may be used for non-user-interactive performance requirements:
[After preparation, ]when event, the elapse time shall be less than
time.
5.
CONCLUSION AND FUTURE WORK
specification parts and corresponding values. We show how PREM principles and related techniques can be applied. We also show the transformation rules for natural-language-based specifi-cation and test case for PREM Level 1 through 3. When ance requirements are refined and evolved with more perform-ance-related information, the corresponding test cases can be regenerated to reflect the new performance characteristics.
We use iTrust as an example to show how PREM can be applied in a Web application project. In the example, we demonstrate a performance engineering process based on PREM. We also show how performance models and techniques are used throughout the process. As more performance information is gathered, the re-quirements are refined to reflect the newest information.
The specification parts we propose in this report need to be vali-dated to show their efficacy. To validate the specification parts, we need to show that:
y The parts are sufficient for all performance requirements.
y Performance requirements specified with the parts are less ambiguous than specification without using the parts.
y Performance requirements specified with the parts are more complete than specification without using the parts.
Currently, we do not have strong evidence suggesting when the requirements refinement should stop. We believe the required precision for performance requirements specification depends on the type of project. For example, for a system that processes its job sequentially and does not accept concurrent requests, PREM-1 requirements and analysis seem sufficient. However, in a hard real time system controlling multiple machines in a factory, PREM-3 requirements and analysis may be required. We need to conduct empirical studies to see how the application of PREM affects the outcome of a project.
6.
ACKNOWLEDGMENTS
The authors would like to thank the comments and feedbacks from the RealSearch reading group at NC State University. This research was funded by the Center for Advanced Computing and Communication.
7.
REFERENCES
[1] Avritzer, A., J. Kondek, D. Liu, and E. J. Weyuker, "Soft-ware Performance Testing Based on Workload Characteriza-tion," in Proceedings of the 3rd International Workshop on Software and Performance, pp. 17-24, Rome, Italy, Jul 2002. [2] Avritzer, A. and E. J. Weyuker, "Generating Test Suites for Software Load Testing," in Proceedings of International Symposium on Software Testing and Analysis, pp. 44-57, Seatle, WA, Aug 1994.
[3] Balsamo, S., A. D. Marco, and P. Inverardi, "Model-Based Performance Prediction in Software Development: A Sur-vey," IEEE Transactions on Software Engineering, vol. 30, no. 5, pp. 295-310, May 2004.
[4] Barber, S., "Beyond Performance Testing Part 3: How Fast Is Fast Enough?" developerWorks, 2004. Available at
http://www-128.ibm.com/developerworks/rational/library/4249.html. [5] Basili, V. R. and J. D. Musa, "The Future Engineering of
Software: A Management Perspective," IEEE Computer, vol. 24, no. 9, pp. 90-96, Sep 1991.
[6] Berry, D. M. and E. Kamsties, "Ambiguity in Requirements Specification," in Perspectives on Requirements Engineer-ing, J. C. S. P. Leite and J. Doorn, Eds.: Kluwer, 2004, pp. 7-44.
[7] Berry, D. M. and E. Kamsties, "The Syntactically Dangerous All and Plural in Specifications," IEEE Software, vol. 22, no. 1, pp. 55-57, Jan/Feb 2005.
[8] Bertolino, A. and R. Mirandola, "Towards Component-Based Software Performance Engineering," in Proceedings of the 6th Workshop on Component-Based Software Engineering, pp. 1-6, Portland, OR, May 2003.
[9] Cortellessa, V. and R. Mirandola, "PRIMA-UML: A Per-formance Validation Incremental Methodology on Early UML Diagrams," Science of Computer Programming, vol. 44, no. 1, pp. 101-129, Jul 2002.
[10] Denger, C., D. M. Berry, and E. Kamsties, "Higher Quality Requirements Specifications through Natural Language Pat-terns," in Proceedings of International Conference on Soft-ware: Science, Technology, and Engineering, pp. 80-90, Hertzeliyah, Israel, Nov, 2003.
[11] Fantechi, A., S. Gnesi, G. Lami, and A. Maccari, "Applica-tion of Linguistic Techniques for Use Case Analysis," in Proceedings of IEEE Joint International Conference on Re-quirements Engineering, pp. 157-164, Essen, Germany, Sep 2002.
[12] Fox, G., "Performance Engineering as a Part of the Devel-opment Life Cycle for Large-Scale Software Systems," in Proceedings of The 11th International Conference on Soft-ware Engineering, pp. 52-62, Nice, France, Mar 1990. [13] Gao, J. Z., J. H.-S. Tsao, and Y. Wu, Testing and Quality
Assurance for Component-Based Software. Norwood, MA: Artech House Publishers, 2003.
[14] Ho, C.-W., M. J. Johnson, E. M. Maximilien, and L. Wil-liams, "On Agile Performance Requirements Specification and Testing," in Proceedings of Agile 2006 International Conference, pp. 47-52, Minneapolis, MI, Jul 2006.
[15] ISO/IEC, International Standard ISO/IEC 13817-1: Informa-tion Technology -- Programming Languages, Their Envi-ronments and System Software Interfaces -- Vienna Devel-opment Method -- Specification Language -- Part 1: Base Language, 1996.
[16] ISO/IEC, International Standard ISO/IEC 13568: Informa-tion Technology -- Z Formal SpecificaInforma-tion NotaInforma-tion -- Syn-tax, Type System, and Semantics, 2002.
[17] ITU, ITU-T Recommendations Z. 120 (04/04) Message Se-quence Chart (MSC), 2004.
[18] Joines, S., R. Willenborg, and K. Hygh, Performance Analy-sis for Java Web Sites. Boston, MA: Addison-Wesley, 2003. [19] Kleinrock, L., Queueing Systems Volume I: Theory. New
York City, New York: Wiley-Interscience, 1975.
[20] Menascé, D. A. and H. Gomaa, "A Method for Design and Performance Modeling of Client/Server Systems," IEEE Transactions on Software Engineering, vol. 26, no. 11, pp. 1066-1085, Nov 2000.
[21] Musa, J. D., "Operational Profiles in Software Reliability Engineering," IEEE Software, vol. 10, no. 2, pp. 14-32, Mar 1993.
[23] Nixon, B. A., "Managing Performance Requirements for Information Systems," in Proceedings of the 1st Interna-tional Workshop on Software and Performance, pp. 131-144, Santa Fe, NM, Oct 1998.
[24] Nylopoulos, J., L. Chung, and B. Nixon, "Representing and Using Nonfunctional Requirements: A Process-Oriented Ap-proach," IEEE Transactions on Software Engineering, vol. 18, no. 6, pp. 483-497, Jun 1992.
[25] Ohnishi, A., "Software Requirements Specification Database Based on Requirements Frame Model," in Proceedings of the 2nd International Conference on Requirements Engineering, pp. 221-228, Colorado Springs, CO, Apr 1996.
[26] Petriu, D. B. and M. Woodside, "Software Performance Models from System Scenarios," Performance Evaluation, vol. 61, no. 1, pp. 65-89, Jun 2005.
[27] Petriu, D. C. and H. Shen, "Applying the UML Performance Profile: Graph Grammar-Based Derivation of LQN Models from UML Specifications," in Proceedings of the 12th Inter-national Conference on Computer Performance Evaluation: Modelling, Techniques, and Tools, pp. 159-177, London, UK, Apr 2002.
[28] Ross, S. M., Introduction to Probability Models, 8th Edition. Burlington, MA: Academic Press, 2003.
[29] Sevcik, P., "How Fast is Fast Enough" Business Communica-tions Review, 2003. Available at http://www.bcr.com/architecture/network_forecasts%10sevci k/how_fast_is_fast_enough?_20030315225.htm.
[30] Sevcik, P., "Web Performance -- Not a Simple Number," Business Communications Review, 2003. Available at http://www.bcr.com/architecture/network_forecasts%10sevci k/web_performance_20030116240.htm.
[31] Smith, C. U., Performance Engineering of Software Systems. Reading, MA: Addison-Wesley, 1990.
[32] Smith, C. U. and L. G. Williams, "Performance Engineering Evaluation of Object-Oriented Systems with SPE·ED™," Lecture Notes in Computer Science, vol. 1245, pp. 135-154, 1997.
[33] Smith, C. U. and L. G. Williams, Performance Solutions: A Practical Guide to Creating Responsive, Scalable Software. Boston, MA: Addison-Wesley, 2002.
[34] Sommerville, I., Software Engineering, 7th ed. Boston, MA: Addison-Wesley, 2004.
[35] Weyuker, E. J. and F. I. Vokolos, "Experience with Perform-ance Testing of Software Systems: Issues, an Approach, and
Case Study," IEEE Transactions on Software Engineering, vol. 26, no. 12, pp. 1147-1156, Dec 2000.
[36] Zadrozny, P., P. Aston, and T. Osborne, J2EE Performance Testing with BEA WebLogic Server. Birmingham, UK: Ex-pert Press, 2002.
Appendix: Open Queueing Network Solution
Open queueing network models are used when evaluating the performance of iTrust at PREM Level 2. This appendix covers the formulas for open queueing network model solution. The model used in iTrust is shown in Figure 10. The input parameters for the model are:
y Flow probabilities after the Web server p1 and p2.
y The request arrival rate r. The arrival is a Poisson process.
y The throughput of the Web server and the database server, μW
and μD, respectively.
To solve the model, we need to derive the request arrival rates for the Web server (λW) and the database server (λD). We use the
rule that, for each server, the request arrival rate equals to the request departure rate. Then the request rates can be written as:
W 2 D
D W
λ
λ
λ
λ
× =
+ =
p r
Or
2 2 D 2 W
1 ,
1 p
r p p
r
− = −
=
λ
λ
The average number of requests in the system is derived with the following formula:
D D
D
W W
W
λ
μ
λ
λ
μ
λ
− + − =
l
To have a meaningful result from this formula, for each arrival rate must be less than the throughput. That is, λW < μW and λD <
μD. Finally, the average waiting time is: