Twitter Data Predicting Geolacation Using
Data Mining Techniques
Manisha Rani1, Jyoti Arora2
Research Fellow, Department of Computer Science & Engineering, Desh Bhagat University, Mandi Gobindgarh,
Punjab, India1,
Asst. Professor, Department of Computer Science & Engineering, Desh Bhagat University, Mandi Gobindgarh,
Punjab, India2
ABSTRACT: Social Networking is the medium which allows million users to share their opinion, ideas, views and
huge amount of data is presented for internet users and a lot of data generated too. This paper proposes the paradigm to extract the sentiment from famous micro blogging service, called twitter. Twitter is one of the most popular portals, where people post their opinions, views for everything. In this paper, data mining techniques are used to automatically classify the sentiments of Tweets taken from Twitter dataset. CPython open source is used to find out frequent data items used in tweets with ‘#ipl’ and ‘#ipl2016’ tag. . In this research, different algorithms are used to assign a sentiment (positive, neutral or negative) to a tweet. The number of complex tweets has been processed for normal data adapters; therefore a complex event processing engine is required for processing the data. This research focuses on the application of sentiment analysis to Twitter and comparing the performance of different classification algorithms on this problem.
KEYWORDS: Social Network, Twitter, Sentimental Analysis, Data
I. INTRODUCTION
With the advancement of technology, the internet has become popular way for people to express their opinion, views and share ideas. Nowadays people are using social network sites, micro blogs to express their emotions, opinion and share views about their daily lives and also discuss current issues. The Micro blogging platforms are helping this cause with restriction-less message format and also with ease of accessibility. Online communities provide an interactive media where consumers inform and influence others through forums. Social sites are generating a large volume of sentiment rich data in the form of tweets, status updates, blog posts, comments, reviews, etc. Moreover, social media provides an opportunity for businesses by giving a platform to connect with their customers for advertising. People use online generated user content to make decision about any product. For e.g. if someone wants to buy a product or wants to use any service, then they firstly look up its reviews online, discuss about it on social media before taking a decision. There are almost 111 micro blogging sites which are serving these services to people. Twitter is one of the famous micro blogging sites invented in 2006 where user can read and write messages upto 148 characters length. Twitter messages are also called as Tweets. The amount of content generated by users is too vast; it is difficult for a normal user to analyze. So there is a need to automate this, various sentiment analysis techniques are widely used. The sentiment analysis helps the customer to get feedback about the product and services before purchase it. Marketers and firms use this analysis data to understand about their products or services in such a way that it can be offered as per the user’s requirements.
becomes neutral at sentence level. As the sentiment analysis on twitter or any social media site tracks particular topic, many politicians as well as companies use twitter to track their position in politics and monitor their products and services respectively. In this research, the extraction of the sentiment from a tweet is studied. In data analysis, algorithms have been developed which can be used to analyze data, with the goal to extract useful information. In this research, these algorithms are used to assign a sentiment (positive, neutral or negative) to a tweet. The number of tweets that have to be processed is too high and complex for normal data adapters, therefore a complex event processing engine is required for processing the data. This research will focus on the application of sentiment analysis to Twitter and comparing the performance of different classification algorithms on this problem. The main question of this thesis is: ”How can Twitter messages be accurately classified with respect to their sentiment?”. To answer this question, a sentiment analysis tool is implemented, which provides a framework for testing the quality of the algorithms. This tool provides a way to query the sentiment about popular mobile phones and their brands. Mobile phones are an interesting topic to focus on, because predominantly young audience catalyzing the probability for Twitter usage. Also the fact that mobile phones are fast changing products boosts the amount of tweets about it.
II. LITERAUTRE REVIEW
Sentiment analysis is the most important research area in business fields. A lot of work has been done by researchers in this field.
Ana C.E.S Lima and Leandro N de (2012) proposed three approaches for the automatic classification of sentiments, an emotion based approach, and a word based approach and a hybrid approach. In the emotion based approach they used sentiment incorporated in the emotions as criteria to automatically classify the messages. The criteria to select a tweet are the presence of at least one Emoticon. The sentiment is inferred based on the Emoticon. The word based approach uses words that express sentiment as criteria. In tweets, the presence of words such as good, bad, excellent etc will express sentiment and hence can be inferred. In the hybrid approach a combination of Emoticons and words were used to infer the sentiment. They used Naïve-bayes Algorithm for classifying tweets and concluded that the combined i.e. the hybrid approach yields better results, also, they suggested to add a label “neutral” in future classification.
Dimitrios kotsakos, panos sakkos, Ionnis katakis, Dimitrios (2014) Highlighted on tagging the tweets. They did the hashtag analysis in which a hash (#) symbol used to indicate a special meaning of a word and tag content in social networks like twitter. Users used hashtags for search, annotations or viral conversations often called Memes. They revealed interesting characteristics of some expected hashtags and some not expected hashtags. They also suggested to further investigate features that characterize the behavior of popular topics and to create taxonomies of hashtags that facilitate recommendation or searches.
Mahanaz Roshanaei and Shivakant Mishra (2014) emphasize on effect of mood and emotions on a person‟s behavior. They classified users in to positive, negative and neutral users based on followers and followees. Negative users are not interested in sharing their negativity in social media. The positive users are more likely to make friendships with negative users, also, the negative users retweet more than the positive users. They use Twitter as a tool for social awareness and also to gain emotional support. Retweeting positive tweets makes the negative tweeters feel positive. Both positive and negative users avoid interacting with each other.
Luo et. al. (2013) highlighted the challenges and an efficient technique to mine opinions from Twitter tweets. Spam and wildly varying language makes opinion retrieval within Twitter challenging task.
Xia et al. (2011) used an ensemble framework for Sentiment Classification which is obtained by combining various feature sets and classification techniques. In their work, they used two types of feature sets (Part-of-speech information and Word-relations) and three base classifiers (Naive Bayes, Maximum Entropy and Support Vector Machines) . They applied ensemble approaches like fixed combination, weighted combination and Meta-classifier combination for sentiment classification and obtained better accuracy.
Bifet and Frank (2010) used Twitter streaming data provided by Firehouse API , which gave all messages from every user which are publicly available in real-time. They experimented multinomial naive Bayes, stochastic gradient descent, and the Hoeffding tree. They arrived at a conclusion that SGD-based model, when used with an appropriate learning rate was the better than the rest used.
Go and L.Huang (2009) proposed a solution for sentiment analysis for twitter data by using distant supervision, in which their training data consisted of tweets with emoticons which served as noisy labels. They build models using Naive Bayes, MaxEnt and Support Vector Machines (SVM). Their feature space consisted of unigrams, bigrams and POS. They concluded that SVM outperformed other models and that unigram were more effective as features.
III. NEED FOR THE PRESENT STUDY
In the last couple of years the social medium Twitter has become more and more popular. Since Twitter is the most used micro blogging website with about 500 million users and 340 million tweets a day, it is an interesting source of information. The messages, or in Twitter terms the tweets, are a way to share interests publicly or among a defined group. The twitter is also helping businesses to grow their business according to the opinion of customers about their products.
However twitter is popular amongst whole world, but still the most difficult aspect is the overall freedom, because Twitter does not have a protocol about how to use it. This includes spelling mistakes, domain specific content and acronyms. Summarized, the Twitter data lacks a well defined structure. It is a great challenge to create applications which use Twitter data and accurately classifies the sentiment.
IV. EXPERIMENTAL SETUP
The software tools that are used to complete the research are described as following:
A. PYCharm IDE
In computer programming, Pycharm is an integrated development environment (IDE). It contains a base workspace and an extensible plug-in system for customizing the environment. PyCharm’s smart code editor provides first-class support for Python, JavaScript, CoffeeScript, TypeScript, CSS, popular template languages and more. Take advantage of language-aware code completion, error detection, and on-the-fly code fixes!. PyCharm offers great framework-specific support for modern web development frameworks such as Django, Flask, Google App Engine, Pyramid, and web2py. PyCharm works on Windows, Mac OS or Linux with a single license key. Enjoy a fine-tuned workspace with customizable color schemes and key-bindings, with VIM emulation available. In addition to Python, Pycharm supports JavaScript, CoffeeScript, TypeScript, HTML/CSS, Cython, template languages, AngularJS, Node.js, and more.
B. Python
Python is a widely used general-purpose, high-level programming language. Its design philosophy emphasizes code readability, and its syntax allows programmers to express concepts in fewer lines of code than would be possible in languages such as C. The language provides constructs intended to enable clear programs on both a small and large scale. Python supports multiple programming paradigms, including object-oriented, imperative and functional programming or procedural styles. It features a dynamic type system and automatic memory management and has a large and comprehensive standard library.
Like other dynamic languages, Python is often used as a scripting language, but is also used in a wide range of non-scripting contexts. Using third-party tools, such as Py2exe or Pyinstaller, Python code can be packaged into standalone executable programs. Python interpreters are available for many operating systems. CPython, the reference implementation of Python, is free and open source software and has a community-based development model, as do nearly all of its alternative implementations. CPython is managed by the non-profit Python Software Foundation.
C. Twitter Rest API
V. PROPOSED METHOD
Sentiments are the words or sentences that represent view or opinion that is held or expressed that can be positive, negative or neutral. The aim of proposed algorithm is to analyze the twitter data properly. The proposed algorithm consists of following five steps that are implemented to analyze the data:
Step 1: Collecting Data
Twitter provides REST APIs you can use to interact with their service. we can easily collect tweets (and more) and store them in the original JSON format, fairly easy to convert into different data models depending on ours. Tweepy is one of the many packages in python by which we are collecting data from twitter. Tweepy as a tool to access Twitter data in a fairly easy way with Python.
Step 2: Text Pre-processing
After retrieval of tweets Sentiment analysis tool is applied on raw tweets but in most of cases results to very poor performance. Therefore, preprocessing techniques are necessary for obtaining better results . We extract tweets i.e. short messages from twitter which are used as raw data. This raw data needs to be preprocessed. So, preprocessing involves following steps which constructs n-grams:
i. Filtering:
Filtering is nothing but cleaning of raw data. In this step, URL links (E.g. http://twitter.com), special words in twitter (e.g. “RT” which means Retweet), user names in twitter (e.g. @Ron - @ symbol indicating a user name), emoticons are removed.
ii. Tokenization:
Tokenization is nothing but Segmentation of sentences. In this step, we will tokenize or segment text with the help of splitting text by spaces and punctuation marks to form container of words.
iii. Construction of n-grams:
Set of n-grams can make out of consecutive words. Negation words such as “no”, “not” is attached to a word which follows or precedes it. For Instance: “I do not like remix music” has two bigrams: “I do+not”, “do+not like”, “not+like remix music”. So the accuracy of the classification improves by such procedure, because negation plays an important role in sentiment analysis.
Step 3: Remove stop words
In every language, some words are particularly common. While their use in the language is crucial, they don’t usually convey a particular meaning, especially if taken out of context. This is the case of articles, conjunctions, some adverbs, etc. which are commonly called stop-words. In the example above, we can see three common stop-words – to, andon. Stop-word removal is one important step that should be considered during the pre-processing stages. One can build a custom list of stop-words, or use available lists (e.g. NLTK provides a simple list for English stop-words). Step 4: Data visualization
Data visualization is an important discipline in the bigger context of data analysis. One of the coolest libraries for data visualization is probably D3.js which is, as the name, suggests, based on JavaScript. D3 plays well with web standards like CSS and SVG, and allows to create some wonderful interactive visualizations. one of the coolest Step 5: Geolocation analysis
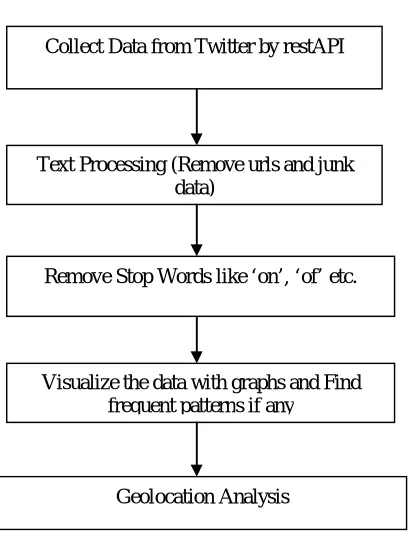
Fig.1. Flow chart of implementation steps to analyze data
Figure 1 describes the steps that are used to analyze data of twitter. According to this figure, firstly data is collected from twitter and then urls and junk data is removed from this data. that stop words are removed and data is visualized with help of graphs to find frequent patterns. At last, the location of devices is analyzed.
VI. RESULTS AND DISCUSSION
Firstly, the top 20 words used in tweets with ‘#ipl’ and ‘#ipl2016’ tag are calculated.We can observe what are the terms most commonly used in the data set.Data visualization is an important discipline in the bigger context of data analysis. By supporting visual representations of our data, we can provide interesting insights. We have discussed a relatively simple option to support data visualization with Python using Vincent. In particular, we have seen how we can easily bridge the gap between Python and a language like JavaScript that offers a great tool like D3.js, one of the most important libraries for interactive visualization.
Fig. 2 Most common words used with #ipl tag Collect Data from Twitter by restAPI
Text Processing (Remove urls and junk data)
Remove Stop Words like ‘on’, ‘of’ etc.
Visualize the data with graphs and Find frequent patterns if any
Figure 2 shows the results of calculation of most commonly used terms that are used in tweet with ‘#ipl’ tag. For this calculation most common 20 tweets are used.
Fig. 3 Frequency Graph of Most common words used with #ipl tag
In Figure 3, graph shows the number of times called frequency, for which common words used with #ipl tag. The results show that frequency of #ipl2016 is high. On the other hand, many words have same frequency.
Fig. 4 Most common words used with #ipl2016 tag
Figure 4 shows the results of calculation of most commonly used terms that are used in 20 top tweets with ‘#ipl2016’ tag.
In Figure 5, graph shows the frequent items that are used with #ipl2016 tag. The results show that frequency of age is high. This graph has shown the frequency in decreasing order.
In general there are many options for data visualization in Python, but in terms of browser-based interaction, Javascript is also an interesting option, and the two languages can play well together. With Python, we’ve been able to transform our data into a common format (GeoJSON) that can be passed onto Javascript for visualization. Leaflet.js is a nice Javascript library that, almost out of the box, lets us create some nice interactive maps.
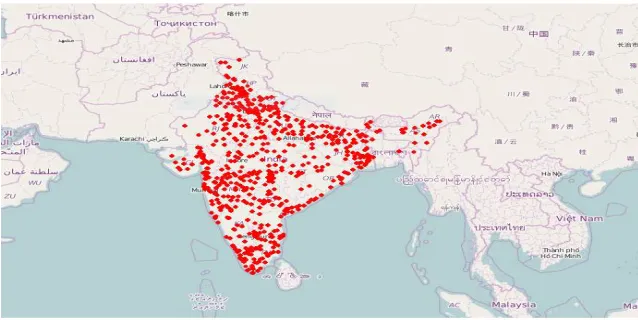
Fig. 6 Geolocation graph of tweets with #ipl
Figure 6 shows the graph that describes the location of devices which used the tweets with #ipl tag.
Fig. 7 Geolocation graph of tweets with #ipl2016
Figure 7 shows the graph that describes the location of devices which used the tweets with #ipl2016 tag.
VII. CONCLUSION
are they using to publish posts on twitter. In future, other techniques and methods can be used to obtain the high accuracy of system.
REFERNCES
1) Lima, A. C., and Leandro N. d. C., “Automatic sentiment analysis of Twitter messages.” Computational Aspects of Social Networks (CASoN), 2012 Fourth International Conference on. IEEE, 2012.
2) Kotsakos, D., “# tag: Meme or Event?” Advances in Social Networks Analysis and Mining (ASONAM), 2014 IEEE/ACM International Conference on. IEEE, 2014.
3) Roshanaei, M., and Shivakant, M., “An analysis of positivity and negativity attributes of users in twitter.” Advances in Social Networks Analysis and Mining (ASONAM), 2014 IEEE/ACM International Conference on. IEEE, 2014.
4) Zhunchen, L., Miles, O., Ting, W., “An effective approach to tweets opinion retrieval”, Springer Journal on World Wide Web, Dec 2013. 5) Xia, R., Zong, C., and Li, S., “Ensemble of feature sets and classification algorithms for sentiment classification,” Information Sciences: an
International Journal, Vol. 181, Issue 6, pp. 1138–1152, 2011.
6) Bifet and Frank, E., “Sentiment Knowledge Discovery in Twitter Streaming Data”, In Proceedings of the 13th International Conference on Discovery Science, Berlin, Germany: Springer, pp. 1-15, 2010.
7) Pak, A. and Paroubek, P. “Twitter as a Corpus for Sentiment Analysis and Opinion Mining”. In Proceedings of the Seventh Conference on International Language Resources and Evaluation, pp.1320-1326, 2010.
8) Go, R. Bhayani and Huang, L., “Twitter Sentiment Classification Using Distant Supervision". Stanford University, Technical Paper,2009 9) Jimmy, L. and Kolcz, A., “Large-scale machine learning at twitter”, In Proceedings of the 2012 ACM SIGMOD International Conference on
Management of Data, ACM, pp. 793-804, 2012.
10) Jiang, Topaloglu U. and Yu, F., “Towards large-scale twitter mining for drug-related adverse events”, In Proceedings of the 2012 international workshop on Smart health and wellbeing, ACM, pp. 25-32, 2012.
11) Kharde, V. and Sheetal S., “Sentiment Analysis of Twitter Data: A Survey of Techniques." International Journal of Computer Applications, Vol.139, Issue 11, 2016.
12) Gamon, M., “Sentiment classification on customer feedback data: noisy data, large feature vectors, and the role of linguistic analysis.” Proceedings of the 20th international conference on Computational Linguistics. Association for Computational Linguistics, pp. 841, 2004. 13) Agarwal, A., Biadsy F., and Kathleen R. Mckeown., “Contextual phrase-level polarity analysis using lexical affect scoring and syntactic