FINITE ELEMENT MODEL OF INTERIOR CONCRETE STRUCTURES
FOR SEISMIC ANALYSIS WITH HIGH-FREQUENCY CONTENT
Hoan-Kee Kim1 and Luis Moreschi2
1
Senior Engineer, Bechtel Power Corporation, Frederick, MD ([email protected])
2
Engineering Group Supervisor, Bechtel Power Corporation, Frederick, MD
ABSTRACT
This paper presents the development of a three-dimensional (3D) Finite Element Model (FEM) of the reactor building Interior Concrete Structure (ICS) with an emphasis on the dynamic modeling requirements for performing seismic analyses subject to High-Frequency (HF) content typical of Central and Eastern United States (CEUS) hard rock sites. The proposed ICS FE model is comprised of different element types (i.e., Solid, Shell, Beam, Mass, and Matrix elements) to appropriately capture both global and local structural responses as well as any dynamic interaction between the ICS and the attached Nuclear Steam Supply System (NSSS) components. Mesh sensitivity studies are presented to illustrate the level of refinement needed to ensure fidelity of responses up to 50 Hz as prescribed by Nuclear Regulatory Commission (NRC) Interim Staff Guidance DC/COL-ISG-01. Comparisons to a conventional Lumped Mass Stick Model (LMSM) are also included to illustrate some of the local responses (such as “breathing” and “skewing” modes) that may not be properly accounted for by such simplified modeling approaches. It is concluded that the proposed ICS FE model is refined enough to sufficiently capture the dynamic responses of the ICS subject to the HF content input ground motion in seismic analyses and for the subsequent use of equipment qualification.
INTRODUCTION
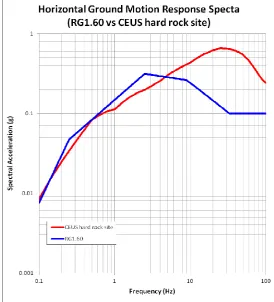
Most of the technical literature on structural analysis and design of nuclear safety-related buildings have been devoted to Containment Buildings since the integrity of these structures is of upmost importance to ensure the safety and protection of the public against the potential risk of radiation release during a postulated nuclear reactor accident, e.g. Mello et al. (2009) & Qadeer et al. (2009). On the other hand, internal structures, or Interior Concrete Structure (ICS) as denoted in this paper, have not received a similar level of attention since the design of their massive concrete sections is usually accomplished by providing nominal steel reinforcement given the generally low level of stresses. However, it is the high stiffness provided by the ICS walls and compartments that requires special attention when performing seismic analysis in the Central Eastern US (CEUS) hard rock sites since the natural frequencies of the rigid structural components may now be tuned to the peak of the High Frequency (HF) ground motion spectra (as shown in Figure 1) with the potential for amplifying the input seismic accelerations.
refinement needed to properly predict both global and local responses of the ICS in the presence of input ground motion with HF content. This paper provides the development of a Finite Element Model (FEM) that serves the aforementioned purposes and presents the testing done on the model to ensure its adequacy for performing seismic analyses and qualification of equipments.
Figure 1. Ground motion response spectra (RG1.60 vs CEUS hard rock site)
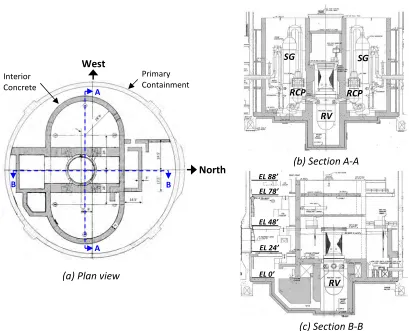
DESCRIPTION OF INTERIOR CONCRETE STRUCTURE
Figure 2. Interior concrete structure (Plan view and sections)
FINITE ELEMENT MODEL
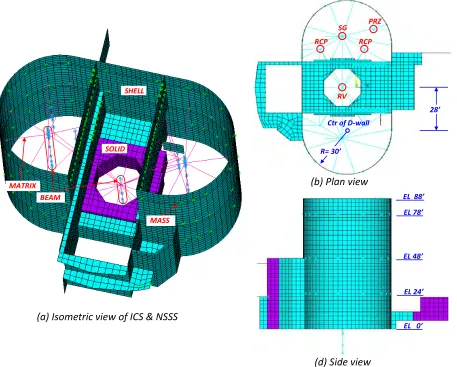
In this paper, a three-dimensional (3D) ICS FE model has been developed using structural analysis software, ANSYS Mechanical, Release 13.0 (2010). Figure 3 shows the isometric, plan, and elevation views of the proposed ICS FE model including the NSSS components. As shown in Figure 3, most of the concrete walls and floors including shield walls are modeled by using Shell181 element, which is a 4-node shell element having six degrees of freedom at each node and suitable for analyzing thin to moderate-thick shell per ANSYS Mechanical, Release 13.0 (2010). The massive RV cavity wall is modeled using Solid185, which is an 8-node for better accuracy. The NSSS components such as RV, SG, RCP, PRZ, and related connections (pipes) are modeled using Beam188 and Matrix27 elements. The effective masses of the NSSS components and miscellaneous equipment are modeled by using Mass21 element. Note that the FE meshes of the proposed FEM are automatically generated based on a selected typical mesh size. Based on the typical mesh size of 4ft, the proposed ICS FEM model is built with a total number of 7,500 finite elements (i.e., equivalent to 7,800 nodes). Such element size (4ft) is very-refined when required in areas of interest using free meshing in ANSYS and also when being under a high-frequency contents of earthquake inputs. The related mesh sensitivity study is followed in the next section.
North West
Primary Containment Interior
Concrete Structure
(a) Plan view
A
A
B B
(b) Section A-A SG SG
RV
RCP RCP
(c) Section B-B RV
EL 88’
EL 48’ EL 78’
EL 24’
Figure 3. Proposed 3D ICS FE model (combined with NSSS)
EFFECTS OF MESH SIZE ON DYNAMIC ANALYSES AND RESPONSES
Accuracy and Size of Finite Element Model With Respect To Mesh Size
Finite element analysis results are known to be sensitive to the element type, shape, aspect ratio, and mesh size per Cook et al. (1989). Appropriate mesh size of a dynamic finite element models can be determined by several factors. For nuclear facility at a CEUS hard rock site, a structural model should be refined enough to capture appropriate dynamic responses for HF content (at least 50 Hz of the ground motion response spectrum) as per NRC Interim Staff Guidance Document No. 1 (2012). Also, the same FE model may be used for structural design purposes in a single step approach. Some guidelines and recommendations on mesh size selections are available in many references, e.g. ASCE 4 (1998) and Moreschi et al. (2012). As always, required-accuracy and efficiency of the dynamic FE model are key factors that shall be considered in the selection of appropriate mesh size and/or size of dynamic FE models. It is generally known as bigger FE models are (i.e., having many numbers of finite elements) more accurate FEA results are generated. In the following, the selection of an appropriate mesh size is shown as an example.
(b) Plan view
RV SG
RCP RCP PRZ
Ctr of D-wall
R= 30’
28’
(a) Isometric view of ICS & NSSS
SHELL
SOLID
MASS BEAM
MATRIX
EL 88’
(d) Side view
EL 48’ EL 78’
EL 24’
In order to select appropriate mesh size and to see its relations with accuracy and efficiency, the ICS-only FE model (i.e., without the NSSS components) has been examined by varying its typical mesh size from 2 to 16 ft increased by 2ft, and taken as a ratio to the thickness of D-wall (4ft). Note that this typical mesh size is not applicable to the entire finite elements of the ICS FEM since some elements like in the RV cavity walls are limited to a certain dimension, so they cannot be larger than certain mesh size due to their geometry. The variance of this mesh size is mostly applied to D-walls. Figure 4(a) shows the size of the FEM in terms of the number of the generated finite elements along with their various mesh sizes. The ICS FE model with a mesh size ratio of 0.5 generates about 26,000 finite elements, while the FE model with a ratio of 2 needs only about 3,000 finite elements, which demonstrates that reducing the mesh size exponentially increases the size of FEM, directly related to the computational and post-processing cost. On the other hand, Figure 4(b) shows a relationship between the accuracy of the FEM and the mesh size as an example. Here, the first three fundamental natural frequencies (i.e., selected in the order of larger mass participation factors, MPFs) in X direction are compared for the various mesh sizes. As expected, some accuracy is lost as the mesh size is increased. Based on these two results, the element size to thickness ratios ranged from 1.0 to 3.0 seems to provide a good compromise between accuracy of global solution and numerical computational effort. Further examination is performed next.
(a) Size of FEM (b) Accuracy of FEM
Figure 4. Number of finite elements & maximum differences in natural frequencies for the FE models with different mesh size ratios (varies from 0.5~4.0)
Mesh Sensitivity on Dynamic Responses of Interior Concrete Structure
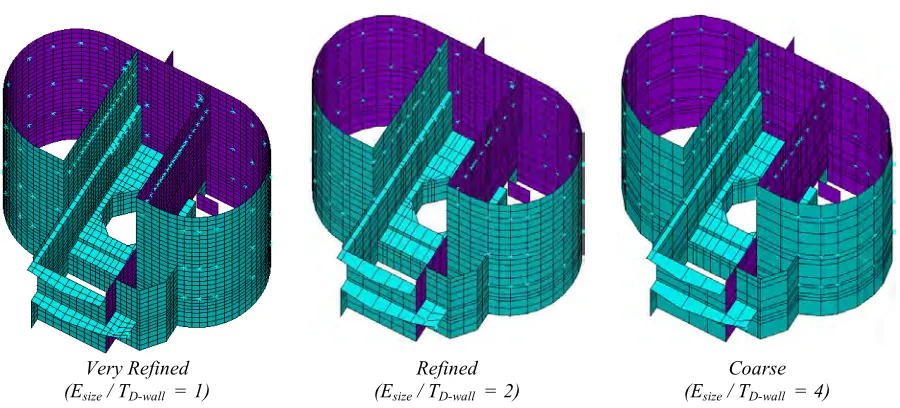
The mesh size effect on the dynamic responses of the ICS FEM is also examined by using three different FE mesh refinements (i.e., very-refine, refine, and coarse) as depicted in Figure 5. Mentioned earlier, some finite elements like in the RV cavity walls and in certain elevations do not grow beyond a certain mesh size due to their inherent/particular geometric constraints. However, most finite elements like in the D-walls and internal walls are modified as per different mesh refinements.
Very Refined (Esize / TD-wall = 1)
Refined (Esize / TD-wall = 2)
Coarse (Esize / TD-wall = 4)
Figure 5. Finite element models with different mesh refinements (Esize/TD-wall=1, 2, & 4, left to right)
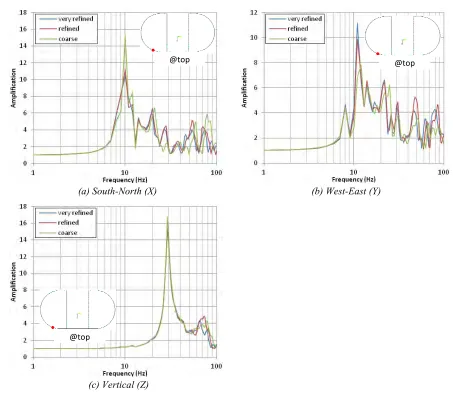
In this paper, dynamic responses of the FE models including different mesh refinements are examined by comparing transfer functions (i.e., amplitude of steady-state response due to frequency-dependent unit dynamic loading) up to 100Hz at different nodal locations. Figure 6 shows transfer functions measured at the top of the D-wall of each FE model (i.e., very-refined, refined, and coarse) along the model X, Y, & Z directions. The results comparison per each direction is summarized as follows:
• X-Dir: All three FE models generate the same responses up to 8 Hz and then generate the highest peak amplification at 10/11Hz. However, their peak amplitudes are different per the models. The peak amplifications of both very-refined and refined FE models are calculated as about 10~11, while the coarse FE model generates a peak of 15 (i.e. over-estimating by about 40% than the others). Similarly, both very-refine and refine FE models calculate the same peak amplifications at 20Hz, but the coarse FE model calculates the peak at 22Hz (i.e., shifted to the right by 2Hz compared to the other two FE models). Overall, three FE models generate same or similar responses in the frequency range of 1~8Hz. However, different peak amplitudes and frequencies are distinctly calculated as frequencies are getting higher (particularly, after around 20Hz).
• Y-Dir: The highest peak amplification is observed at around 12 Hz for all three FE models. However, the calculated peak amplitudes are different by the FE models. The very-refined FE model generates the largest amplification of 11, and the refined FE model produces 10, a little bit less. Last, the coarse FE model generates the amplification of 8. Three FE models generate the same/similar responses in the frequencies up to 8Hz, but they generate different amplifications and their peak frequencies beyond 20 Hz.
• Z-Dir: Unlikely to the responses in X & Y directions, all three FE models generate same responses up to 50Hz. However, different amplifications and peak frequencies are calculated beyond 50Hz, and the differences are getting apparent over the higher frequency range.
(a) South-North (X) (b) West-East (Y)
(c) Vertical (Z)
Figure 6. Dynamic responses calculated from the FE models with different mesh refinements
COMPARISON WITH CONVENTIONAL LUMPED-MASS STICK MODEL
This section provides a comparison of the dynamic responses calculated from the proposed ICS FEM and a conventional LMSM. The conventional LMSM is constructed as a single-stick by idealizing the ICS as a system of beams and masses lumped at different elevations, not presented herein. Dynamic responses such as natural frequencies, mode shapes, and In-Structure Response Spectra (ISRS) of the considered ICS are calculated and compared in the following. Note that Mesh size ratio of 1.5 (i.e. average of very-refined and refine) is used in this comparison based on the mesh sensitivity study results.
Natural Frequencies and Mode Shapes
Natural frequencies and mode shapes of the ICS without NSS components have been calculated up to 100Hz by using both the proposed ICS FEM and the conventional LMSM. Tables 4 & 5 summarize the first three fundamental natural frequencies and the associated MPFs calculated from the FEM & the LMSM, respectively. The proposed ICS FEM calculates 12.69, 11.96, & 30.29Hz as the first natural frequencies, respectively in X, Y, & Z directions. The LMSM also generates the same/similar first natural frequencies (i.e., 13.44, 11.96, & 31.00Hz in X, Y, & Z directions). As shown, both FE models
@top
@top
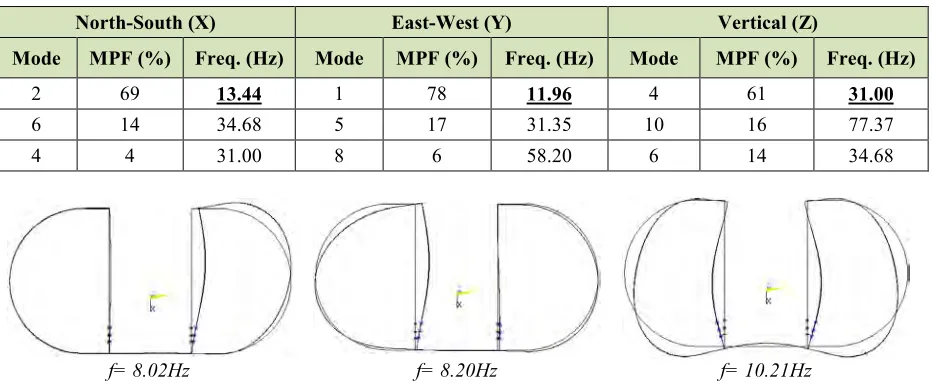
calculate the same first fundamental natural frequencies in all three modeling directions. However, they generate different natural frequencies from the second mode, which may be attributed by the different fidelity of each FE model. It is well-understood that more refined FEM can calculate more local modes, most of which may be localized and have insignificant contributions to the global behavior, so they are considered as noise or ignored based on their MPFs. However, it is observed that some modes prior to 11.96Hz have significant effective mass contributions (larger than 10% MPF). Such modes at 8.02, 8.20, and 10.21Hz should not be considered as local modes anymore. Figure 7 provides the corresponding deform shapes of the D-walls (i.e., referred to as “breathing” mode herein). Similarly, some other local modes (e.g., “skewing” and “warping” deformed) are observed as shown in Figure 8. However, their MPFs are less than 10%. Note that the conventional LMSM cannot capture such “breathing” and “skewing” modes.
Table 4: Natural frequencies and MPFs calculated from the proposed ICS FEM
North-South (X) East-West (Y) Vertical (Z)
Mode MPF (%) Freq. (Hz) Mode MPF (%) Freq. (Hz) Mode MPF (%) Freq. (Hz)
7 36 12.69 6 20 11.96 27 64 30.29
5 16 10.21 3 17 8.20 26 8 29.85
25 12 28.65 2 15 8.02 29 1 31.91
Table 5: Natural frequencies and MPFs calculated from the conventional LMSM
North-South (X) East-West (Y) Vertical (Z)
Mode MPF (%) Freq. (Hz) Mode MPF (%) Freq. (Hz) Mode MPF (%) Freq. (Hz)
2 69 13.44 1 78 11.96 4 61 31.00
6 14 34.68 5 17 31.35 10 16 77.37
4 4 31.00 8 6 58.20 6 14 34.68
f= 8.02Hz f= 8.20Hz f= 10.21Hz
Figure 7. Breathing mode shapes of D-walls with MPFs larger than 10%
f= 8.77Hz f= 15.10Hz f= 16.95Hz
In-Structure Response Spectra
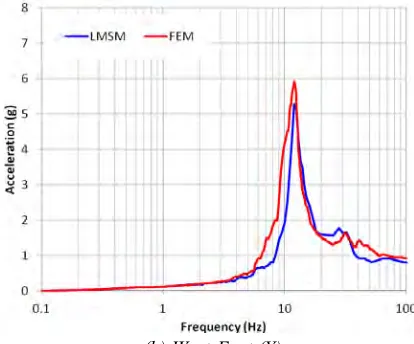
In-Structure Response Spectra (ISRS) of the proposed ICS FEM are compared with those generated by the LMSM. Fixed-base time history analyses are performed on both models with time history inputs matching the CEUS hard rock site spectra with HF content depicted in Figure 1. The ISRS responses are reported at EL 70 ft of the D-wall (i.e., near the top of the wall) and at the intersection between the internal and D-walls. The results are compared in Figure 9 and summarized as follows:
• X-Dir: Both the ICS FEM and the LMSM generate the overall similar responses. However, the LMSM under-estimates the ISRS from 8~10Hz, and it over-estimates the ISRS after 12Hz comparing to the ISRS of the ICS FEM. Such responses have been observed in the mesh sensitivity check (the coarse FEM over-estimate dynamic amplifications). Also the ICS FEM ISRS bumped up at 8~10Hz may be attributed to the “breathing” modes that cannot be captured by the conventional LMSM.
• Y-Dir: Overall, ISRS more similar than the X-direction ISRS are calculated from the ICS FEM and the LMSM. However, there are still noticeable differences observed for 6~10Hz and for 40~70Hz.
• Z-Dir: The same/similar ISRS are observed between the ICS FEM and the LMSM for the overall frequency range. However, slight differences can be observed after 50Hz.
(a) South-North (X) (b) West-East (Y)
(c) Vertical (Z)
CONCLUSIONS AND DISCUSSIONS
In this paper, an FEM has been developed to perform seismic analyses and design of ICS subject to HF contents at CEUS hard rock sites. The effect of the mesh sensitivity to the dynamic analyses results (i.e., natural frequencies and dynamic amplifications) has been examined, and concluded that a mesh size ratio less ranged from 1 to 2 with respect to the D-wall thickness is appropriate. The appropriateness of the proposed ICS FEM was examined by comparing natural frequencies and mode shapes calculated from a conventional LMSM. It is observed that some local modes like “breathing” and “skewing” modes may not be captured in a simplified conventional LMSM, but the proposed ICS FEM can calculate such local modes, possibly having some effect on the attached NSSS components. It was also demonstrated that the conventional LMSM can effectively capture overall fundamental dynamic responses similar to ISRS of the ICS FEM. However, simplified conventional LMSM might not capture dynamic responses in the HF range. It is concluded that the proposed ICS FEM and modeling approaches are suitable to capture such undisclosed modes and sufficient for generating ISRS in the HF range and for subsequent use of the seismic analysis and qualification of NSSS components.
It has been demonstrated that the conventional LMSM can effectively capture the overall dynamic responses with less computational efforts and cost. However, such conventional single-stick LMSM has a lack of modeling fidelity capturing the local modes such as “breathing” and “skewing” modes due to its modeling assumption. Thus, it is suggested using a multiple-stick LMSM to properly capture the ICS cross sectional deformations in different directions like in the “skewing” mode. It is also anticipated that the use of an advanced beam element like Beam188, capable of exhibiting warping DOF in ANSYS Mechanical, Release 13.0 (2010), can account for local deformations such as D-wall “breathing”. Therefore, it is recommended to use advanced multiple stick FEM as a future study to properly capture such “breathing” and “skewing” modes when the stick modeling approach is used.
REFERENCES
American Society of Civil Engineers. (1998). Seismic Analysis of Safety-Related Nuclear Structures and
Commentary. Reston, Virginia, USA
ANSYS Mechnical, Release 13.0, ANSYS, Inc., 2010
Chen, T. H. and Davenport, G. F. (1977). “A Unified Approach for Interior Concrete Design,” Conf.,
Structural Mechanics in Reactor Technology, San Francisco, CA, J3/8.
Cook, R. D., Malkus, D. S., Plesha, M. E. and Witt, R. J. (1989). Concepts and Applications of Finite Element Analysis, 3rd ed., John Wiley & Sons.
Mello, G.J.T., Cardoso, T.F., and Prates, C.L.M. (2009). “Reactor Building 3D-Model for Evaluating the Pressures on Concrete Regularization and Foundation Water proofing Membrane,” Conf.,
Structural Mechanics in Reactor Technology, Espoo, Finland, V, pg# 2514.
Moreschi, L. M., Pan, Q., Wang, S., and Malushte, S. R. (2012). “Generation of In-Structure Response Spectra for Nuclear Power Plant Subjected to High-Frequency Ground Motion,” Proc.,
International conference on Nuclear Engineering, ASME, Anaheim, CA.
NRC Report. (2012). Interim Staff Guidance on Seismic Issues Associated with High Frequency Ground Motion in Design Certification and Combined License Applications.
NRC Regulatory Guide 1.60. (1973). Design Response Spectra for Seismic Design of Nuclear Power Plants.
Qadeer, K.A., Sadiq, M., Pan, R., and Chunlin, H. (2009). “Seismic Analysis of Reactor Building of a NPP including Soil Structure Interaction Effects and Comparison with Two Additional Sites,”
Conf., Structural Mechanics in Reactor Technology, Espoo, Finland, V, pg# 1669.
Saha, S., Basu, P. C., and Dasgupta, A. (1993). “Seismic Response Analysis of Reactor Containment Structures-Axisymmetric Model with Modified Ground Motion,” Conf., Structural Mechanics in