_____________________________________________________________________________________________________
www.sciencedomain.org
Differences and Relationships between
Morphometric Parameters and Zinc Content in
Nonhyperplastic and Hyperplastic Prostate Glands
V. Zaichick
1*and S. Zaichick
21
Radionuclide Diagnostics Department, Medical Radiological Research Centre, Obninsk, Russia.
2Department of Medicine, University of Illinois, College of Medicine at Chicago, Chicago, USA.
Authors’ contributions
This work was carried out in collaboration between two authors. Author VZ collected samples of prostate tissue, designed the EDXRF of samples and carried out the statistical analysis of results. Author SZ managed the literature searches, wrote the first draft of the manuscript and translated the manuscript into English. Both authors read and approved the final manuscript.
Article Information
DOI: 10.9734/BJMMR/2015/17572 Editor(s): (1)Mahin Khatami, National Cancer Institute (Ret.), The National Institutes of Health, Bethesda, MD, USA.
Reviewers: (1)Vincenzo Ravo, Department of Radiotherapy, National Cancer Institute Pascale Naples, Italy.
(2)Mohamed Salah, Bani Suef Faculty of Medicine, Bani Suef University, Egypt. Complete Peer review History:http://www.sciencedomain.org/review-history.php?iid=1120&id=12&aid=9328
Received 18th March 2015 Accepted 11th May 2015 Published 21st May 2015
ABSTRACT
Aims: To clarify the changes in morphometric parameters and contents of zinc (Zn) and in the relationship between these characteristics in normal and hyperplastic human prostates, a quantitative morphometry and energy-dispersive X-ray fluorescence analysis was performed. Methodology: Samples of the human prostate of mass under 30 g were obtained from randomly selected autopsy specimens of 35 men (European-Caucasian aged 40-87 years) who died mainly from trauma. All prostate glands were divided into two portions, each with an anterior-posterior cross-section: one tissue portion was reviewed by an anatomical pathologist while the other was used for the Zn mass fraction measurement. After preliminary histological investigation the subjects were divided into a control group (n=24) and a benign prostatic hyperplasia (BPH) group (n=11). The mean percent volume of the stroma (S), glandular epithelium (E), glandular lumen (L) and glandular component (GC=E+L) were determined, and the mean ratios of percent volumes (S/E, S/GC, and E/L) were calculated for each prostate specimen.
Results: Increases in E (33.6% vs 26.7%) and GC (52.3% vs 44.4%) and also a decrease in S
(47.7% vs 55.6%), S/E ratio (1.53 vs 2.31) and S/GC ratio (0.97 vs 1.40) were observed, when values for Zn mass fraction in the earliest stage of BPH were compared with normality. A significant positive correlation between Zn and L (r = 0.65, P0.001) and between Zn and GC (r = 0.45, P0.05) and also a negative correlation between Zn and S (r = - 0.45, P0.05), between Zn and E/L ratio (r = - 0.63, P0.001), and between Zn and S/GC ratio (r = - 0.42, P0.05) was seen in histologically normal prostate tissue. A negative correlation between Zn and S and a positive correlation between Zn and L disappeared in the earliest stage of hyperplastic change. It means that a homeostatic control of Zn level in the histological structures of prostate tissue was partially destroyed.
Conclusion: For the first time it was quantitatively shown that BPH begins from the excessive proliferation of the glandular epithelium and that the Zn redistribution in the histological structures of prostate tissue is a pathogenetic factor of the disease.
Keywords: Prostate; benign prostatic hyperplasia; morphometry; zinc; correlations between morphometric parameters and zinc mass fractions.
1. INTRODUCTION
Benign prostatic hyperplasia (BPH) represents the most common urologic disease among elderly males. The prevalence of histological BPH is found in approximately 50-60% of males age 40-50, in over 70% at 60 years old and in greater than 90% of men over 70 [1]. To date, we still have no precise knowledge of the cellular and biochemical processes underlying the etiology and pathogenesis of BPH [2,3]. There are a few hypotheses on the subject [3-7]. The most common concept is based on the differentiating and growth-promoting actions of androgens [8]. Among other hypotheses the possible role of the Zn excess in prostate tissue in relation to BPH has been noted in the literature [9-11]. Zinc is the second most abundant metal in the human body, serving as a cofactor for more than 300 enzymes with various physiological functions [12]. Zinc plays an important role in prostate functions [13]. Moreover, in our previous studies it was shown that the levels of Zn and some other chemical elements in prostate tissue are the androgen-dependent parameters [14-19]. The concentrations of these chemical elements in prostate tissue jump up after puberty and continue to increase during the lifespan especially after the fourth decade [9,11,20,21]. It is well known that Zn is essential for cell proliferation and differentiation and for the regulation of DNA synthesis and mitosis [22-24].
According to Deering et al. [25], prostatic tissue contains three main components: glandular tissue, prostatic fluid, and fibromuscular tissue or stroma. Glandular tissue includes acini and ducts. Epithelial cells (E) surround the periphery of the acini and luminal surfaces (L) in acini (glandular lumen). Prostatic fluid fills the lumina
in acini. From time to time prostatic fluid is drained into ducts and the urethra. Stromal tissue (S) is composed of smooth muscle, connective tissue, fibroblasts, nerves, lymphatic and blood vessels. Thus, the volume of the prostate gland is a sum of volumes (E + L + S), and volume of the glandular component is a sum of the volumes (E + L). Weibel and Gomez [26] demonstrated that it is possible to quantitate morphological data (E, L, and S) using a stereological approach. Additionally, dimensionless parameters such as the S/E and S/L ratios were have been calculated in some studies [27-30].
The Zn content in tissue of the normal
[20,21,46-69] and hyperplastic
[46,47,50,52-54,56,58,59,61,64,65,70-84] prostate have been studied, also producing contradictory results. There are data available that indicate Zn accumulates mainly in the glandular epithelium and the specialized Zn uptake transporters in prostate epithelial cells [85-87]. However, Zn was found not only in the glandular epithelium but also in the stromal component [88]. Moreover, it was shown that in prostatic fluid Zn has its highest concentration [89]. Thus, the questions about the hyperplastic changes in the very beginning of BPH and relationships between Zn content and morphometric parameters in this period of the development of disease remained open.
This work had four aims. The first was to gain precise quantitative information on the morphometric parameters (percent volume of the stroma, epithelium, glandular lumen, and glandular component) and Zn content of the prostate gland in the earliest stage of hyperplastic change, in comparison with age-matched control subjects. The second aim was to calculate the percent volume ratios of “stroma to epithelium”, “stroma to glandular component”, and “epithelium to glandular lumen” for each prostate specimen and to determine mean values of these parameters in normality and in the earliest stage of hyperplastic change. The third aim was to investigate the age-related changes of morphometric parameters and Zn content of hyperplastic prostate by energy-dispersive X-ray fluorescent analysis (EDXRF). The final aim was to investigate the correlations between the Zn content and the percent volume of prostatic tissue components and between the Zn content and the different percent volume ratios of prostatic tissue components in normality and in the earliest stage of hyperplasticchange.
All studies were approved by the Ethical Committee of the Medical Radiological Research Center, Obninsk.
2. MATERIALS AND METHODS
Samples of the human prostate were obtained from randomly selected autopsy specimens of 35 males (European-Caucasian) aged 40 to 87 years. The typical cause of death in most of these subjects was trauma. The subjects’ available clinical data were reviewed. None of the subjects had a history of an intersex condition or an endocrine disorder that would
affect the normal state of the prostate. None of them had neoplastic or other chronic diseases. None of the subjects were receiving medications which would affect the prostate.
The weight of each selected gland was under 30 g. All prostate glands were divided (with an anterior-posterior cross-section) into two portions using a titanium scalpel. One tissue portion was reviewed by an anatomical pathologist while the other was used for the Zn content determination. Only posterior part of the prostate, including the transitional, central, and peripheral zones, was investigated.
The prostate specimens intended for the morphometric study were transversely cut into consecutive sections, which were fixed in buffered formalin (pH 7.4) and embedded in paraffin wax. The paraffin-embedded specimens were sectioned at 5 μm thickness and processed using routine histological methods. All samples were conventionally stained with haematoxylin and eosin, and then all histological slides were examined by an anatomical pathologist to detect any focus of carcinoma, or other neoplasm, to exclude samples with artifact and to select slides for further morphometric evaluation. The occurrence of histological alterations (the earliest stage of hyperplastic changes) in 11 glands led us to evaluate the influence of these alterations on the morphometric parameters and Zn content. The subjects were divided into a control group (n=24, age 50 to 87 years, MeanSEM – 602) and a BPH group (n=11, age 40 to 83, MeanSEM – 644).
After the samples intended for the Zn content determination were weighed, they were transferred to be stored at -20°C, until they were freeze-dried, weighed once again and homogenized. The pounded sample weighing about 8 mg was applied to the piece of adhesive tape serving as a samplebacking. To determine the Zn content by comparison with a known standard, aliquots of commercial, chemically pure compounds were used. The microliter standards were placed on disks made of thin, ash-free filter papers fixed on the adhesivetape pieces and dried in a vacuum. Ten subsamples of the Certified Reference Material (CRM) IAEA H-4 (animal muscle) weighing about 8 mg were analyzed to estimate the precision and accuracy of results. The CRM IAEA H-4 subsamples were prepared in the same way as the samples of dry homogenized prostate tissue. All samples of prostate tissue were prepared in duplicate and mean values of Zn mass fraction were used in final calculations.
The facility for EDXRF analysis included an annular 109Cd source with an activity of 2.56 GBq, Si(Li) detector and a PC based portable multichannel analyzer. Its resolution was 270 eV at the 5.9 keV line of a 55Fe-source. The duration of the Zn measurements was 20 min. The intensity of the Kα-line of Zn for samples and standards was estimated using a calculation based on the total area of the corresponding photopeak in the spectra. The Zn mass fraction was calculated using a relative method, comparing the intensities of Kα-lines for samples and standards. Further details of the sample preparation, the facility for performing EDXRF, the methods of analysis and quality control of analytical results were presented in our previous publication concerning the EDXRF of chemical element contents in prostate specimens [20,63].
Using the Microsoft Office Excel program to provide a summary of statistical results, the arithmetic mean, standard deviation, standard error of mean, minimum and maximum values, median, percentiles with 0.025 and 0.975 levels were calculated for all the morphometric parameters obtained and the Zn mass fractions. For the estimation of the Pearson correlation coefficient between the morphometric parameters and Zn mass fractions in prostate tissue the Microsoft Office Excel programs were also used. The reliability of difference in the results between two groups of subjects was evaluated by parametric Student’s t-test.
3. RESULTS
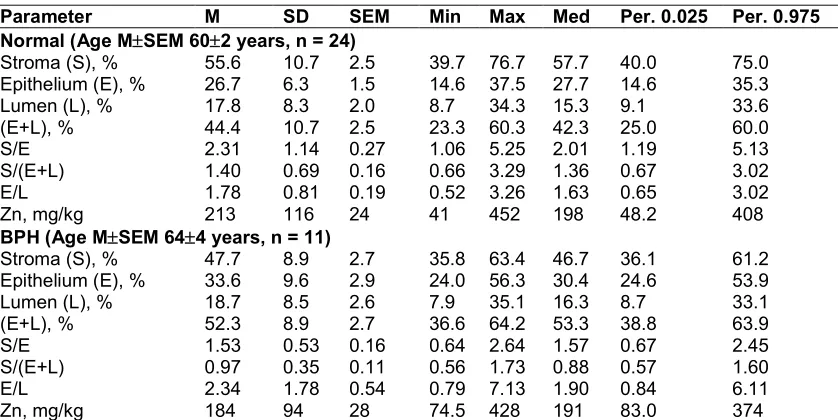
Table 1 depicts the basic statistical parameters (arithmetic mean, standard deviation, standard error of mean, minimal and maximal values, median, percentiles with 0.025 and 0.975 levels) of the quantitative morphometric parameters (S, E, L, GC, S/E, S/GC, and E/L) and the Zn mass fractions in two groups of European-Caucasian males aged 40-87 years with nonhyperplastic andinitial stagehyperplastic prostate glands.
The differences between mean values of some morphometric parameters and Zn mass fraction of normal and hyperplastic prostate glands are presented in Table 2.
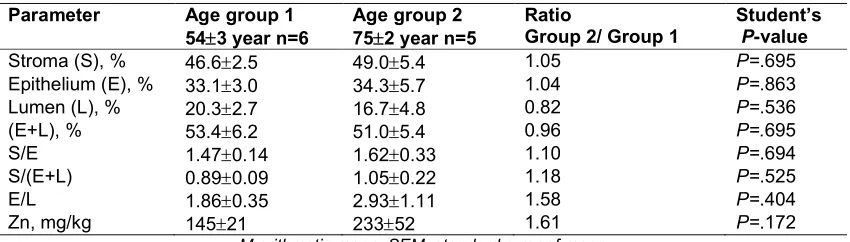
To estimate the effect of age on the morphometric parameters and the Zn mass fractions in BPH glands we examined two age groups: the first comprised persons with ages ranging from 50 to 60 years (mean age 543 years, n=6) and the second comprised those with ages ranging from 61 to 87 years (mean age 752 years, n=5). The means, the ratios of means and the reliability of difference between mean values of morphometric parameters and Zn mass fractions in two age groups are presented in Table 3.
The data of reciprocal relationship (values of r – coefficient of correlation) between Zn mass fractions and all morphometric parameters identified by us for nonhyperplastic and initial stagehyperplastic prostate glands are presented in Table 4.
presented in Table 5. The results for the glandular lumen were found as L(%) = (100% – S – E), all in %. Arenas et al. [38] and Pirus [43] measured the volumes of prostate smooth muscle and connective tissue. Using these data we calculated the fibromuscular component (S) as the sum of prostate smooth muscle and connective tissue. Doehring et al. [28] only documented the S/E ratio. All other means of the S/E, S/(E+L), and E/L ratios were estimated using authors’ data and those calculated in this
work for the morphometric parameters of prostate tissue.
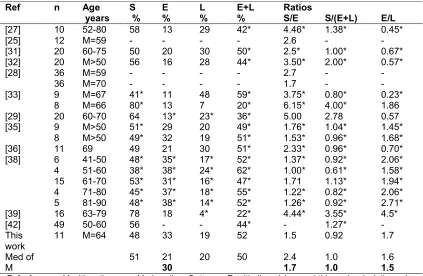
Some histologic parameters of untreated hyperplastic prostate gland of persons above 40 years of age according to data from the literature [25,27-29,31-33,35,36,38,39,42] are compared with our results in Table 6. Because in some studies [29,38,39] mean percent volumes of prostate stroma and glandular epithelium only were measured, we calculated mean percent volumes of glandular lumen (L) as L(%) = (100% – S – E), all in %.
Table 1. Certain statistical characteristics of the histologic components (percent volume), some of their ratios, and Zn mass fraction (on a wet mass basis) in normal and hyperplastic
prostate glands
Parameter M SD SEM Min Max Med Per. 0.025 Per. 0.975
Normal (Age MSEM 602 years, n = 24)
Stroma (S), % 55.6 10.7 2.5 39.7 76.7 57.7 40.0 75.0
Epithelium (E), % 26.7 6.3 1.5 14.6 37.5 27.7 14.6 35.3
Lumen (L), % 17.8 8.3 2.0 8.7 34.3 15.3 9.1 33.6
(E+L), % 44.4 10.7 2.5 23.3 60.3 42.3 25.0 60.0
S/E 2.31 1.14 0.27 1.06 5.25 2.01 1.19 5.13
S/(E+L) 1.40 0.69 0.16 0.66 3.29 1.36 0.67 3.02
E/L 1.78 0.81 0.19 0.52 3.26 1.63 0.65 3.02
Zn, mg/kg 213 116 24 41 452 198 48.2 408
BPH (Age MSEM 644 years, n = 11)
Stroma (S), % 47.7 8.9 2.7 35.8 63.4 46.7 36.1 61.2
Epithelium (E), % 33.6 9.6 2.9 24.0 56.3 30.4 24.6 53.9
Lumen (L), % 18.7 8.5 2.6 7.9 35.1 16.3 8.7 33.1
(E+L), % 52.3 8.9 2.7 36.6 64.2 53.3 38.8 63.9
S/E 1.53 0.53 0.16 0.64 2.64 1.57 0.67 2.45
S/(E+L) 0.97 0.35 0.11 0.56 1.73 0.88 0.57 1.60
E/L 2.34 1.78 0.54 0.79 7.13 1.90 0.84 6.11
Zn, mg/kg 184 94 28 74.5 428 191 83.0 374
M arithmetic mean, SD standard deviation of mean, SEM standard error of mean, Min minimum value, Max maximum value, Med median, Per.0.025 percentile with 0.025 level, Per.0.975 percentile with 0.975 level
Table 2.Differences between mean values (MSEM) of some morphometric parameters (percent volumes, or ratios of percent volumes)and Zn mass fraction (on a wet mass basis) of
normal and hyperplastic prostate glands
Parameter BPH n=11 Normal n=24 Ratio BPH/normal Student’s t-test P-value
Stroma (S), % 47.72.7 55.62.5 0.86 P=.042
Epithelium (E), % 33.62.9 26.71.5 1.26 P=.049
Lumen (L), % 18.72.6 17.82.0 1.05 P=.785
(E+L), % 52.32.7 44.42.5 1.18 P=.042
S/E 1.530.16 2.310.27 0.66 P=.020
S/(E+L) 0.970.11 1.400.16 0.69 P=.035
E/L 2.340.54 1.780.19 1.31 P=.341
Zn, mg/kg 18428 21324 0.86 P=.435
Table 3.Differences between mean values (MSEM) of some morphometric parameters (percent volumes, or ratios of percent volumes) and Zn mass fraction (on a wet mass basis) of
hyperplastic prostate gland in two age groups
Parameter Age group 1
543 year n=6
Age group 2 752 year n=5
Ratio
Group 2/ Group 1
Student’s P-value
Stroma (S), % 46.62.5 49.05.4 1.05 P=.695
Epithelium (E), % 33.13.0 34.35.7 1.04 P=.863
Lumen (L), % 20.32.7 16.74.8 0.82 P=.536
(E+L), % 53.46.2 51.05.4 0.96 P=.695
S/E 1.470.14 1.620.33 1.10 P=.694
S/(E+L) 0.890.09 1.050.22 1.18 P=.525
E/L 1.860.35 2.931.11 1.58 P=.404
Zn, mg/kg 14521 23352 1.61 P=.172
M arithmetic mean, SEM standard error of mean
The data of Arenas et al. [38] for males of age above 50 years was treated by us, as was done with their results for nonhyperplastic prostate glands in Table 5. In some studies [33,35,38] mean percent volumes of prostate smooth muscle and connective tissue only were measured. Using these data we calculated the fibromuscular component (S) as the sum of prostate smooth muscle and connective tissue and glandular component (E+L) as the remainder (100%- S), in %. Deering et al. [25] and Doehring et al. [28] documented only the S/E ratio. All other means of the S/E, S/(E+L), and E/L ratios were estimated using authors’ data and those calculated in this work for the morphometric parameters of BPH tissue.
Table 4.Correlations (r - coefficient of correlation) between the Zn mass fraction
and morphometric parameters in nonhyperplastic and hyperplastic prostate
gland
Histologic parameter
Normal (n=24)
BPH (n=11)
Stroma (S), % -0.453a -0.033
Epithelium (E), % -0.089 -0.413
Lumen (L), % 0.650b 0.501
(E+L), % 0.453a 0.033
S/E -0.214 0.195
S/(E+L) -0.418a -0.001
E/L -0.625b -0.347
Statistically significant correlations (a p≤0.05, b p≤0.001)
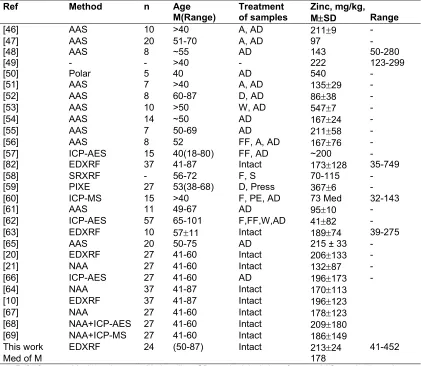
Tables 7 and 8 depict the comparison of our results with published data for Zn mass fraction in nonhyperplastic and hyperplastic prostate glands of males in age above 40 years, respectively. Because some values of the Zn
mass fraction were not expressed on a wet mass basis in the above work, we calculated these values using the medians of published data for a water content of 83% in adult prostate [91] and 80% in BPH tissue [46].
4. DISCUSSION
For a morphological quantitation of prostatic tissue components in normality and diseases, different names of units are used, including “percent area density” [30,37,41], “relative areas” [44], “mean rate of the area” [34], and “volumetric density” [39]. In our opinion all these units reflect the relative volume as a percentage (percent volume) of the different components of prostate tissue and this clear term is used in our study. Some authors used absolute values of “area”, mm2 [39] or of “volume”, mm3 [38]. If the whole “area” or volume of the prostate was measured it would also be possible to calculate the percent volumes of the different components of prostate tissue.
Using the technique of morphometric and EDXRF analysis, we quantified the histological components and Zn mass fraction of the prostates of males ranging from 40 to 87 years of age. The collection of prostates included the histologically normal glands and glands with the earliest stage of hyperplasticchange. The mean values and all selected statistical parameters were calculated for percent volumes of S, E, L and GC and percent volume ratios of S/E, S/GC and E/L and for the Zn mass fraction (Table 1). The similarity of arithmetic means and median values of all the parameters investigated (Table 1) confirms the normal distribution of
Table 5.Mean (medians) values of some morphometric parameters of nonhyperplastic prostate glands of males of age above 40 years, according to data from the literature in
comparison with our results
Ref n Age
years S % E % L % E+L % Ratios
S/E S/(E+L) E/L
[32] 20 M>40 56.4 15.5 27.6* 43.1* 3.6* 1.3* 0.56*
[28] 36 M=70 - - - - 1.7 - -
[38] 23
19 51-60 61-70 50* 67* 27* 15* 23* 18* 50* 33* 1.85* 4.47* 1.00* 2.03* 1.17* 0.89*
[43] 119 61-75 53* 47* 1.13*
This work 24 M=60 56 26 18 44 2.2 1.3 1.4
Med of M 56 21.1
23.5
20.5 44 2.2
2.38
1.22 1.27
1.03 1.15 Ref reference, M arithmetic mean, Med median, S stroma, E epithelium, L lumen; * Calculation ofthis work use
means (medians) of reference data.; Bold this work’s calculation using median of means for S, E, and L; E
calculated as E= (E+L)-L to keep a balance S+E+L = 100%; “-“ no data available
Table 6.Means (medians) of some morphometric parameters of untreated hyperplastic prostate glands of males of age above 40 years, according to data from the literature in
comparison with our results
Ref n Age
years S % E % L % E+L % Ratios
S/E S/(E+L) E/L
[27] 10 52-80 58 13 29 42* 4.46* 1.38* 0.45*
[25] 12 M=59 - - - - 2.6 - -
[31] 20 60-75 50 20 30 50* 2.5* 1.00* 0.67*
[32] 20 M>50 56 16 28 44* 3.50* 2.00* 0.57*
[28] 36
36 M=59 M=70 - - - - - - - - 2.7 1.7 - - - -
[33] 9
8 M=67 M=66 41* 80* 11 13 48 7 59* 20* 3.75* 6.15* 0.80* 4.00* 0.23* 1.86
[29] 20 60-70 64 13* 23* 36* 5.00 2.78 0.57
[35] 9
8 M>50 M>50 51* 49* 29 32 20 19 49* 51* 1.76* 1.53* 1.04* 0.96* 1.45* 1.68*
[36] 11 69 49 21 30 51* 2.33* 0.96* 0.70*
[38] 6 41-50 48* 35* 17* 52* 1.37* 0.92* 2.06*
4 51-60 38* 38* 24* 62* 1.00* 0.61* 1.58*
15 61-70 53* 31* 16* 47* 1.71 1.13* 1.94*
4 71-80 45* 37* 18* 55* 1.22* 0.82* 2.06*
5 81-90 48* 38* 14* 52* 1.26* 0.92* 2.71*
[39] 16 63-79 78 18 4* 22* 4.44* 3.55* 4.5*
[42] 49 50-60 56 - - 44* - 1.27* -
This work
11 M=64 48 33 19 52 1.5 0.92 1.7
Med of M
51 21
30
20 50 2.4
1.7
1.0 1.0
1.6 1.5 Ref reference, M arithmetic mean, Med median, S stroma, E epithelium, L lumen; * this work calculation using
means (medians) of reference data; Bold this work’s calculation using median of means for S, E, and L; E calculated as E= (E+L)-L using S+E+L = 100% for normalization; “-“ no data available
In the glands with the earliest stage of hyperplastic change, we have observed an increase in the percent volume of epithelium and glandular component compared to normal prostatic tissue and a decrease in the percent volume of stroma and the percent volume ratio of stroma/epithelium and of stroma/glandular
Table 7.Means values of Zn mass fraction (on a wet mass basis) in nonhyperplastic prostate glands of males of age above 40 years, according to data from the literature in comparison
with our results
Ref Method n Age
M(Range)
Treatment of samples
Zinc, mg/kg,
MSD Range
[46] AAS 10 >40 A, AD 2119 -
[47] AAS 20 51-70 A, AD 97 -
[48] AAS 8 ~55 AD 143 50-280
[49] - - >40 - 222 123-299
[50] Polar 5 40 AD 540 -
[51] AAS 7 >40 A, AD 13529 -
[52] AAS 8 60-87 D, AD 8638 -
[53] AAS 10 >50 W, AD 5477 -
[54] AAS 14 ~50 AD 16724 -
[55] AAS 7 50-69 AD 21158 -
[56] AAS 8 52 FF, A, AD 16776 -
[57] ICP-AES 15 40(18-80) FF, AD ~200 -
[82] EDXRF 37 41-87 Intact 173128 35-749
[58] SRXRF - 56-72 F, S 70-115 -
[59] PIXE 27 53(38-68) D, Press 3676 -
[60] ICP-MS 15 >40 F, PE, AD 73 Med 32-143
[61] AAS 11 49-67 AD 9510 -
[62] ICP-AES 57 65-101 F,FF,W,AD 4182 -
[63] EDXRF 10 5711 Intact 18974 39-275
[65] AAS 20 50-75 AD 215 ± 33 -
[20] EDXRF 27 41-60 Intact 206133 -
[21] NAA 27 41-60 Intact 13287 -
[66] ICP-AES 27 41-60 AD 196173 -
[64] NAA 37 41-87 Intact 170113
[10] EDXRF 37 41-87 Intact 196123
[67] NAA 27 41-60 Intact 178123
[68] NAA+ICP-AES 27 41-60 Intact 209180
[69] NAA+ICP-MS 27 41-60 Intact 186149
This work EDXRF 24 (50-87) Intact 21324 41-452
Med of M 178
Ref reference, M arithmetic mean, Med median, SD standard deviation of mean; AAS atomic absorption spectrometry, Polar polarography, ICP-AESinductively coupled plasma atomic emission spectrometry, PIXE
proton induced X-ray emission, EDXRF energy-dispersive X-ray fluorescence analysis, SRXRF synchrotron radiation X-ray fluorescence analysis; A ashing, AD acid digestion, W washing with water, D thermal drying, G
homogenization of fresh tissue, FF fat free, F fixation (formalin, ethanol, and etc.), S staining, PE paraffin-embedding; “-“ no data available
No difference between Zn mass fractions in nonhyperplastic and hyperplastic prostate tissue was found. This finding agrees well with data of some other known studies [52,56,92,93]. It is important to mark that the age-matched control group was used because there was no a statistically significant difference between the mean values of age in two groups of subjects with nonhyperplastic and hyperplastic prostate glands.
We have not observed any age-related changes in the morphometric parameters and Zn mass fraction of hyperplastic tissue of prostate glands
with weight under 30 g (Table 3). Ishigooka et al. [94] showed that variation of quantities ofstromal and glandular components in established BPH did not correlate with age. No published data referring to age-related changes of Zn mass fraction in prostate hyperplastic tissue have been found.
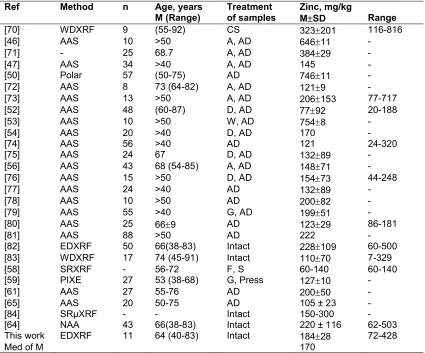
Table 8. Means values of Zn mass fraction (on a wet mass basis) in untreated hyperplastic prostate of males in age above 40 according to data from the literature in comparison with our
results
Ref Method n Age, years
M (Range)
Treatment of samples
Zinc, mg/kg
MSD Range
[70] WDXRF 9 (55-92) CS 323201 116-816
[46] AAS 10 >50 A, AD 64611 -
[71] - 25 68.7 A, AD 38429 -
[47] AAS 34 >40 A, AD 145 -
[50] Polar 57 (50-75) AD 74611 -
[72] AAS 8 73 (64-82) A, AD 1219 -
[73] AAS 13 >50 A, AD 206153 77-717
[52] AAS 48 (60-87) D, AD 7792 20-188
[53] AAS 10 >50 W, AD 7548 -
[54] AAS 20 >40 D, AD 170 -
[74] AAS 56 >40 AD 121 24-320
[75] AAS 24 67 D, AD 13289 -
[56] AAS 43 68 (54-85) A, AD 14871 -
[76] AAS 15 >50 D, AD 15473 44-248
[77] AAS 24 >40 AD 13289 -
[78] AAS 10 >50 AD 20082 -
[79] AAS 55 >40 G, AD 19951 -
[80] AAS 25 669 AD 12329 86-181
[81] AAS 88 >50 AD 222 -
[82] EDXRF 50 66(38-83) Intact 228109 60-500
[83] WDXRF 17 74 (45-91) Intact 11070 7-329
[58] SRXRF - 56-72 F, S 60-140 60-140
[59] PIXE 27 53 (38-68) G, Press 12710 -
[61] AAS 27 55-76 AD 20050 -
[65] AAS 20 50-75 AD 105 ± 23 -
[84] SRμXRF - - Intact 150-300 -
[64] NAA 43 66(38-83) Intact 220 ± 116 62-503
This work EDXRF 11 64 (40-83) Intact 18428 72-428
Med of M 170
Ref reference, M arithmetic mean, Med median, SD standard deviation of mean; WDXRF wave dispersive X-ray fluorescence analysis, AAS atomic absorption spectrophotometry, Polar polarography, PIXE proton induced
X-ray emission, EDXRF – energy dispersive X-ray fluorescence analysis, SRXRF synchrotron radiation X-ray fluorescence analysis, SRμXRF synchrotron radiation micro X-ray fluorescence analysis; CS cutting of slices, A
ashing, AD acid digestion, W washing with water, D thermal drying, G homogenization of fresh tissue, F fixation (formalin, ethanol, and etc.), S staining;“-“ no data available
A qualitative positive correlation between the Zn content and the glandular component volume in normal prostate tissue was previously shown by Mawson and Fischer [92]. A strongly pronounced negative correlation between the prostatic Zn and the percent volume of stroma (r = - 0.45,
P0.05), between the prostatic Zn and percent
volume ratios of E/L (r = - 0.63, P0.001), and between the prostatic Zn and percent volume ratios of S/GC (r = - 0.42, P0.05) was observed by us also (Table 4). A qualitative negative correlation between the zinc content and the stromal volume was documented by Gonic et al. [95]. This indicates that the glandular lumen is
and epithelial cells began to increase and in glandular lumen to decrease. In our earlier publications it was discussed in detail [9-11] that the age-related excessive Zn level in prostatic cells is probably one of the main factors influencing the enlargement of the prostate gland, as well as the initiation and progression of prostate cancer. Findings of this study show that in spite of the Zn mass fraction in normal and hyperplastic prostate are almost equal, the level of Zn in cells of hyperplastic prostate has to be higher than in cells of normal gland. Because the
biochemical changes preceded the
morphological transformation of tissue, we can hypothesize that the Zn redistribution in the histological structures of prostate tissue is a pathogenetic factor of BPH.
The validity of our morphometric data for nonhyperplastic prostate glands confirms the good agreement with medians of results cited by other researches for the normal human prostate of men aged above 40 years (Table 5). The data of the present study also agree well with medians of published results for hyperplastic prostate glands of untreated males aged over 40 (Table 6).
The result obtained for Zn mass fraction, as shown in Table 7, was higher (20%) the median of means cited by other researches for nonhyperplastic prostate glands of men in age above 40. The present study also demonstrated a value for Zn mass fraction for hyperplastic prostate glands higher (8%) than the median of means cited by other researches (Table 8). The majority of published data are based on non-intact tissue. In many studies tissue samples were ashed or dried at high temperature for many hours (see Tables 7 and 8). In other cases, prostate samples were treated with solvents (distilled water, ethanol, formalin etc). There is evidence that by use of these methods some quantities of certain chemical elements, including Zn, are lost as a result of this treatment [96,97].
The range of means of Zn mass fraction reported in the literature for nonhyperplastic (from 86 to 547 mg/kg on wet mass basis) and for untreated hyperplastic prostate (from 77 to 754 mg/kg on wet mass basis) vary widely (Tables 7 and 8, respectively). This can be explained by a dependence of Zn content on many factors, including the region of the prostate, from which the sample was taken, age, ethnicity, mass of the gland, and the stage of BPH. Not all these
factors were strictly controlled in other studies. Additionally, the levels of quality control were insufficient as only in a few studies were certified reference materials for Zn used.
5. CONCLUSION
The present study represents the first comprehensive quantitative evaluation of the histologic and Zn content changes in the human prostate gland at the earliest stage of benign hyperplasia. Increases in the percent volume of epithelium and glandular component were observed. It was also found a decrease in the percent volume of stroma and the percent volume ratios stroma/epithelium and of stroma/glandular component. Thus, our data show that BPH on the first stage of development characterized by proliferation not stromal, but epithelial cells.
No difference between Zn mass fractions in nonhyperplastic and hyperplastic prostate tissue was observed. The observed correlations between morphometric parameters and Zn mass fraction indicate that the Zn more tightly binds with the prostatic fluid than with the cells of nonhyperplastic prostate tissue. In BPH tissue these relationships were greatly modified. A negative correlation between the prostatic Zn and the percent volume of stroma and a positive correlation between the prostatic Zn and the percent volume of lumen disappeared in the earliest stage of hyperplastic change. It means that a homeostatic control of the Zn level in the histological structures of prostate tissue was partially destroyed and the Zn content in stromal and epithelial cells began to increase and in glandular lumen to decrease.
Excessive Zn level in prostatic cells may be one of the main factors influencing the enlargement of the prostate gland. Because the biochemical
changes preceded the morphological
transformation of tissue, we can hypothesize that the Zn redistribution in the histological structures of prostate tissue is a pathogenetic factor of BPH.
ACKNOWLEDGEMENTS
CONSENT
It is not applicable.
ETHICAL APPROVAL
All studies were approved by the Ethical Committee of the Medical Radiological Research Center, Obninsk.
COMPETING INTERESTS
Authors have declared that no competing interests exist.
REFERENCES
1. Roehrborn C, McConnell J. Etiology, pathophysiology, epidemiology and natural history of benign prostatic hyperplasia. In: Walsh P, Retik A, Vaughan E, Wein A, editors. Campbell’s Urology. 8th ed. Philadelphia: Saunders. 2002;1297–336. 2. Lee KL, Peehl DM. Molecular and cellular
pathogenesis of benign prostatic hyperplasia. J Urol. 2004;172(5):1784–91. 3. Corona G, Vignozzi L, Rastrelli G, Lotti F,
Cipriani S, Maggi M. Benign prostatic hyperplasia: A new metabolic disease of the aging male and its correlation with sexual dysfunctions. Int J Endocrinol; 2014. Article ID 329456.
Available:http://dx.doi.org/10.1155/2014/32 9456
4. Isaacs JT, Coffey DS. Etiology and disease process of benign prostatic hyperplasia. Prostate. 1989;(Suppl 2):33– 50.
5. Carson C, Rittmaster R. The role of dihydrotestosterone in benign prostatic hyperplasia. Urology. 2003;61(4 Suppl 1):2–7.
6. Soulitzis N, Karyotis I, Delakas D, Spandidos DA. Expression analysis of peptide growth factors VEGF, FGF2, TGFB1, EGF and IGF1 in prostate cancer and benign prostatic hyperplasia. Int J Oncol. 2006;29:305–14.
7. Ho CK, Habib FK. Estrogen and androgen signaling in the pathogenesis of BPH. Nat Rev Urol. 2011;8:29–41.
8. Patel ND, Parsons JK. Epidemiology and etiology of benign prostatic hyperplasia and bladder outlet obstruction. Indian J Urol. 2014;30:170–6.
9. Zaichick V, Zaichick S. Role of zinc in prostate cancerogenesis. In: Anke M et al, editors. Mengen und Spurenelemente, 19 Arbeitstagung. Jena: Friedrich-Schiller-Universitat. 1999;104–15.
10. Zaichick V, Zaichick S. Age-related histological and zinc content changes in adult nonhyperplastic prostate glands. Age. 2014;36(1):167-81.
11. Zaichick V. INAA and EDXRF applications in the age dynamics assessment of Zn content and distribution in the normal human prostate. J Radioanal Nucl Chem. 2004;262:229–34.
12. Coleman JE. Zinc proteins: enzymes, storage proteins, transcription factors, and replication proteins. Annu Rev Biochem. 1992;61:897–946.
13. Costello LC, Franklin RB. Novel role of zinc in the regulation of prostate citrate metabolism and its implications in prostate cancer. Prostate. 1998;35:285–96.
14. Zaichick S, Zaichick V. Relations of morphometric parameters to zinc content in paediatric and nonhyperplastic young adult prostate glands. Andrology. 2013; 1(1):139–46.
15. Zaichick V, Zaichick S. The effect of age on Br, Ca, Cl, K, Mg, Mn, and Na mass fraction in pediatric and young adult prostate glands investigated by neutron activation analysis. Appl Radiat Isot. 2013; 82:145–51.
16. Zaichick V, Zaichick S. INAA application in the assessment of Ag, Co, Cr, Fe, Hg, Rb, Sb, Sc, Se, and Zn mass fraction in pediatric and young adult prostate glands. J Radioanal Nucl Chem. 2013;298(3): 1559–66.
17. Zaichick V, Zaichick S. NAA-SLR and ICP-AES Application in the assessment of mass fraction of 19 chemical elements in pediatric and young adult prostate glands. Biol Trace Elem Res. 2013;156(1):357–66. 18. Zaichick V, Zaichick S. Use of neutron activation analysis and inductively coupled plasma mass spectrometry for the determination of trace elements in pediatric and young adult prostate. American Journal of Analytical Chemistry. 2013;4: 696–706.
19. Zaichick V, Zaichick S. Androgen-dependent chemical elements of prostate gland. Androl Gynecol: Curr Res. 2014;2(2).
20. Zaichick S, Zaichick V. The Br, Fe, Rb, Sr, and Zn content and interrelation in intact and morphologic normal prostate tissue of adult men investigated by energy dispersive ray fluorescent analysis. X-Ray Spectrom. 2011;40:464–9.
21. Zaichick S, Zaichick V. The effect of age on Ag, Co, Cr, Fe, Hg, Sb, Sc, Se, and Zn contents in intact human prostate investigated by neutron activation analysis. Appl Radiat Isot. 2011;69:827–33.
22. Beyersmann D, Haase H. Functions of zinc in signaling, proliferation and differentiation of mammalian cells. BioMetals. 2001; 14(3-4):331–41.
23. Helmersson A, von Arnold S, Bozhkov PV. The level of free intracellular zinc mediates programmed cell death/cell survival decisions in plant embryos. Plant Physiology. 2008;147:1158–67.
24. Li Y, Maret W. Transient fluctuations of intracellular zinc ions in cell proliferation. Exp Cell Res. 2009;315(14):2463–70. 25. Deering RE, Choongkittaworn M, Bigler
SA, Aramburu E, King J, Brawer MK. Morphometric quantitation of stroma in human benign prostatic hyperplasia. Urology. 1994;44:64–7.
26. Weibel ER, Gomez DM. A principle for counting tissue structures on random sections. J Appl Phys. 1962;17:343–8. 27. Bartsch G, Muller HR, Oberholzer M, Rohr
HP. Light microscopic stereological analysis of the normal human prostate and of benign prostatic hyperplasia. J Urol. 1979;122:487–91.
28. Doehring CB, Sanda MG, Partin AW, Sauvageot J, Juo H, Beaty H, et al. Histopathologic characterization of hereditary benign prostatic hyperplasia. Urology. 1996;48:650–3.
29. Montironi R, Valli M, Fabris G. Treatment of benign prostatic hyperplasia with 5-alpha-reductase inhibitor: Morphological changes in patients who fail to respond. J Clin Pathol. 1996;49:324–8.
30. Shapiro E, Hartanto V, Perlman E J, Tang R, Wang B, Lepor H. Morphometric analysis of pediatric and nonhyperplastic prostate glands: evidence that BPH is not a unique stromal process. Prostate. 1997;33:177–82.
31. Marks LS, Tretger B, Dorey FJ, Fu YS, Dekernion JB. Morphometry of the prostate: I. Distribution of tissue components in hyperplastic glands. Urology. 1994;44(4):486–92.
32. Fang-ming D, Tong-li X, Fang-liu G, et al. A quantitative morphometry of the normal and the benign hyperplastic prostate in Chinese. Chinese Journal of Urology. 1995;12.
Available:http://en.cnki.com.cn/Article_en/ CJFDTOTAL-ZHMN403.013.htm Chinese 33. Lepor H, Shapiro E, Wang B, Liang YC.
Comparison of the cellular composition of benign prostatic hyperplasia in Chinese and Caucasian-American men. Urology. 1996;47(1):38–42.
34. Sakai S, Shimazaki J. Relationship between the quantitative morphometry and the clinical response to alpha adrenergic blocker in benign prostatic hyperplasia. Nihon Hinyokika Gakkai Zasshi. 1996; 87(3):695–701.
35. Zlotta AR, Sattar AA, Wespes E, Noel JC, Schulman CC. Is one single prostate biopsy helpful for choosing a medical treatment of benign prostatic hyperplasia? A quantitative computerized morphometric study. Urology. 1996;47(3):329–34. 36. Polat Ö, Gul O, Özbey I, Gundogdu C,
Bayraktar Y. Histologic evaluation in patients with benign prostatic hyperplasia treated with Finasteride and surgery alone. Tr J of Medical Sciences. 1998;28:157–61. 37. Aoki Y, Arai Y, Maeda H, Okubo K, Shinohara K. Racial differences in cellular composition of benign prostatic hyperplasia. Prostate. 2001;49:243–50. 38. ArenasMI, Romo E, Royuela M, Ruiz A,
Fraile B, Sánchez-Chapado M, et al. Morphometric evaluation of the human prostate. Int J Androl. 2001;24:37–47. 39. Chagas MA, Babinski MA, Costa WS,
Sampaio FJB. Stromal and acinar components of the transition zone in normal and hyperplastic human prostate. BJU Int. 2002;89:699–702.
40. Babinski MA, Chagas MA, Costa WS, Sampaio FJ. Prostatic epithelial and luminal area in the transition zone acini: morphometric analysis in normal and hyperplastic human prostate. BJU Int. 2003;92:592–6.
41. Lepor H. Pathophysiology of benign prostatic hyperplasia in the aging male population. Rev Urol. 2005;7(Suppl 4):S3– S12.
43. Pirus Ye F. The male prostate morphological changes in postnatal ontogenesis. PhD dissertation. Ternopil: Ternopil State Medical University of the Ministry of Public Health of Ukraine; 2006. Ukrainian
44. Kim HS, Lee SW, Kim EK, Cho JM, Han KH, Kang JY, Yoo TK. Relationships between relative proportion of tissue components, urodynamic parameters, and low urinary tract symptoms in patients with benign prostatic hyperplasia. Korean J Urol. 2009;50:859–64.
45. Rohr HP, Bartsch G. Human benign prostatic hyperplasia: a stromal disease. New perspectives by quantitative morphology. Urology. 1980;16:625–30. 46. Györkey F, Min K-W, Huff JA, Györkey P.
Zinc and magnesium in human prostate gland: Normal, hyperplastic, and neoplastic. Cancer Res. 1967;27(8 Part 1):1349–53.
47. Hienzsch E, Schneider H-J, Anke M. Vergleichende Untersuchungen zum Mengen- und Spurenelementgehalt der normalen Prostata, des Prostataadenoms und des Prostatakarzinoms. Z Urol Nephrol. 1970;63:543–6.
48. Boström K, Andersson L. Creatin
phosphokinase relative to acid
phosphatase, lactate dehydrogenase, zinc and fructose in human semen with special reference to chronic prostatitis. Scand J Urol Nephrol. 1971;5(2):123–32.
49. Lindholmer C, Glaumann H. Zinc and magnesium in human male reproductive tract. Andrologie (Berlin). 1972;4(3):231–7. 50. Dhar NK, Goel TC, Dube PC, Chowdhury AR, Kar AB. Distribution and concentration of zinc in the subcellular fractions of benign hyperplastic and malignant neoplastic human prostate. Exp Mol Pathol. 1973;19: 139–42.
51. Müntzing J, Nilson T, Polasek J. Zinc and β-glucuronidase in human prostate. Scand J Urol Nephrol. 1974;8(1):87–90.
52. Habib FK. Evaluation of androgen metabolism studies in human prostate cancer – correlation with zinc levels. Prev Med. 1980;9(5):650–6.
53. Jafa A, Mahendra NM, Chowdhury AR, Kamboj VP. Trace elements in prostatic tissue and plasma in prostatic diseases of man. Indian J Cancer. 1980;17(1):34–7. 54. Leissner KM, Fielkegard B, Tisell L-E.
Concentration and content of zinc in
human prostate. Invest Urol. 1980;18:32– 5.
55. Tisell L-E, Fjelkegard B, Leissner KH. Zinc concentration and content of the dorsal, lateral and medial prostatic lobes and of periurethral adenomas in man. J Urol. 1982;128:403–5.
56. Marezynska A, Kulpa J, Lenko J. The concentration of zinc in relation to fundamental elements in the diseases human prostate. Int Urol Nephrol. 1983; 15(3):257–65.
57. Oldereid NB, Thomassen Y, Attramadal A, Olaisen B, Purvis K. Concentrations of lead, cadmium and zinc in the tissues of reproductive organs of men. J Reprod Fertil. 1993;99:421–5.
58. Kwiatek WM, Banas A, Banas K, Podgorczyk M, Dyduch G, Falkenberg G, et al. Distinguishing prostate cancer from hyperplasia. Acta Physica Polonica. 2006; 109(3):377–81.
59. Guntupalli JN, Padala S, Gummuluri AV, Muktineni RK, Byreddy SR, Sreerama L, et al. Trace elemental analysis of normal, benign, hypertrophic and cancerous tissues of the prostate gland using the particle-induced X-ray emission technique. Eur J Cancer Prev. 2007;16: 108–15.
60. Sarafanov AG, Todorov TI, Kajdacsy-Balla A, Gray MA, Macias V, Centeno JA. Analysis of iron, zinc, selenium and cadmium in paraffin-embedded prostate tissue specimens using inductively coupled plasma mass-spectrometry. Journal of Trace Elements in Medicine and Biology. 2008;22:305–14.
61. Sapota A, Daragó A, Taczalski J, Kilanowicz A. Disturbed homeostasis of zinc and other essential elements in the prostate gland dependent on the character of pathological lesions. Biometals. 2009; 22:1041–9.
62. Tohno S, Kobayashi M, Shimizu H, Tohno Y, Suwannahoy P, Azuma C, et al. Age-related changes of the concentrations of select elements in the prostates of Japanese. Biol Trace Elem Res. 2009;127: 211–27.
63. Zaichick S, Zaichick V. Method and portable facility for energy-dispersive X-ray fluorescent analysis of zinc content in needle-biopsy specimens of prostate. X-Ray Spectrom. 2010;39:83–9.
cancerous tissues of the human prostate gland investigated by neutron activation analysis. App. Radiat Isot. 2012;70:81–7. 65. Christudoss P, Selvakumar R, Fleming JJ,
GopalakrishnanG. Zinc status of patients with benign prostatic hyperplasia and prostate carcinoma. Indian J Urol. 2011;27(1):14–8.
66. Zaichick V, Nosenko S, Moskvina I. The effect of age on 12 chemical element contents in intact prostate of adult men investigated by inductively coupled plasma atomic emission spectrometry. Biol Trace Elem Res. 2012;147(1):49–58.
67. Zaichick V, Zaichick S. INAA application in the assessment of chemical element mass fractions in adult and geriatric prostate glands. Appl Radiat Isot. 2014;90:62-73. 68. Zaichick V, Zaichick S. Determination of
trace elements in adults and geriatric prostate combining neutron activation with inductively coupled plasma atomic emission spectrometry. Open Journal of Biochemistry. 2014;1(2):16-33.
69. Zaichick V, Zaichick S. Use of INAA and ICP-MS for the assessment of trace element mass fractions in adult and geriatric prostate. JRadioanal Nucl Chem. 2014;301(2):383-97.
70. Schrodt GR, Hall T, Whitmore WRJr. The concentration of zinc in diseased human prostate glands. Cancer (Philad). 1964; 17(12):1555–66.
71. Sangen H. The influence of the trace metals upon the aconitase activity in human prostate glands. Jap J Urol. 1967;58(11):1146–59.
72. Györkey F. Some aspects of cancer of the prostate gland. In: Busch H, editor. Methods in cancer research, Vol. 10. New York: Academic Press; 1973;279–386. 73. Wallace AM, Grant JK. Effect of zinc on
androgen metabolism in the human hyperplastic prostate. Biochem Soc Trans. 1975;3(4):540–2.
74. Maganto PE. Zinc levels in the normal and pathological prostate tissue. Actas Urol Esp. 1980;4(1):15–20.
75. Feustel A, Wennrich R, Steiniger D, Klauss P. Zinc and cadmium concentration in prostatic carcinoma of different histological grading in comparison to normal prostate tissue and adenofibromyomatosis (BPH). Urol Res. 1982;10:301–3.
76. Lahtonen R. Zinc and cadmium
concentrations in whole tissue and in separated epithelium and stroma from
human benign prostatic hypertrophic glands. Prostate. 1985;6(2):177–83. 77. Wennrich R, Feustel A. Determination of
cadmium and zinc in human prostatic tissues by flameless AAS. Z Med Lab Diagn. 1985;26(7):365–9.
78. Feustel A, Wennrich R, Dittrich H. Zinc, cadmium and selenium concentrations in separated epithelium and stroma from prostatic tissues of different histology. Urol Res. 1987;15(3):161–3.
79. Ogunlewe JO, Osegbe DN. Zinc and cadmium concentrations in indigenous blacks with normal, hypertrophic, and malignant prostate. Cancer. 1989;63(7): 1388–92.
80. Picurelli L, Olcina PV, Roig MD, Ferrer J. Determination of Fe, Mg, Cu, and Zn in normal and pathological prostatic tissue. Actas Urol Esp. 1991;15:344–50.
81. Borowiec D, Spruch T, Juszkiewicz M. The measurements of the selected trace element levels in the prostate. Urologia Polska. 1995;48:1–5. Polish
82. Zaichick V, Sviridova T, Zaichick S. Zinc in
human prostate gland: normal,
hyperplastic and cancerous. Int Urol Nephrol. 1997;29:565–74.
83. Vartsky D, Shilstein S, Bercovich A, Huszar M, Breskin A, Chechik R, et al. Prostatic zinc and prostate specific antigen: an experimental evaluation of their combined diagnostic value. J Urol. 2003; 170(6):2258–62.
84. Lopes RT, Lima I, Pereira GR, Perez CA.
Synchrotron radiation X-ray
microfluorescence techniques and biological applications. Pramana – J Phys. 2011;76(2):271–9.
85. Beck FW, Prasad AS, Butler CE, Sakr WA, Kucuk O, Sarkar FH. Differential expression of hZnT-4 in human prostate tissues. Prostate. 2004;58:374–81.
86. Franklin RB, Feng P, Milon B, Desouki M, Singh KK, Kajdacsy-Balla A, et al. hZIPI zinc uptake transporter down regulation and zinc depletion in prostate cancer. Mol Cancer. 2005;4:32–45.
87. Desouki MM, Geradts J, Milon B, Franklin RB, Costello LC. hZip2 and hZip3 zinc transporters are down regulated in human prostate adenocarcinomatous glands. Mol Cancer. 2007;6:37–44.
synchrotron radiation microbeams. X-Ray Spectrom. 2002;31:7–11.
89. Zaichick V, Sviridova T, Zaichick S. Zinc concentration in human prostatic fluid: normal, chronic prostatitis, adenoma, and cancer. Int Urol Nephrol. 1996;28:687–94. 90. Avtandilov GG. Morphometry in pathology.
Moscow: Medicina; 1973. Russian
91. Woodard HQ, White DR. The composition of body tissues. Br J Radiol. 1986;59: 1209–18.
92. Mawson CA, Fischer MJ. The occurrence of zinc in the human prostate gland. Can J Med Sci. 1952;30:336–9.
93. Shirakawa T. Clinical and experimental study on quantitative analysis of zinc in prostate. Acta Urol Japon. 1961;7(3):352– 62.
94. Ishigooka M, Hayami S, Suzuki Y, Hashimoto T, Sasagawa I, Nakada T.
Age-related changes of histological composition in established benign prostatic hyperplasia. Eur Urol. 1996;29:85–9.
95. Gonic P, Oberleas D, Knechtges T, Prasad AS. Atomic absorption determination of zinc in the prostate. Invest Urol. 1969;6:345–7.
96. Zaichick V. Sampling, sample storage and preparation of biomaterials for INAA in clinical medicine, occupational and environmental health. In: Harmonization of
Health-Related Environmental
Measurements Using Nuclear and Isotopic Techniques. Vienna: IAEA. 1997;123–33. 97. Zaichick V. Losses of chemical elements in
biological samples under the dry aching process. Trace Elements in Medicine. 2004;5(3):17–22. Russian.
© 2015 Zaichick and Zaichick; This is an Open Access article distributed under the terms of the Creative Commons Attribution License (http://creativecommons.org/licenses/by/4.0), which permits unrestricted use, distribution, and reproduction in any medium, provided the original work is properly cited.
Peer-review history:
The peer review history for this paper can be accessed here: