Clinical Ophthalmology
Dove
press
R e v i e w
open access to scientific and medical research
Open Access Full Text Article
Strategies for improving early detection of
glaucoma: the combined structure–function index
Andrew J Tatham Robert N weinreb Felipe A Medeiros
Hamilton Glaucoma Center, Department of Ophthalmology, University of California, La Jolla, CA, USA
Correspondence: Felipe A Medeiros Hamilton Glaucoma Center, University of California, San Diego, 9500 Gilman Drive, La Jolla, CA 92093-0946, USA Tel +1 858 822 4592 Fax +1 858 822 0615
email [email protected]
Abstract: The early detection of glaucoma is important in order to enable appropriate monitoring and treatment, and to minimize the risk of irreversible visual field loss. Although advances in ocular imaging offer the potential for earlier diagnosis, the best method is likely to involve a combination of information from structural and functional tests. Recent studies have shown it is possible to estimate the number of retinal ganglion cells from optical coherence tomography and standard automated perimetry, and to then pool the results to produce a combined structure– function index (CSFI). The CSFI represents the estimated percentage of retinal ganglion cells lost compared to an age-matched healthy eye. Previous studies have suggested that the CSFI is better able to detect glaucoma than isolated measures of structure and function, and that it performs well even in preperimetric glaucoma. The purpose of this review is to describe new strategies, such as the CSFI, that have the potential to improve the early detection of glaucoma. We also describe how our ability to detect early glaucoma may be further enhanced by incor-porating demographic risk factors, clinical examination findings, and imaging and functional test results into intuitive models that provide estimates of disease probability.
Keywords: glaucoma, optical coherence tomography, OCT, perimetry, spectral domain, retinal
ganglion cells
Introduction
Glaucoma is a leading cause of vision-related morbidity worldwide.1–3 It is estimated
that over 58 million people will have open-angle glaucoma by the year 2020, with 10% bilaterally blind.4 Although blindness is the most feared outcome, there is
grow-ing evidence that even mild visual field loss may have an adverse effect on quality of life.5 Furthermore, greater than 10% of patients with glaucoma diagnosed with early
visual field damage and followed up and treated will still develop significant visual impairment or blindness during their lifetime.6 As the damage from glaucoma is
irre-versible, it is important that the disease is detected at an early stage, before significant field loss has developed, so that the risk of visual impairment and related morbidity can be minimized.
The diagnosis of glaucoma depends on recognition of characteristic structural changes to the optic nerve head (ONH) and retinal nerve-fiber layer (RNFL). Psychophysical tests, the gold standard of which is standard automated perimetry (SAP), should also be used to detect abnormalities of visual function indicative of glaucoma. The Ocular Hypertension Treatment Study,7 European Glaucoma
Prevention Study,8 and other studies9–11 have demonstrated that there may be
dis-agreement between structural and functional tests. Although a substantial proportion
Clinical Ophthalmology downloaded from https://www.dovepress.com/ by 118.70.13.36 on 21-Aug-2020
For personal use only.
Number of times this article has been viewed
This article was published in the following Dove Press journal: Clinical Ophthalmology
Dovepress
Tatham et al
of patients who develop glaucoma acquire structural before detectable functional changes, both structural and functional assessments are necessary, as in some patients functional abnormalities are detected before structural.7,8
The demographic and clinical characteristics associated with glaucoma are well known, and in cases of moderate-to-advanced glaucoma, the diagnosis is usually straight-forward. A major challenge, however, is how best to detect early glaucoma.
Over the last 25 years, ancillary tests have been intro-duced that can supplement the clinical examination and aid the clinician in determining the probability of disease. For example, such methods as optical coherence tomography (OCT), scanning laser polarimetry, and confocal scanning laser ophthalmoscopy (CSLO) can be used to provide objec-tive and quantitaobjec-tive measurements of such parameters as RNFL thickness or neuroretinal rim area. Imaging devices also often include normative databases that allow eyes to be categorized as normal, borderline, or outside normal limits. Although imaging devices have shown good ability to distinguish between glaucomatous and healthy eyes,12–21
few studies have specifically examined their application in early disease.22,23 Categorization of disease probability
by imaging devices also has limitations, and does not take account of information from visual function tests, which may substantially alter the likelihood of glaucoma.
The purpose of this review is to describe new strategies, such as a combined index of structure and function, which have the potential to improve the early detection and diag-nosis of glaucoma.
Detection of glaucoma
using functional tests
Standard automated perimetry
The assessment of visual function is an essential component of glaucoma diagnosis and monitoring, with the current gold-standard SAP. Glaucoma may first be detected due to a visual field abnormality; however, many patients have sig-nificant structural changes before detectable changes in SAP. Furthermore, histological studies in humans and primates have indicated that large numbers of retinal ganglion cells (RGCs) may be lost before statistically significant abnor-malities are apparent on SAP.24–27 For example, in a study of
cadaver eyes, Kerrigan-Baumrind et al estimated that at least 23%–35% of RGCs would need to be lost for a statistically significant abnormality on SAP.24 These studies suggest that
reliance on SAP in early glaucoma is likely to lead to under-estimation of the amount of glaucomatous damage.
The histological studies have limitations,28 particularly as
they include relatively small numbers of eyes; however, the finding that in some eyes significant RGC losses may occur before detectable SAP defects is consistent with what one would expect, given that SAP data are acquired and presented using a logarithmic decibel scale.28–31 Several investigators
have shown that it is important to take into account the logarithmic units of measurement of SAP and linear units of measurement of structural tests when comparing the rela-tionship between structural and functional measurements in glaucoma.26,29,32,33 The logarithmic scale compresses the range
of losses in the early stages of disease while expanding the range in later stages (Figure 1).
Most diagnostic tests perform less well in early compared to advanced disease; however, the logarithmic scale of SAP accentuates this problem.34,35 Due to the logarithmic scale,
significant neural losses are likely to correspond to relatively small changes in SAP sensitivity at early stages of disease compared to relatively large changes in later disease.31
Furthermore, because SAP data are also acquired using staircase procedures based on a logarithmic scale, even when SAP sensitivities are transformed to a linear scale, current SAP strategies are unlikely to perform well in early disease. Medeiros et al found disease severity had a significant effect on the diagnostic ability of SAP pattern standard deviation (PSD), which for a specificity of 80%, had a sensitivity of 85% in eyes with 70% loss of neuroretinal rim area compared to a sensitivity of only 40% in eyes with 10% loss of neu-roretinal rim area.34 Therefore, if SAP PSD was used alone
to detect early glaucoma (eg, eyes with 10% neuroretinal rim loss), we would expect only 40% of glaucomatous subjects to be correctly identified and a relatively large number of false positives (20%).
0
0 500,000
Estimated number of RGCs
SAP mean deviation (dB)
1,000,000 1,500,000
−10
−20
−30
Figure 1 Scatter plot showing the relationship between standard automated perimetry
(SAP) mean deviation and estimated number of retinal ganglion cells (RGCs).
Clinical Ophthalmology downloaded from https://www.dovepress.com/ by 118.70.13.36 on 21-Aug-2020
Dovepress early detection of glaucoma
Other perimetric devices
Other functional tests have been developed with the aim of detecting glaucomatous visual field changes at an earlier stage.36,37 For example, frequency-doubling technology
(FDT), short-wavelength automated perimetry (SWAP), and flicker-defined form (FDF) perimetry are tests that aim to target specific aspects of visual function, such as move-ment perception, contrast sensitivity, and color vision.38–42
Although it is unlikely any stimulus can be 100% specific for a single visual pathway or a single subset of RGCs, it is possible that stimuli minimize potential input from other pathways. Selective stimuli could be useful for detecting an early deficit affecting a small proportion of cells, because even if other cell types are still functioning in a given retinal area, they are unable to detect that specific stimulus.
FDT perimetry, FDF perimetry, and SWAP have been described in detail elsewhere.38,42,43 In brief, FDT perimetry
determines the minimum contrast needed to detect a rapidly reversing contrast grating stimulus. The frequency-doubling illusion phenomenon was thought to be mediated by a subset of magnocellular RGCs;38 however, recent research
has suggested the response is cortical.44 FDF perimetry, eg,
the Heidelberg edge perimeter, employs a phase reversal of black and white dots to create a high-temporal-frequency flicker stimulus, which is also thought to preferentially tar-get the magnocellular pathway.42 SWAP uses a narrow-band
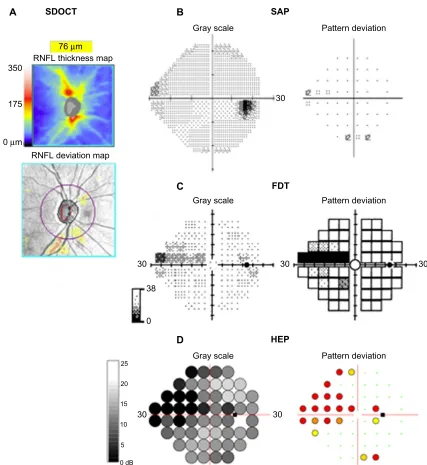
blue-light stimulus and yellow-background illumination to emphasize the response characteristics of the blue–yellow pathway.43 Figure 2 shows the results of SAP, FDT, and FDF
perimetry for a subject with glaucoma.
Studies comparing the diagnostic ability of different perimetric tests have reported variable results.34,35,41,45 Tafreshi
et al compared SAP, matrix FDT perimetry and Swedish inter-active thresholding algorithm SWAP but found no significant difference in their diagnostic performance.45 In contrast, Liu
et al found SAP and matrix FDT perimetry to be superior, with sensitivities of 82%, 57%, and 84% for SAP, SWAP, and matrix FDT perimetry mean deviation (MD), respec-tively for a specificity of 90%.35 Medeiros et al examined
the effect of disease severity on the diagnostic performance of matrix FDT perimetry and SAP and found FDT may have better accuracy in early disease.34 Areas under the receiver
operating-characteristic curves (AUCs) were significantly larger for FDT than SAP in early disease with AUCs of 0.766 and 0.638 for FDT and SAP respectively in eyes with 10% neuroretinal rim area loss.34 The performance of both tests
improved with increasing disease severity, with no significant difference between tests in eyes with greater than 30% loss
of neuroretinal rim area. Although in this study, matrix FDT performed better than SAP in early disease, even FDT had a sensitivity of only 58% for 80% specificity, meaning many cases of early glaucoma would likely be missed if FDT was used alone.
Novel perimetric tests may improve our ability to detect early glaucoma; however, at present there is not strong evi-dence to support the widespread use of these devices in place of SAP. A recent study comparing FDF perimetry to matrix FDT and SAP reported it to be a more sensitive test with stronger correlation with structural measurements; however, FDF perimetry is a relatively new technology, and further investigation is required.46–48
Detection of glaucoma
using structural tests
Although functional changes may be detected before struc-tural changes, in many cases the earliest detectable manifes-tation of glaucoma is a structural abnormality of the ONH and RNFL.7,8 Structural changes are traditionally assessed
by clinical examination and optic disc stereophotographs.9
However, diagnostic difficulties may occur, due to the large variations in normal disc appearance. Furthermore, although optic disc stereophotographs are useful, their interpretation is subjective, and the interobserver agreement in assessing progressive changes is only slight to fair.49 Such imaging
devices as scanning laser polarimetry, CSLO, and OCT provide an objective means to quantify structural character-istics of the ONH and RNFL, and thereby potentially offer an opportunity to detect glaucoma at an earlier stage.50–52
RNFL thickness and ONH measurements can also be com-pared to normative databases to determine the probability of disease (Figure 3) and estimate the risk of future visual loss.12,14,53–55
Baseline measurements
Many studies have shown cross-sectional measurements from imaging devices to perform well at discriminating healthy individuals from those with glaucoma.12–21,56 Deleón-Ortega
et al found that average RNFL thickness measured using time-domain OCT (TDOCT) had a 70% sensitivity for 80% speci-ficity compared to sensitivities of 76% and 68% for the best individual Heidelberg retina tomograph II (Heidelberg Engi-neering, Heidelberg, Germany) and scanning laser polarimetry with variable corneal compensation parameters, respectively.56
The introduction of spectral domain OCT (SDOCT) has poten-tially improved our ability to detect early disease. Compared to TDOCT, SDOCT provides reduced scan-acquisition times,
Clinical Ophthalmology downloaded from https://www.dovepress.com/ by 118.70.13.36 on 21-Aug-2020
Dovepress
Tatham et al
greatly enhanced resolution, and improved layer segmenta-tion. Leung et al found RNFL measurements obtained using SDOCT had excellent ability to detect glaucoma, with global RNFL thickness having a sensitivity of 91.6% for a specificity of 87.6%, and an AUC of 0.962.21
Although imaging devices have good ability to detect glaucoma, diagnostic performance is less in early disease. Leite et al recently reported that for a specificity of 85%, average RNFL thickness measured using OCT had an esti-mated sensitivity of approximately 82% in eyes with early disease (defined as SAP visual field index of 90%), which
was significantly less than a sensitivity of 93% in those with advanced disease (defined as SAP visual field index of 70%).22 If visual field loss is present, one might argue that
the diagnosis of glaucoma is straightforward.
Recently Lisboa et al evaluated the ability of SDOCT to detect preperimetric glaucoma.23 The study examined
134 eyes of 88 subjects suspected of having glaucoma due to optic disc appearance. The suspicion of glaucoma was based on the presence of neuroretinal rim thinning, excavation, or suspicious RNFL defects on stereophotographs evaluated by at least two independent masked graders. Eyes were
A SDOCT B
Gray scale Pattern deviation
Pattern deviation
Pattern deviation Gray scale
Gray scale 38
30 30 30
30
30
25
20
15
10
5
0 dB
30 0
0 µm
76 µm
175
350 RNFL thickness map
RNFL deviation map
SAP
C FDT
D HEP
Figure 2 (A–D) Perimetric test results using three devices for the right eye of a subject with glaucoma. Spectral domain optical coherence tomography (SDOCT) shows
inferior retinal nerve fiber layer thinning (A). Standard automated perimetry (SAP) shows a possible early superonasal defect (B), which is confirmed on frequency-doubling
technology (FDT) perimetry (C) and with the flicker-defined form Heidelberg edge perimeter (HEP) (D).
Abbreviation: RNFL,retinal nerve-fiber layer.
Clinical Ophthalmology downloaded from https://www.dovepress.com/ by 118.70.13.36 on 21-Aug-2020
Dovepress early detection of glaucoma
deemed to have developed preperimetric glaucoma if there was documented evidence of progression on subsequent optic disc stereophotographs but no repeatable visual field defect during at least 5 years of follow-up. RNFL thickness measure-ments were obtained using Spectralis® SDOCT (Heidelberg
Engineering). The study found that SDOCT was able to discriminate eyes with preperimetric glaucoma from those with suspected glaucoma, with an AUC of 0.86 for global RNFL thickness. Subjects were also tested using CSLO; however, the best-performing CSLO parameter – global rim area – had an AUC of only 0.72, which was significantly less than SDOCT RNFL thickness.23 These results indicate
that SDOCT is a useful tool for the detection of early glau-coma; however, disease severity is still an important factor influencing the performance of the test. Furthermore, some eyes may still develop perimetric defects before structural changes are apparent, and therefore structural and functional testing remains important.
Longitudinal measurements
The studies discussed thus far evaluated the ability of base-line or cross-sectional measurements to detect glaucoma.
However, due to the wide variability of optic nerve appear-ance, a single cross-sectional structural observation may not be diagnostic in the early stages of disease.57 In clinical
practice, early diagnosis of glaucoma may depend on repeat-ing examinations over time and observrepeat-ing for change. This is particularly important as there is growing evidence that progressive structural change is a better prognostic marker than isolated baseline measures, with better correlation with functional outcomes.9,58 For example, in patients with
suspected glaucoma, baseline optic disc appearance on stereophotographs has been shown to be predictive of the development of a future visual field defect.9 However, the
relationship between the development of visual field defects and baseline appearance was weak compared to change in the nerve over time.9 Patients with progressive optic disc changes
were found to be almost 26 times more likely to develop a visual field defect compared to those in whom no change in disk appearance was detected.
Longitudinal changes in neuroretinal rim area, measured using CSLO, are also predictive of future development of visual field loss in those with suspected glaucoma.54,58
Medeiros et al performed repeated CSLO examinations
GHT: within normal limits GHT: within normal limits GHT: within normal limits GHT: within normal limits GHT: within normal limits
Estimated RGC count =705,082 cells
CSFI =29%
350
175
0 µm
76 µm RNFL thickness map Date:
Age: 5410-10-2002 Date:Age: 5911-20-2006 Date:Age: 614-27-2009 Date:Age: 642-1-2012 Date:Age: 651-16-2013
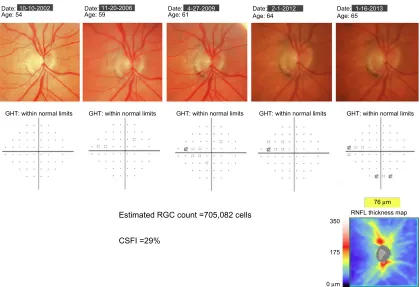
Figure 3 example of a patient with progressive glaucomatous changes on optic disc photographs. Throughout follow-up, standard automated perimetry indices, including the
glaucoma hemifield test (GHT) and mean deviation, remained within normal limits. At the most recent visit, spectral domain optical coherence tomography showed evidence of inferior retinal nerve fiber-layer loss. The estimated retinal ganglion cell (RGC) count at the most recent follow-up was 705,082 cells, and the combined structure–function
index (CSFi) was 29%, indicating the eye had lost 29% of RGCs compared to that expected in a healthy age-matched eye.
Abbreviation: RNFL, retinal nerve-fiber layer.
Clinical Ophthalmology downloaded from https://www.dovepress.com/ by 118.70.13.36 on 21-Aug-2020
Dovepress
Tatham et al
on glaucoma suspects for an average of over 6 years.58 The
mean rate of rim-area change in eyes that developed visual field loss was almost four times greater than in those that did not. Each 0.01 mm2/year faster rate of rim-area loss was
associated with an almost threefold-higher risk of developing visual field loss. The analysis also took account of potentially confounding variables, such as intraocular pressure and corneal thickness.
Although SDOCT is a relatively new technology, studies are emerging showing that SDOCT RNFL loss over time can also be used to predict the risk of future development of visual field loss in eyes with suspected glaucoma.59 For example,
Miki et al followed subjects with suspected glaucoma and normal visual fields at baseline for a median of just over 2 years.59 Eyes that developed confirmed visual field damage
during follow-up were found to have had significantly faster rates of decline in average SDOCT RNFL thickness, with a rate of RNFL loss in some sectors three times faster in those that developed visual field defects than in those that did not.
This and other studies11 demonstrate that in cases of
diagnostic uncertainty, detecting and measuring rates of structural change can help confirm an early diagnosis of glaucoma. Moreover, in those with suspected glaucoma, rates of structural change can help predict eyes at high risk of visual loss. There is therefore growing evidence that imaging devices are able to provide additional information to clinical examination and visual field testing. However, it is likely that a combination of structural and functional measures may provide better diagnostic ability than any isolated test. At present, clinicians already use a combined structure– function approach as they intuitively combine information from structural and functional tests to decide the likelihood of disease. However, the current approach is problematic, as it is subjective and made difficult by the different measure-ment scales of SAP and imaging devices. Recently, new strategies to combine data from structure and function have been described that may provide more consistent methods for better detection of early glaucoma.
Estimating the number
of retinal ganglion cells
The underlying pathological feature of glaucomatous optic neuropathy is loss of RGCs1; therefore, were it possible
to directly measure RGC loss, this might offer the best method to detect early glaucomatous damage.60 Although
direct quantification of RGCs is not yet possible in vivo, Harwerth et al have described empirical formulas that allow RGC counts to be estimated from perimetric
threshold-sensitivity values.60 The formulas were derived from
stud-ies of laser-induced experimental glaucoma in nonhuman primates. The authors first developed an empirical model relating SAP sensitivity measurements to histological RGC counts as a function of retinal eccentricities, and the experimental results were then translated to clinical perim-etry in humans.60 In a series of accompanying experiments,
formulas were also developed that allowed estimation of the number of RGC axons from OCT RNFL thickness measure-ments.60 The structural model took into account the effect
of age on axonal density and the effect of disease severity on the relationship between the neuronal and nonneuronal components of the RNFL.
The ability to estimate RGC counts from OCT and SAP for the first time provides a common and intuitive measure for expressing the results of structural and functional tests. This has the potential to improve our understanding of the rela-tionship between structural and functional tests in glaucoma, with important implications for early detection of disease. For example, Figure 1 shows the nonlinear relationship between SAP MD and estimated RGC counts in healthy and glaucomatous eyes from the Diagnostic Innovations Study at the University of California, San Diego.31 The estimates
of RGC count confirm that the same amount of RGC loss can correspond to largely different amounts of MD change depending on the stage of the disease. As previously dis-cussed, due to the logarithmic decibel scale, in early disease, large reductions in RGC count could occur with relatively small change in MD.
Medeiros et al recently examined the relationship between estimated numbers of RGCs and first appearance of SAP defects.61 RGC counts were estimated at the
earli-est time of visual field defect in 53 eyes of 53 subjects with suspected glaucoma who developed visual field loss during follow-up.61 Although there was large variation in the
esti-mated number of RGCs, on average, eyes with early visual field defects had an estimated RGC count of 652,057 cells versus 910,584 cells in similarly aged healthy eyes. This represented an estimated average RGC loss of 28.4% associ-ated with early visual field defects, which was remarkably similar to that found in histologic studies of human eyes.24
These findings help to explain why progressive optic disc or RNFL changes can frequently be seen before the appear-ance of statistically significant defects on SAP.7,31 They also
provide further evidence of the importance of early detection of glaucoma, for if the presence of glaucoma is not realized until a late stage, only a relatively small amount of further damage is likely to be required for the patient to develop disability from the disease.
Clinical Ophthalmology downloaded from https://www.dovepress.com/ by 118.70.13.36 on 21-Aug-2020
Dovepress early detection of glaucoma
The ability to estimate RGC counts from OCT and SAP opens the possibility of combining information from structural and functional tests to improve the reliability and accuracy of estimated neural losses in glaucoma.30 To this end,
Medeiros et al have recently reported a method of combining RGC estimates from OCT and SAP, with a weighting that takes into consideration differences in performance of SAP and imaging tests at different stages of the disease.30,31 The
weighted RGC estimate has been used to develop a combined structure–function index (CSFI).62
The combined structure–
function index
The combined structure–function index (CSFI) is an estimate of the percentage of RGCs lost compared to that expected for an age-matched healthy eye.62 Therefore, an eye with a CSFI
of 100% has an estimated RGC count equal to that expected for age, whereas an eye with a CSFI of 50% has an estimated RGC count half that expected for age.62 The purpose of the
CSFI is to merge the results of structural and functional tests into a single index that can be used for diagnosing and staging glaucoma and detecting disease progression. An example of use of the CSFI is illustrated in Figure 3, which shows a subject with progressive glaucomatous structural change evident on optic disc photographs. Despite structural changes, SAP global indices remained within normal limits. SDOCT performed at the most recent visit confirmed the presence of RNFL layer loss, with an average RNFL thick-ness of 53 µm. At the most recent visit the estimated number of RGCs for this eye was 705,082 cells and the CSFI was 29%, indicating the eye had lost 29% of RGCs compared to that expected in a healthy age-matched eye. Therefore, although this patient had normal visual fields, the CSFI indicated significant loss of RGCs consistent with OCT and examination findings. As the CSFI also includes informa-tion from funcinforma-tional testing, if the patient had developed an abnormality on SAP prior to RNFL loss being detected, the CSFI would also have indicated a reduction in estimated RGCs compared to that expected.
The CSFI has shown promise as a tool for glaucoma diagnosis. In a study of 333 glaucomatous and 165 healthy eyes, the CSFI had an AUC of 0.94 to discrimi-nate glaucomatous from normal eyes.62 This was superior
to SDOCT RNFL thickness (AUC =0.92, P=0.008), SAP MD (AUC =0.88, P,0.001), and SAP visual field index (AUC =0.89, P,0.001). The glaucomatous group in this analysis included 38 eyes with preperimetric glaucoma based on documented evidence of progressive optic disc change in stereophotographs. The CSFI had good ability to distinguish
healthy eyes from those with preperimetric glaucoma, with an AUC of 0.85. This was superior to SAP visual field index (AUC =0.51, P,0.001) and SAP MD (AUC =0.63, P,0.001) and similar to SDOCT RNFL thickness (AUC =0.88, P=0.32) (Figure 4).62 Eyes with preperimetric glaucoma were found to
have an average RGC loss of 17% compared to age-expected numbers versus average losses of 52% and 75% in eyes with moderate (average MD −8.2 dB) and advanced (average MD −17.4 dB) perimetric damage respectively.62 Although
the ability of the CSFI to detect preperimetric glaucoma was similar to SDOCT RNFL thickness, as some patients develop SAP abnormalities before structural changes are detected, the CSFI has advantages over isolated OCT measurements, even in early disease. Indeed, an advantage of the CSFI is that it utilizes the strengths of both structural and functional tests to provide a reliable method for detecting change throughout the spectrum of the disease. The CSFI was a useful index for diagnosis and staging disease severity and was better than isolated structural or functional measures.
The baseline CSFI is useful for detecting disease; how-ever, just as longitudinal changes in structural and functional measures provide diagnostic and prognostic information, the ability to estimate longitudinal changes in RGC counts is also of value. In subjects suspected of having glaucoma, the CSFI has recently been shown to be predictive of future development of glaucoma and visual field loss.63
Meira-Freitas et al examined baseline and longitudinal CSFI values in 288 eyes of 288 subjects suspected of having glaucoma but with normal SAP.63 Over a mean follow-up of approximately
100
75
50
25
0
0 25 50 75 100
CSFI VFI Average RNFL
thickness Reference
Sensitivity,
%
1-specificity, %
Figure 4 Receiver operating-characteristic curve for discriminating preperimetric
glaucomatous eyes from healthy eyes for standard automated perimetry visual field
index (vFi) (area under the curve [AUC] =0.51), optical coherence tomography
average retinal nerve-fiber layer (RNFL) thickness (AUC =0.88) and the combined structure–function index (CSFi; AUC =0.85).
Note: Reprinted from Medeiros FA, Lisboa R, Weinreb RN, Girkin CA,
Liebmann JM, Zangwill LM. A combined index of structure and function for staging glaucomatous damage. Arch Ophthalmol. 2012;130:1107–1116.62 Copyright © 2012
American Medical Association. All rights reserved.
Clinical Ophthalmology downloaded from https://www.dovepress.com/ by 118.70.13.36 on 21-Aug-2020
Dovepress
Tatham et al
4 years, 48 eyes were deemed to have developed glaucoma due to repeatable abnormal visual fields or progressive glaucomatous optic disc changes on masked assessment of stereophotographs. Eyes with lower estimated number of RGCs at baseline, and those with faster rates of change in RGC counts over time, were found to be at greater risk of developing glaucoma.63 The mean (± standard deviation)
estimated RGC count at baseline was 848,827±167,928 cells for those that developed glaucoma versus 1,026,569±158,081 cells for those that did not (P,0.001). Corresponding numbers for CSFI were 17.1% ±13.2% and 2.3% ±13.3%, respectively (P,0.001). The mean rate of change in esti-mated RGC counts was −18,987 cells/year in those that developed glaucoma versus −8,808 cells/year for those that did not (P,0.001). The CSFI had a better predictive ability than conventional measures of RNFL thickness, SAP MD, or SAP PSD.
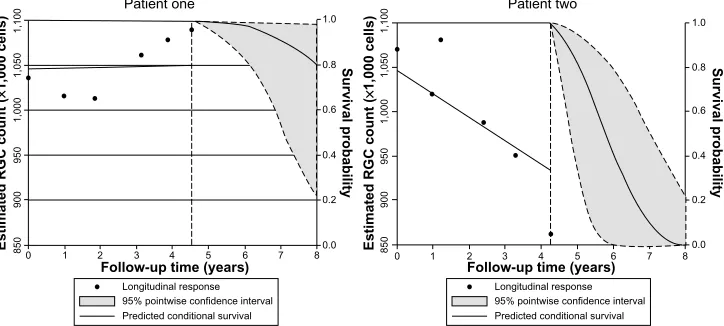
In addition, the authors presented a risk model for the development of glaucoma that can be updated, as informa-tion on predictive factors is made continuously available over time, ie, a longitudinal risk calculator.63 Figure 5 shows the
predicted survival probabilities of two eyes with suspected glaucoma, one with a relatively fast rate of decline in estimated RGC counts, and another with relatively stable measurements over time. It is apparent that the eye with the faster rate of decline has a much lower predicted probability of survival, ie, a higher probability of developing confirmed glaucoma. Such a model provides a means to assess the risk of glaucoma in those suspected of having the disease, and has the potential to allow monitoring intervals to be tailored to individual risk, leading to earlier diagnosis and treatment.
Although risk calculators have been previously described for ocular hypertension,64 a major advantage of a longitudinal
risk calculator is that the probability of survival can be adjusted as information becomes available at subsequent examinations. Such an approach offers significant advantages over currently available risk calculators, which are designed to estimate the risk of glaucoma development using only baseline information. For example, the predicted survival probability may be relatively high when only baseline mea-surements are considered. However, as more information becomes available, it may become apparent that there is a decline in estimated numbers of RGCs, resulting in the model lowering the probability of survival. Therefore, the CSFI result can be used to determine the probability of a patient developing glaucoma, and this probability can be modified as further information is obtained.
Estimating the likelihood of disease
The fundamental question of the glaucoma diagnostic process is: What is the probability of disease? The clinician typically formulates an intuitive estimate of disease probability based on medical history and clinical examination findings. This can be referred to as the pretest probability. For example, in a patient with high intraocular pressure, a first-degree rela-tive with glaucoma, and a suspicious optic disc appearance, there is likely to be a high pretest probability of disease. The results of imaging and functional tests can then be used to modify the pretest probability and obtain a new posttest probability of disease.55
At present, many imaging devices perform categorization of test results as normal, borderline, or outside normal limits;
1,050
1,000
950
900
850
1,100
1,050
1,000
950
900
850
1,100
1 2 3 4 5 6 7 8 0
0.8
0.6
0.4
0.2
0.0 1.0
0.8
0.6
0.4
0.2
0.0 1.0
Follow-up time (years)
Longitudinal response 95% pointwise confidence interval Predicted conditional survival
Estimated RGC count
(
×
1,000 cells)
Estimated RGC count
(
×
1,000 cells)
1 2 3 4 5 6 7 8 0
Follow-up time (years)
Longitudinal response 95% pointwise confidence interval Predicted conditional survival
Survival probability Survival probability Patient one Patient two
Figure 5 Example of use of the longitudinal risk calculator in two eyes with suspected glaucoma, as described by Meira-Freitas et al.63 The dashed vertical line represents the
time point of last examination, with points to the left of the dashed line indicating estimated retinal ganglion cell (RGC) counts at each visit. The predicted survival probabilities are shown to the right of the dashed vertical line. Patient one has relatively stable measurements over time and a high probability of survival, ie, not developing glaucoma, of 0.8 at 8 years. Patient two has a relatively fast rate of decline in estimated RGCs and a high probability of glaucoma.
Note: Reprinted from Meira-Freitas D, Lisboa R, Tatham A, et al. Predicting progression in glaucoma suspects with longitudinal estimates of retinal ganglion cell counts. Invest
Ophthalmol Vis Sci. 2013;54:4174–4183.63 Copyright © 2013 The Association for Research in vision and Ophthalmology, inc.
Clinical Ophthalmology downloaded from https://www.dovepress.com/ by 118.70.13.36 on 21-Aug-2020
Dovepress early detection of glaucoma
however, these classifications do not take account of pretest disease probability. Future software may allow incorporation of risk factors and clinical examination findings into these calculations. Including information regarding risk factors, such as intraocular pressure, central corneal thickness, and the presence or absence of disc hemorrhages, is likely to improve diagnostic accuracy and may allow early disease detection.65 It is also important to incorporate functional
measures, such as made possible using estimates of RGC numbers. Categorization of eyes as diseased or healthy may also be problematic as two eyes with similar measurements could fall either side of an arbitrary cutoff when in fact they have similar probability of disease. It has been proposed that the best way of incorporating the results of diagnostic tests into clinical decision making is through calculation of likelihood ratios.66 Likelihood ratios can be used to determine
whether a test result significantly changes the probability of disease, with larger likelihood ratios leading to a greater increase in the likelihood of disease.
Estimates of RGC loss calculated from SAP and OCT could be used to calculate the likelihood of disease and modify pretest suspicions, with the potential to lead to earlier diagnosis and identification of those at high risk, while avoiding the problems of arbitrary cutoffs between health and disease. Two recent studies have described the use of continuous likelihood ratios for glaucoma diagnosis, as calculated from RNFL thickness and estimates of RGC count.55,67 Thinner RNFL and low CSFI, which reflects greater
RGC loss, were both associated with a higher likelihood of glaucoma, with greater estimated RGC losses leading to larger increases in posttest probability of disease. Further studies are needed to explore the impact of likelihood ratios on decision making in glaucoma; however, they have the potential to aid early diagnosis.
Potential limitations of the CSFI
The CSFI has the potential to improve our ability to detect glaucoma at an early stage; however, some limitations are worth noting. The estimates of RGC count used in the CSFI are derived from experimental work in monkeys.60 Although
estimates obtained from these formulas have been validated in multiple external cohorts, including human data, no stud-ies have compared actual CSFI estimates with histological estimates of human glaucomatous eyes. However, there is also little-to-no histological validation of OCT measurements such as RNFL thickness, and it can be argued that this carries little significance as long as one shows that these measure-ments have clinical relevance.
Another potential limitation of the CSFI is that the original formula for estimating RGCs from OCT data was based on an older version of OCT technology – TDOCT. It is possible that modifications might be necessary when using estimates based on SDOCT technology. It is also possible that the presence of media opacities could affect SAP-derived estimates of RGCs and therefore calculations of the CSFI; however, this is a limitation of most visual field-based staging systems. In fact, by combining func-tional and structural measurements, the CSFI may reduce the effect of media opacities by relatively decreasing the influence of SAP-derived data on the final estimates of neuronal losses.
Other approaches have been suggested to combine struc-tural and functional tests to detect glaucoma and glaucoma progression, including the use of Bayesian methodologies to allow combinations of different tests.68,69 These approaches
are effective in combining results of different tests, and have the advantage of being capable of incorporating other information, such as demographic and clinical risk factors, to increase the accuracy and precision. However, Bayesian analyses have the disadvantage of not being intuitive for the majority of clinicians.
Conclusion
In conclusion, there is growing evidence that early detection of glaucoma is important, particularly as quality of life may be adversely affected with even mild loss of the visual field. Both structural and functional tests are necessary for early diagnosis, and recent technological advances have enhanced our ability to assess both domains. A major challenge is how best to integrate information from structural and functional tests. The CSFI offers a possible solution to this problem, and there is emerging evidence that the CSFI is better able to detect glaucoma than isolated measures of structure and function. Our ability to detect early glaucoma may be fur-ther enhanced by incorporating demographic risk factors and clinical examination findings into models that provide estimates of disease probability. In the future, it is likely that longitudinal risk-assessment tools will be an integral part of glaucoma management.
Disclosure
Drs Weinreb and Medeiros receive research support from Carl Zeiss Meditec; Drs Tatham, Weinreb, and Medeiros receive research support from Heidelberg Engineering; Dr Weinreb receives resource support from Optovue, Kowa, Nidek, and Topcon; and Drs Weinreb and Medeiros are consultants to
Clinical Ophthalmology downloaded from https://www.dovepress.com/ by 118.70.13.36 on 21-Aug-2020
Dovepress
Tatham et al
Carl Zeiss Meditec. Dr Weinreb is a consultant to Topcon. The authors have no other conflicts of interest in this work.
References
1. Weinreb RN, Khaw PT. Primary open-angle glaucoma. Lancet. 2004;363:1711–1720.
2. Spaeth G, Walt J, Keener J. Evaluation of quality of life for patients with glaucoma. Am J Ophthalmol. 2006;141:3–14.
3. Resnikoff S, Pascolini D, Etya’ale D, et al. Global data on visual impair-ment in the year 2002. Bull World Health Organ. 2004;82:844–851. 4. Quigley HA, Broman AT. The number of people with glaucoma
world-wide in 2010 and 2020. Br J Ophthalmol. 2006;90:262–267. 5. McKean-Cowdin R, Varma R, Wu J, Hays RD, Azen SP. Severity of
visual field loss and health-related quality of life. Am J Ophthalmol. 2007;143:1013–1023.
6. Rein DB, Wittenborn JS, Lee PP, et al. The cost-effectiveness of routine office-based identification and subsequent medical treatment of primary open-angle glaucoma in the United States. Ophthalmology. 2009;116:823–832.
7. Kass MA, Heuer DK, Higginbotham EJ, et al. The Ocular Hyperten-sion Treatment Study: a randomized trial determines that topical ocular hypotensive medication delays or prevents the onset of primary open-angle glaucoma. Arch Ophthalmol. 2002;120:701–713.
8. Miglior S, Zeyen T, Pfeiffer N, Cunha-Vaz J, Torri V, Adamsons I. Results of the European Glaucoma Prevention Study. Ophthalmology. 2005;112:366–375.
9. Medeiros FA, Alencar LM, Zangwill LM, Bowd C, Sample PA, Weinreb RN. Prediction of functional loss in glaucoma from progressive optic disc damage. Arch Ophthalmol. 2009;127:1250–1256.
10. Strouthidis NG, Scott A, Peter NM, Garway-Heath DF. Optic disc and visual field progression in ocular hypertensive subjects: detection rates, specificity, and agreement. Invest Ophthalmol Vis Sci. 2006;47: 2904–2910.
11. Artes PH, Chauhan BC. Longitudinal changes in the visual field and optic disc in glaucoma. Prog Retin Eye Res. 2005;24:333–354. 12. Zangwill LM, Bowd C, Berry CC, et al. Discriminating between
nor-mal and glaucomatous eyes using the Heidelberg retina tomograph, GDx nerve fiber analyzer, and optical coherence tomograph. Arch Ophthalmol. 2001;119:985–993.
13. Greaney MJ, Hoffman DC, Garway-Heath DF, Nakla M, Coleman AL, Caprioli J. Comparison of optic nerve imaging methods to distinguish normal eyes from those with glaucoma. Invest Ophthalmol Vis Sci. 2002;43:140–145.
14. Medeiros FA, Zangwill LM, Bowd C, Weinreb RN. Comparison of the GDx VCC scanning laser polarimeter, HRT II confocal scanning laser ophthalmoscope, and stratus OCT optical coherence tomograph for the detection of glaucoma. Arch Ophthalmol. 2004;122:827–837. 15. Naithani P, Sihota R, Sony P, et al. Evaluation of optical coherence
tomography and Heidelberg retinal tomography parameters in detect-ing early and moderate glaucoma. Invest Ophthalmol Vis Sci. 2007;48: 3138–3145.
16. Medeiros FA, Zangwill LM, Bowd C, Vessani RM, Susanna R Jr, Weinreb RN. Evaluation of retinal nerve fiber layer, optic nerve head, and macular thickness measurements for glaucoma detection using optical coherence tomography. Am J Ophthalmol. 2005;139:44–55. 17. Chang RT, Knight OJ, Feuer WJ, Budenz DL. Sensitivity and specificity
of time-domain versus spectral-domain optical coherence tomography in diagnosing early to moderate glaucoma. Ophthalmology. 2009;116: 2294–2299.
18. Leite MT, Rao HL, Zangwill LM, Weinreb RN, Medeiros FA. Comparison of the diagnostic accuracies of the Spectralis, Cirrus, and RTVue optical coherence tomography devices in glaucoma. Ophthalmology. 2011;118:1334–1339.
19. Medeiros FA, Vizzeri G, Zangwill LM, Alencar LM, Sample PA, Wein-reb RN. Comparison of retinal nerve fiber layer and optic disc imaging for diagnosing glaucoma in patients suspected of having the disease. Ophthalmology. 2008;115:1340–1346.
20. Leung CK, Ye C, Weinreb RN, et al. Retinal nerve fiber layer imaging with spectral-domain optical coherence tomography: a study on diag-nostic agreement with Heidelberg retinal tomograph. Ophthalmology. 2010;117:267–274.
21. Leung CK, Cheung CY, Weinreb RN, et al. Retinal nerve fiber layer imag-ing with spectral-domain optical coherence tomography: a variability and diagnostic performance study. Ophthalmology. 2009;116: 1257–1263. 22. Leite MT, Zangwill LM, Weinreb RN, et al. Effect of disease
sever-ity on the performance of Cirrus spectral-domain OCT for glaucoma diagnosis. Invest Ophthalmol Vis Sci. 2010;51:4104–4109.
23. Lisboa R, Leite MT, Zangwill LM, Tafreshi A, Weinreb RN, Medeiros FA. Diagnosing preperimetric glaucoma with spectral domain optical coherence tomography. Ophthalmology. 2012;119:2261–2269. 24. Kerrigan-Baumrind LA, Quigley HA, Pease ME, Kerrigan DF,
Mitchell RS. Number of ganglion cells in glaucoma eyes compared with threshold visual field tests in the same persons. Invest Ophthalmol Vis Sci. 2000;41:741–748.
25. Harwerth RS, Carter-Dawson L, Shen F, Smith EL 3rd, Crawford ML. Ganglion cell losses underlying visual field defects from experimental glaucoma. Invest Ophthalmol Vis Sci. 1999;40:2242–2250.
26. Harwerth RS, Carter-Dawson L, Smith EL 3rd, Barnes G, Holt WF, Crawford ML. Neural losses correlated with visual losses in clinical perimetry. Invest Ophthalmol Vis Sci. 2004;45:3152–3160.
27. Quigley HA, Dunkelberger GR, Green WR. Retinal ganglion cell atro-phy correlated with automated perimetry in human eyes with glaucoma. Am J Ophthalmol. 1989;107:453–464.
28. Malik R, Swanson WH, Garway-Heath DF. ‘Structure-function rela-tionship’ in glaucoma: past thinking and current concepts. Clin Exp Ophthalmol. 2012;40:369–380.
29. Garway-Heath DF, Caprioli J, Fitzke FW, Hitchings RA. Scaling the hill of vision: the physiological relationship between light sensitiv-ity and ganglion cell numbers. Invest Ophthalmol Vis Sci. 2000;41: 1774–1782.
30. Medeiros FA, Zangwill LM, Anderson DR, et al. Estimating the rate of retinal ganglion cell loss in glaucoma. Am J Ophthalmol. 2012;154: 814–824.
31. Medeiros FA, Zangwill LM, Bowd C, Mansouri K, Weinreb RN. The structure and function relationship in glaucoma: implications for detection of progression and measurement of rates of change. Invest Ophthalmol Vis Sci. 2012;53:6939–6946.
32. Hood DC, Kardon RH. A framework for comparing structural and functional measures of glaucomatous damage. Prog Retin Eye Res. 2007;26:688–710.
33. Swanson WH, Felius J, Pan F. Perimetric defects and ganglion cell damage: interpreting linear relations using a two-stage neural model. Invest Ophthalmol Vis Sci. 2004;45:466–472.
34. Medeiros FA, Sample PA, Zangwill LM, Liebmann JM, Girkin CA, Weinreb RN. A statistical approach to the evaluation of covariate effects on the receiver operating characteristic curves of diagnostic tests in glaucoma. Invest Ophthalmol Vis Sci. 2006;47:2520–2527.
35. Liu S, Lam S, Weinreb RN, et al. Comparison of standard automated perimetry, frequency-doubling technology perimetry, and short-wavelength automated perimetry for detection of glaucoma. Invest Ophthalmol Vis Sci. 2011;52:7325–7331.
36. Johnson CA, Adams AJ, Casson EJ, Brandt JD. Blue-on-yellow perim-etry can predict the development of glaucomatous visual field loss. Arch Ophthalmol. 1993;111:645–650.
37. Johnson CA, Samuels SJ. Screening for glaucomatous visual field loss with frequency-doubling perimetry. Invest Ophthalmol Vis Sci. 1997;38:413–425.
38. Johnson CA, Adams AJ, Casson EJ, Brandt JD. Progression of early glaucomatous visual field loss as detected by blue-on-yellow and stan-dard white-on-white automated perimetry. Arch Ophthalmol. 1993;111: 651–656.
39. Landers JA, Goldberg I, Graham SL. Detection of early visual field loss in glaucoma using frequency-doubling perimetry and short-wavelength automated perimetry. Arch Ophthalmol. 2003;121: 1705–1710.
Clinical Ophthalmology downloaded from https://www.dovepress.com/ by 118.70.13.36 on 21-Aug-2020
Clinical Ophthalmology
Publish your work in this journal
Submit your manuscript here: http://www.dovepress.com/clinical-ophthalmology-journal Clinical Ophthalmology is an international, peer-reviewed journal covering all subspecialties within ophthalmology. Key topics include: Optometry; Visual science; Pharmacology and drug therapy in eye diseases; Basic Sciences; Primary and Secondary eye care; Patient Safety and Quality of Care Improvements. This journal is indexed on
PubMed Central and CAS, and is the official journal of The Society of Clinical Ophthalmology (SCO). The manuscript management system is completely online and includes a very quick and fair peer-review system, which is all easy to use. Visit http://www.dovepress.com/ testimonials.php to read real quotes from published authors.
Dovepress
Dove
press
early detection of glaucoma
40. Medeiros FA, Sample PA, Weinreb RN. Frequency doubling technology perimetry abnormalities as predictors of glaucomatous visual field loss. Am J Ophthalmol. 2004;137:863–871.
41. Sample PA, Medeiros FA, Racette L, et al. Identifying glaucomatous vision loss with visual-function-specific perimetry in the diagnostic innovations in glaucoma study. Invest Ophthalmol Vis Sci. 2006;47: 3381–3389.
42. Shabana N, Cornilleau Pérès V, Carkeet A, Chew PT. Motion perception in glaucoma patients: a review. Surv Ophthalmol. 2003;48:92–106. 43. Sample PA, Weinreb RN. Color perimetry for assessment of primary
open-angle glaucoma. Invest Ophthalmol Vis Sci. 1990;31:1869–1875. 44. White AJ, Sun H, Swanson WH, Lee BB. An examination of
physi-ological mechanisms underlying the frequency-doubling illusion. Invest Ophthalmol Vis Sci. 2002;43:3590–3599.
45. Tafreshi A, Sample PA, Liebmann JM, et al. Visual function-specific perimetry to identify glaucomatous visual loss using three different definitions of visual field abnormality. Invest Ophthalmol Vis Sci. 2009;50:1234–1240.
46. Lamparter J, Russell RA, Schulze A, Schuff AC, Pfeiffer N, Hoffmann EM. Structure-function relationship between FDF, FDT, SAP, and scanning laser ophthalmoscopy in glaucoma patients. Invest Ophthalmol Vis Sci. 2012;53:7553–7559.
47. Marvasti AH, Tatham AJ, Weinreb RN, Medeiros FA. Heidelberg edge perimetry for the detection of early glaucomatous damage: a case report. Case Rep Ophthalmol. 2013;4:144–150.
48. Leung CK, Cheung CY, Weinreb RN, et al. Evaluation of retinal nerve fiber layer progression in glaucoma: a study on optical coherence tomography guided progression analysis. Invest Ophthalmol Vis Sci. 2010;51:217–222.
49. Jampel HD, Friedman D, Quigley H, et al. Agreement among glaucoma specialists in assessing progressive disc changes from photographs in open-angle glaucoma patients. Am J Ophthalmol. 2009;147:39–44. e1. 50. Wollstein G, Garway-Heath DF, Hitchings RA. Identification of
early glaucoma cases with the scanning laser ophthalmoscope. Ophthalmology. 1998;105:1557–1563.
51. Wollstein G, Garway-Heath DF, Fontana L, Hitchings RA. Identifying early glaucomatous changes. Comparison between expert clinical assess-ment of optic disc photographs and confocal scanning ophthalmoscopy. Ophthalmology. 2000;107:2272–2277.
52. Jaffe GJ, Caprioli J. Optical coherence tomography to detect and manage retinal disease and glaucoma. Am J Ophthalmol. 2004;137:156–169. 53. Kamal DS, Garway-Heath DF, Hitchings RA, Fitzke FW. Use of
sequen-tial Heidelberg retina tomograph images to identify changes at the optic disc in ocular hypertensive patients at risk of developing glaucoma. Br J Ophthalmol. 2000;84:993–998.
54. Chauhan BC, Nicolela MT, Artes PH. Incidence and rates of visual field progression after longitudinally measured optic disc change in glaucoma. Ophthalmology. 2009;116:2110–2118.
55. Lisboa R, Mansouri K, Zangwill LM, Weinreb RN, Medeiros FA. Likelihood ratios for glaucoma diagnosis using spectral-domain optical coherence tomography. Am J Ophthalmol. 2013;156:918–926. e2.
56. Deleón-Ortega JE, Arthur SN, McGwin G Jr, Xie A, Monheit BE, Girkin CA. Discrimination between glaucomatous and nonglaucoma-tous eyes using quantitative imaging devices and subjective optic nerve head assessment. Invest Ophthalmol Vis Sci. 2006;47:3374–3380. 57. Medeiros FA, Zangwill LM, Bowd C, Sample PA, Weinreb RN. Use
of progressive glaucomatous optic disk change as the reference stan-dard for evaluation of diagnostic tests in glaucoma. Am J Ophthalmol. 2005;139:1010–1018.
58. Medeiros FA, Lisboa R, Zangwill LM, et al. Evaluation of progressive neuroretinal rim loss as a surrogate end point for development of visual field loss in glaucoma. Ophthalmology. 2014;121:100–109.
59. Miki A, Zangwill L, Jain S, et al. Rates of retinal nerve fiber layer thin-ning in glaucoma suspect eyes. ARVO 2013, abstract number 1706. 60. Harwerth RS, Wheat JL, Fredette MJ, Anderson DR. Linking structure
and function in glaucoma. Prog Retin Eye Res. 2010;29:249–271. 61. Medeiros FA, Lisboa R, Weinreb RN, Liebmann JM, Girkin C,
Zangwill LM. Retinal ganglion cell count estimates associated with early development of visual field defects in glaucoma. Ophthalmology. 2013;120:736–744.
62. Medeiros FA, Lisboa R, Weinreb RN, Girkin CA, Liebmann JM, Zangwill LM. A combined index of structure and function for staging glaucomatous damage. Arch Ophthalmol. 2012;130:1107–1116. 63. Meira-Freitas D, Lisboa R, Tatham A, et al. Predicting progression in
glaucoma suspects with longitudinal estimates of retinal ganglion cell counts. Invest Ophthalmol Vis Sci. 2013;54:4174–4183.
64. European Glaucoma Prevention Study Group, Gordon MO, Torri V, et al. Validated prediction model for the development of primary open-angle glaucoma in individuals with ocular hypertension. Ophthalmology. 2007;114:10–19.
65. Gordon MO, Beiser JA, Brandt JD, et al. The Ocular Hypertension Treatment Study: baseline factors that predict the onset of primary open-angle glaucoma. Arch Ophthalmol. 2002;120:714–720. 66. Jaeschke R, Guyatt GH, Sackett DL. Users’ guides to the medical
literature. III. How to use an article about a diagnostic test. B. What are the results and will they help me in caring for my patients? The Evidence-Based Medicine Working Group. JAMA. 1994;271: 703–707.
67. Kuang TM, Lisboa R, Tatham AJ, et al. Continuous likelihood ratios for glaucoma diagnosis using the combined index of structure and function. ARVO 2013, abstract number 2295.
68. Medeiros FA, Leite MT, Zangwill LM, Weinreb RN. Combining struc-tural and functional measurements to improve detection of glaucoma progression using Bayesian hierarchical models. Invest Ophthalmol Vis Sci. 2011;52:5794–5803.
69. Russell RA, Malik R, Chauhan BC, Crabb DP, Garway-Heath DF. Improved estimates of visual field progression using Bayesian linear regression to integrate structural information in patients with ocular hypertension. Invest Ophthalmol Vis Sci. 2012;53:2760–2769.
Clinical Ophthalmology downloaded from https://www.dovepress.com/ by 118.70.13.36 on 21-Aug-2020

![Figure 4 Receiver operating-characteristic curve for discriminating preperimetric glaucomatous eyes from healthy eyes for standard automated perimetry visual field index (vFi) (area under the curve [AUC] =0.51), optical coherence tomography average retinal](https://thumb-us.123doks.com/thumbv2/123dok_us/8016992.1333127/7.612.331.548.487.647/receiver-operating-characteristic-discriminating-preperimetric-glaucomatous-perimetry-tomography.webp)