FORMULATION DEVELOPMENT, CHARACTERIZATION, AND IN VITRO EVALUATION OF
FLOATING MATRIX DOSAGE FORM OF TRAMADOL HYDROCHLORIDE USING VARIOUS
POLYMERS
SARADA ANEPU
1*, LOHITHASU DUPPALA
1,2, SOMA SUNDARI M
31Division of Pharmaceutical Technology, A. U. College of Pharmaceutical Sciences, Andhra University, Visakhapatnam, Andhra Pradesh, India. 2Department of Pharmaceutics, GITAM Institute of Pharmacy, GITAM University, Visakhapatnam, Andhra Pradesh, India. 3Department of Pharmaceutics, Vignan Institute of Pharmaceutical Technology, VIGNAN University, Visakhapatnam, Andhra Pradesh,
India. Email: [email protected]
Received: 08 October 2016, Revised and Accepted: 22 October 2016
ABSTRACT
Objective: The purpose of present study was to formulate the gastro-retentive floating tablets of tramadol hydrochloride for enhancement of the gastric residence time.
Methods: The floating tablets were prepared by direct compression method and evaluated for hardness, thickness, and friability of the tablets. The in vitro drug release studies were performed for different formulations and to optimize the best formulae based on the dissolution profiles.
Results: Fourier transform infrared spectroscopy and differential scanning calorimetry studies revealed that there was no interaction between tramadol hydrocholride and excipients. The formulated tablets were evaluated for properties such as weight variation, hardness, thickness, friability, drug content, density and floating properties, matrix integrity and complied with United States Pharmacopoeia requirements. The tablets of optimized formula had floating lag time of 120, 72, and 96 seconds and the tablets remained in the floating condition for more than 12 hrs. The results of drug excipients compatibility studies suggest that there was no significant change in the physical appearance of these blends when stored at 40°C/75% relative humidity for 4-week. Among various trial formulations developed with different concentration of polymer F3 (hydroxypropyl methyl cellulose [HPMC] K4M with 120 mg of polymer), F5 (HPMC K15M with 100 mg polymer), F11 (polyethylene oxide WSR 303 with 100 mg polymer), were chosen as the optimized formulations based on the release profile.
Conclusion: Tramadol hydrochloride floating tablets were successfully made using various polymers for the enhancement of the gastric residence time. From the present study, it was concluded that HPMC K4M can be used as an effective polymer for the formulation of floating effervescent tablets of highly soluble drug indicating the successful development of sustained release floating drug delivery system.
Keywords: Tramadol hydrochloride, Floating tablets, Polyethylene oxide 303 WSR, Polyethylene oxide N60, Hydroxypropyl methylcellulose K4M, Hydroxypropyl methyl cellulose K15M, Hydroxypropyl methyl cellulose K100M.
INTRODUCTION
The oral route is considered most frequent, natural, preferred, uncomplicated, convenient, more flexible, safe due to its ease of administration, patient acceptance, flexibility in formulation, and cost-effective manufacturing process. The most of the therapeutic agents are, generally effectual when the release is at a fairly constant rate or near the absorption sites. The absorption of drug produced results in required plasma concentrations leading to reduce side effects and optimum efficacy. Controlled drug delivery technology offer many advantages, which includes that the increasing therapeutic activity compared to the intensity of side effects, reducing the frequency of administration thereby achieve the patient compliance, or eliminating the need for specialized drug administration (e.g., repeated injections) when compared to conventional dosage forms and it shows a typical release pattern of drug release for a prolonged period of time by maintaining the drug concentration within the therapeutic window where the rate of drug release matches the rate of elimination [1-4].
Hydroxypropyl methylcellulose (HPMC) is an odorless, tasteless, white or creamy-white fibrous or granular powder and it molecular weight ranges from 10,000 to 1,500,000 g/mol. It is used as tablet binder (2-5% w/v), emulsifier, rate controlling polymer, stabilizing agent in gels, adhesive in plastic bandages, suspending agent, thickening agent
(0.45-1% concentration, in eye drops and artificial tear solutions), viscosity-increasing agent, coating agent, film-former in tablet film coating and extended release matrix tablet formulations (generally high viscosity grades used). It is used in protective colloids, which prevents droplets and particles from coalescing. Commonly, lower viscosity grades of polymer are used in aqueous film coating, and higher viscosity grades are used in solvent film coating. The concentration varies from 2% to 10% w/v depends on the viscosity grade of the polymer. Polyethylene oxide molecular weight ranges from 100,000 to 7,000,000 Daltons, and it is used as mucoadhesive polymer, tablet binder and thickening agent [5-8].
Tramadol hydrochloride is a centrally acting synthetic opioid analgesic, to treat moderate to severe pain through opoid receptor binding as well as inhibition of nor epinephrine and serotonin reuptake and it belongs to biopharmaceutical classification system class I drug (high soluble- high permeable drug). It has a wide range of applications, including treatment of rheumatoid arthritis, restless leg syndrome, and fibromyalgia. It has an absolute bioavailability of 75% and a volume of distribution of approximately 2.7 L/kg. It has an elimination half-life of 4-6 hrs and has an absorption zone from the upper intestinal tract. The efficacy of the administered dose may get diminished due to incomplete drug release from the device above the © 2017 The Authors. Published by Innovare Academic Sciences Pvt Ltd. This is an open access article under the CC BY license (http://creativecommons. org/licenses/by/4. 0/) DOI: http://dx.doi.org/10.22159/ajpcr.2017.v10i2.15587
absorption zone. Hence, it requires multiple daily drug dosage, high frequency of dosing to maintain optimum plasma concentrations and also having short plasma half-life due to this reason it is a suitable drug for gastro retentive formulation. The present system of preparing floating drug is that it will remain in gastric region for longer duration causing an increase in gastric residence time, which may cause improve bioavailability and reduces drug waste. The gastro-retentive drug delivery systems can be retained in the stomach for several hours and assist in continuously releasing the drug before it reaches the absorption window for significantly prolong the predictable period of gastric residence time to produce an optimum drug bioavailability as well as reduces drug waste without affecting the gastric emptying rate. The principal of buoyant preparation offers a simple and practical approach to achieve increased gastric residence time for dosage form and sustained drug release [5-13]. The present study is was aimed for development of gastro retentive floating matrix tablets of tramadol HCl using various polymers such as HMC K4M, HPMC K15M, HPMC K100M, polyethylene oxide (PEO) 303 WSR and PEO N60 and its comparative study was also done.
METHODS
Tramadol hydrochloride was obtained as the gift sample from Matrix Laboratories, Bangalore. HPMC K15 M, HPMC K4M, and HPMC K100M were procured from Merck chemicals limited, Germany. PEO 303 WSR and PEO N60 were purchased from Dow chemical company (USA). Other ingredients such as sodium bicarbonate, citric acid, magnesium stearate were procured from S.D. Fine chemicals, Mumbai.
Drug polymer interaction studies
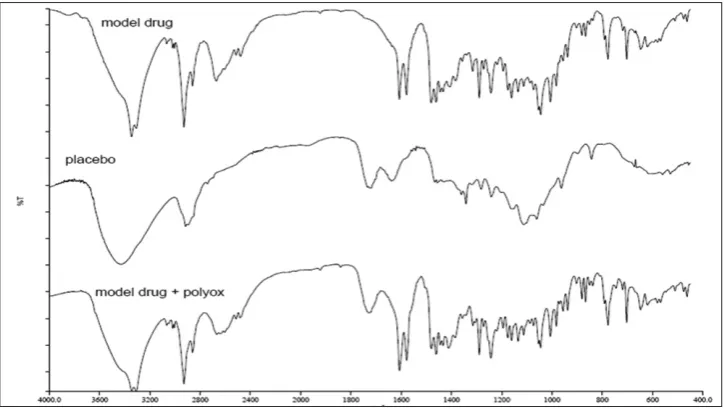
Fourier transform infrared (FTIR) spectroscopy study
Tramadol hydrochloride and excipients were subjected to compatibility study. The drug and polymer were mixed physically in 1:1 ratio and the mixtures were placed in sealed vials for 3 months at room temperature. The samples were prepared by mixing with potassium bromide and placing in the sample holder. The spectra were scanned over the wave number range of 4000-400/cm at the ambient temperature.
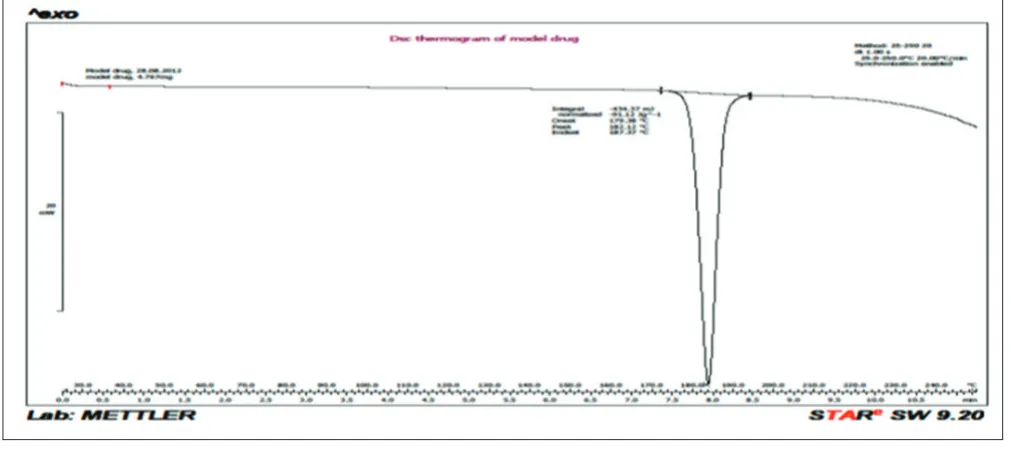
Differential scanning calorimetry (DSC) analysis
DSC analysis was carried out on pure drug, drug and excipients mixture. The accurate amount of samples was weighed into aluminum pans and sealed. All samples were run at a heating rate of 10°C/minute over a temperature range of 30-300°C in an atmosphere of nitrogen [5].
Standard curve of tramadol HCl
Spectrophotometric method based on the measurement of absorbance at 271 nm in 0.1 N HCl was used for the estimation of tramadol hydrochloride. 100 mg of the pure drug was dissolved in 100 ml of 0.1 N HCl (stock solution 1000 μg/ml), from this 10 ml of solution was taken, and the volume was adjusted to 100 ml with 0.1 N HCl (100 μg/ml). The above solution was subsequently diluted with 0.1 N HCl (pH 1.2) to obtain the series of dilutions containing 20, 60, 80, 100, 120, 140 μg/ml of tramadol HCl solution. The absorbance of the above dilutions was measured at 271 nm using the UV spectrophotometer (Shimadzu) using 0.1 N HCl as the blank. Then a graph was plotted by taking concentration on x-axis and absorbance on y-axis which gives a straight line [7].
Preparation of floating tablets
Floating tablets were prepared by direct compression technique using different grades of various polymers (HPMC K4M, HPMC K15M, HPMC K100M, PEO 303 WSR and PEO N 60) with varying amount (40, 60, and 80 mg).
All the ingredients (Table 1) except magnesium stearate were shifted through sieve ¹40 and blended in mixer uniformly. After that mixing thoroughly of drug as well as other components in polybag for 15 minutes and magnesium stearate were added for lubrication
purpose and further mixed for additional 2-3 minutes. The tablets were compressed using 9 mm concave punch on a single stroke punching machine.
Evaluation of tablets Bulk density
The power sample under test was screened through sieve no. 18 and the sample equivalent to 25 g was weighed and filled in a 100 ml graduated cylinder and the power was leveled and the unsettled volume, Vo was noted. The bulk density was calculated in g/cm3 by the formula [2].
The power sample under test was screened through sieve no. 18 and the weight of sample equivalent to 25 g filled in 100 ml graduated cylinder. The mechanical tapping of cylinder was carried out using tapped density tester at a nominal rate of 300 drops per minute for 500 times initially and the tapped volume Vo was noted. Tapping was proceeding further for an additional tapping 750 times and tapped volume; Vb was noted. The difference between two tapping volume was less the 2%; Vb was considered as a tapped volume Vf.
The tapped density was calculated in g/cm3 by the formula:
Tapped density=M/Vf
Where,
M=Weight of sample power taken, Vf=Tapped volume.
Compressibility index
The bulk density, tapped density was measured, and compressibility index was calculated using formula:
C.I.=(Pt−Po)/(Pt)×100
Pt=tapped density, Po=bulk density.
Hausner ratio
Hausner ratio of the blend was calculated using the following formula:
Hausner ratio=Pt/Po
Pt=Tapped density, Po=Bulk density.
Angle of repose
It was determined by the fixed funnel method by following:
=Tan h
r
−
1
Where, h=Height of pile, r=Radius of the pile.
Characterization of tablets Drug content
The 20 tablets of each formulation were weighed and powdered. The quantity of powder equivalent to 100 mg of tramadol hydrochloride was transferred into a 100 ml volumetric flask, and the volume was adjusted to 100 ml with 0.1 N HCl. The sample was filtered to remove the insoluble excipients. Further, 1 ml of the above solution (filtrate) was diluted to 100 ml with 0.1 N HCl, and the absorbance of the resulting solution was observed at 271 nm [5].
Hardness
Hardness of the tablet was determined by using the Monsanto hardness tester. The lower plunger was placed in contact with the tablet, and a zero reading was taken. The plunger was then forced against a spring by turning a threaded bolt until the tablet fractured. As the spring was compressed a pointer rides along a gauge in the barrel to indicate the force required for the tablet to break.
Friability test
Friability was determined by weighing 10 tablets after dusting, placing them in the friabilator (Roche friabilator) and rotating the plastic cylinder vertically at 25 rpm for 4 minutes. After dusting, the total remaining weight of the tablets was recorded and the percent friability was calculated using formula [2].
Friability= Weight original Weight final Weight original
( − )
×100
Weight variation test
Twenty tablets were randomly selected from each batch and individually weighed. The average weight and standard deviation Table 1: Formulation of tramadol floating tablets
Formulation code HPMC K4M (mg) HPMC K15M (mg) HPMC K100M (mg) PEO 303 WSR (mg) Avicel (mg) PEO N60 (mg)
F1 40 - - - 110
-F2 60 - - - 90
-F3 80 - - - 70
-F4 - 40 - - 110
-F5 - 60 - - 90
-F6 - 80 - - 70
-F7 - - 40 - 110
-F8 - - 60 - 90
-F9 - - 80 - 70
-F10 - - - - 110 40
F11 - - - - 90 60
F12 - - - - 70 80
F13 - - - 40 110
-F14 - - - 60 90
-F15 - - - 80 70
-All formulations contains 100 mg of tramadol HCl, 5 mg citric acid, 40 mg of sodium bicarbonate and 5 mg of magnesium stearate. HPMC: Hydroxy propyl methyl cellulose, PEO: Polyethylene oxide
of 20 tablets were calculated. The batch passes the test for weight variation test if not more the two of the individual tablet weight deviate from the average weight by more than the percentage shown in the table and none deviate by more than twice the percentage shown [5].
Floating property study
The time taken for dosage form to emerge on surface medium called floating lag time (FLT) and duration of time by which it constantly emerge on surface of the medium is called total floating time. The tablets from each formulation batch were placed in the United States Pharmacopoeia (USP) Type II dissolution apparatus (Disso 2000, Labindia) containing 900 ml 0.1 N HCl of pH 1.2 using paddle at a rotational speed of 100 rpm. The temperature of the medium and the duration of time by which the tablet constantly remain on the surface of medium were noted.
Swelling behavior study of the tablets
The extent of swelling can be measured in terms of %weight gain by the tablet. For each formulation batch, tablets were weighed and
placed in a beaker containing 200 ml 0.1 N HCl of pH 1.2. After each hour the tablets were removed from beaker and weighed again up to 12 hrs. The percent weight gain by the tablet was calculated by the formula [7].
Sewlling index W W
W
t 0
= − 0×100
Wt=Weight of tablet at time t hr, W0=Weight of tablet before immersion.
In vitro dissolution studies
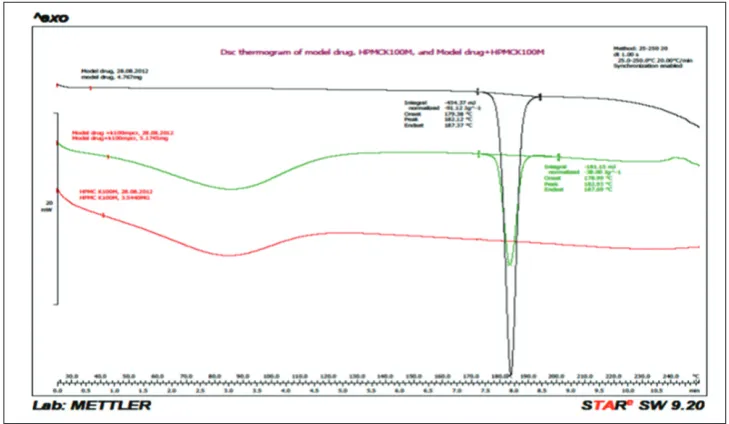
Dissolution of tablets of each batch was carried out using USP Type II dissolution apparatus (Disso 2000, Labindia) using paddle. 900 ml of 0.1 N HCl (pH 1.2) was filled in a dissolution vessel, and the temperature of medium were set at 37°C±0.5°C. Tablets were placed in dissolution vessel, and the rotational speed of paddle was set at rpm 75. The 10 ml of sample was withdrawn at predetermined time interval (0.5, 1, 2, 4, 6, 8, 10, 12 hrs) and same volume of fresh medium was replaced. The samples were analyzed for drug contain against 0.1 N HCl as a blank at a Fig. 3: Differential scanning calorimetry thermo gram of pure drug, hydroxypropyl methylcellulose (HPMC) K100M model drug, HPMC
K100 M physical mixture
Fig. 5: Differential scanning calorimetry thermo gram of pure drug, drug and avicel PH 102, avicel PH 102 with physical mixture
Fig. 6: Differential scanning calorimetry thermo gram of pure drug, drug and sodium bicarbonate, sodium bicarbonate with physical mixture
wavelength of 271 nm using double beam UV-visible spectrophotometer (Shimadzu). The content of drug was calculated using the equation generated from the standard curve. The % cumulative drug release was calculated.
Drug release kinetics of the matrix tablets
The analysis of drug release mechanism from a pharmaceutical dosage form is an important but complicated process. The dissolution data is fitted to popular release models such as zero order, first order, diffusion, and erosion. The order of drug release from matrix systems was described using zero order kinetics or first order kinetics. The mechanism of drug release from matrix systems was studied by using Higuchi and erosion equations [1].
Zero order release kinetics
It defines a linear relationship between the fractions of drug released versus time.
Q=kot
Where, Q is the fraction of drug released at time t and ko is the zero order release rate constant. A plot of the fraction of drug released against time will be linear if the release obeys zero order release kinetics.
First order release kinetics
Wagner assuming that the exposed surface area of a tablet decreased exponentially with time during dissolution process suggested that drug Fig. 8: Fourier transform infrared spectroscopy spectrum of tramadol hydrochloride
release from most slow release tablets could be described adequately by apparent first-order kinetics.
In(1−Q)=−k1t
Where, Q is the fraction of drug released at time (t) and k1 is the first order release rate constant. A plot of the logarithm of the fraction of drug remained against time will be linear if the release obeys first order release kinetics.
Higuchi equation
It defines a linear dependence of the active fraction released per unit of surface (Q) on the square root of time.
Q=k2t1/2
Where Q is the fraction of drug released at time t, k2is the release rate constant. A plot of the fraction of drug released against square root of time will be linear if the release obeys Higuchi equation.
Erosion equation
This equation defines the drug release based on tablet erosion alone.
Q=1−(1−k3t)3
Where, Q is the fraction of drug released at time t, k3 is the release rate constant. A plot between [1−(1−Q1/3] against time will be linear if the release obeys erosion equation [4-25].
RESULTS
Drug polymer interaction study FTIR analysis
The spectra of physical mixture were compared with the infrared spectrum of pure drug. From the infrared spectra, it is clearly evident that there were no interactions of the drug. Infrared spectrum of the pure drug shows the characteristic peaks at 3346.2/cm and 702.77/ cm. Spectrum of drug and excipients exhibited peaks at similar ranges. This confirms the undisturbed structure of the drug in the formulation. This proves the fact that there is no potential incompatibility of the drug with the polymers used in the formulations. Hence, the formula for preparing tramadol hydrochloride floating tablets can be reproduced in the industrial scale without any apprehension of possible drug-polymer interactions.
DSC thermograms
DSC thermograms revealed and confirmed that there was no interaction between drug and polymer.
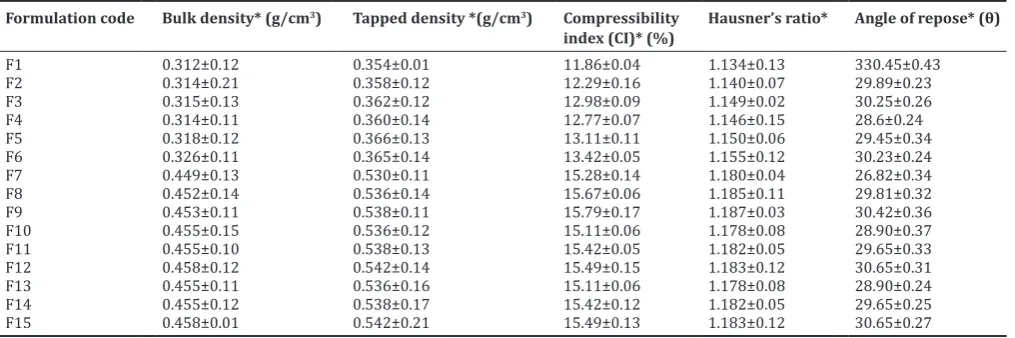
Flow properties of formulations
The bulk density and tapped density of formulation F1-F15 ranges from 0.312 to 0.458 and 0.354 to 0.542 g/cc, respectively. The bulk density and tapped density for optimized formulation (F3) was found to be 0.315 and 0.362 g/cc, respectively, which were reported in Table 3. The values of carr’s index, hausner’s ratio, angle of repose which were reported in Table 3 indicated good to fair flow properties as per USP
Fig. 10: Fourier transform infrared spectroscopy spectrum of tramadol hydrochloride, physical mixture of placebo and drug with polyox
Table 2: Visual observation for drug-excipient ratios for compatibility study
Composition code Initial I Week,
40°C/75% RH II Weeks, 40°C/75% RH III Weeks, 40°C/75% RH IV Weeks, 40°C/75% RH
Drug White powder White powder White powder White powder White powder
Drug and HPMC K4 M Cream powder Cream powder Cream powder Cream powder Cream powder
Drug and HPMC K15 M Cream powder Cream powder Cream powder Cream powder Cream powder
Drug and HPMC K100 M Cream powder Cream powder Cream powder Cream powder Cream powder
Drug and POLYOX 303 WSR White powder White powder White powder White powder White powder
Drug and AVICEL pH 1 O2 White powder White powder White powder White powder White powder
Drug and sodium bicarbonate White powder White powder White powder White powder White powder
Drug and citric acid White powder White powder White powder White powder White powder
Drug and magnesium stearate White powder White powder White powder White powder White powder
limits. For optimized formulation, free flow properties were categorized as good flow which was reported in Table 3.
Floating behavior
All these formulations remained floating for more than 6 hrs which were indicated in Table 4. Optimized formulation (F3) also remained floating for 12 hrs as indicated in Table 4. The floating properties of tablets may be attributed to their low density.
Swelling studies
The results were shown in Table 5. It revealed that all the formulations swell to certain degree after coming in contact with simulated gastric fluid.
Post compression parameters
The tablets were evaluated for various tableting characteristics. All formulations were passed the evaluation tests and showed the compared satisfactory results. The obtained results were shown in Table 6.
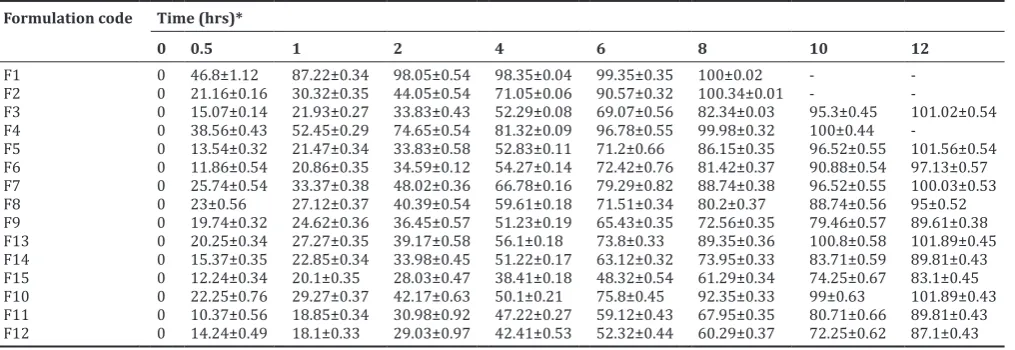
In vitro drug release
Among various trial formulations developed with different concentration of polymer and excipients, F3 (HPMC K4 M with 120 mg of polymer), F5 (HPMC K15 M with 100 mg polymer), F11 (Polyox WSR 303 with 100 mg polymer), were chosen as the optimized formulations based on the release profile. The cumulative % drug release of all formulations from F1 to F15 was shown in Fig. 11 and Table 7.
Table 3: Flow properties of formulation blends from F1 to F15 Formulation code Bulk density* (g/cm3) Tapped density *(g/cm3) Compressibility
index (CI)* (%) Hausner’s ratio* Angle of repose* (θ)
F1 0.312±0.12 0.354±0.01 11.86±0.04 1.134±0.13 330.45±0.43
F2 0.314±0.21 0.358±0.12 12.29±0.16 1.140±0.07 29.89±0.23
F3 0.315±0.13 0.362±0.12 12.98±0.09 1.149±0.02 30.25±0.26
F4 0.314±0.11 0.360±0.14 12.77±0.07 1.146±0.15 28.6±0.24
F5 0.318±0.12 0.366±0.13 13.11±0.11 1.150±0.06 29.45±0.34
F6 0.326±0.11 0.365±0.14 13.42±0.05 1.155±0.12 30.23±0.24
F7 0.449±0.13 0.530±0.11 15.28±0.14 1.180±0.04 26.82±0.34
F8 0.452±0.14 0.536±0.14 15.67±0.06 1.185±0.11 29.81±0.32
F9 0.453±0.11 0.538±0.11 15.79±0.17 1.187±0.03 30.42±0.36
F10 0.455±0.15 0.536±0.12 15.11±0.06 1.178±0.08 28.90±0.37
F11 0.455±0.10 0.538±0.13 15.42±0.05 1.182±0.05 29.65±0.33
F12 0.458±0.12 0.542±0.14 15.49±0.15 1.183±0.12 30.65±0.31
F13 0.455±0.11 0.536±0.16 15.11±0.06 1.178±0.08 28.90±0.24
F14 0.455±0.12 0.538±0.17 15.42±0.12 1.182±0.05 29.65±0.25
F15 0.458±0.01 0.542±0.21 15.49±0.13 1.183±0.12 30.65±0.27
*Indicates±SD (n=3), SD: Standard deviation
Table 4: Characterization of floating properties
Formulation code FLT* (s±SD) Floating duration (hrs) Matrix integrity
F1 15±2.2 6 +
*Indicates±SD (n=3), SD: Standard deviation
Table 5: Swelling studies for formulations Formulation code Percentage of swelling* (%± SD)
1 h 2 h 3 h 4 h 5 h 6 h 7 h 8 h
F1 Tablets showed maximum amount of erosion
F2 0.75±0.34 0.98±0.23 1.08±0.22 1.87±0.08 1.98±0.34 2.08±0.02 2.29±0.27 2.46±0.09
F3 0.88±0.26 1.06±0.32 1.04±0.23 1.96±0.32 2.11±0.27 2.35±0.03 2.38±0.23 2.54±0.23
F4 Tablets showed maximum amount of erosion
F5 1.33±0.36 1.47±0.37 1.73±0.32 1.68±0.47 1.81±0.32 2.06±0.02 2.32±0.22 2.56±0.02
F6 1.38±0.39 1.49±0.23 1.84±0.42 1.95±0.49 2.00±0.40 2.10±0.32 2.44±0.23 2.75±0.43
F7 1.36±0.25 1.56±0.22 1.74±0.38 2.03±0.32 2.31±0.25 2.43±0.36 2.55±0.24 2.77±0.43
F8 1.34±0.43 1.67±0.25 1.85±0.36 2.17±0.33 2.41±0.42 2.54±0.34 2.69±0.23 2.78±0.45
F9 1.84±0.23 2.00±0.37 2.39±0.34 2.40±0.34 2.43±0.28 3.07±0.30 3.23±0.24 3.33±0.49
F13 2.10±0.43 2.15±0.32 2.20±0.31 2.45±0.34 2.67±0.29 2.89±0.32 3.12±0.24 3.45±0.28
F14 2.15±0.28 2.24±0.42 2.67±0.23 2.89±0.43 2.98±0.27 3.05±0.28 3.58±0.25 3.74±0.27
F15 2.19±0.32 2.45±0.22 2.75±0.45 2.99±0.43 3.14±0.24 3.66±0.27 3.91±0.25 3.96±0.34
Drug release kinetics
In vitro release data of optimized formulations were fitted to various kinetic models like zero order, first order, Higuchi, Korsmeyer-Peppas. Optimized formulations followed anomalous type (non-Fickian transport) and in vitro drug release was found to have followed Higuchi kinetics.
DISCUSSION
The maximum absorbance was observed at 271 nm. The standard curve was found to be linear in the range of 20-60 μg/ml and having the regression coefficient value of 0.99. Drug-excipient compatibility studies were done by FTIR and DSC, characteristic stretching bands were slightly varied after pre-formulation study, revealing no chemical interaction and drug-excipient compatibility studies shown that the slight broadening as well as shifting of endothermic peak due to melting effect of hydrophilic retardants. The granules of fifteen formulations (F1-F15) were evaluated for flow properties such as angle of repose, bulk density, tapped density, Carr’s index and Hausner’s ratio showed the blend has good flow property. It was found that all the granules have good flow property as they showed the angle of repose value was between 26 and 30°, represents good flow property. Carr’s index value and Hausner’s ratio were found that good flow property. There is no significant difference in friability values (% w/w) between prepared tablets consisting of various polymers and compressed at same force. The compression force is effected the friability and hardness. Tablets compressed with higher force tend to have slightly lower friability when compared with the ones compressed with smaller force due to the increased hardness of the tablets and increased binding ability of HPMC when compressed under larger forces. Tablets prepared with larger compression force produces harder tablets. Hardness is effected the floating time. Harder tablets tend to have longer FLT compared to softer tablets, which could be explained by the lower ability of water to penetrate and to hydrate the outer polymer layer and to provoque Table 6: Physical characterization of tablets
Formulation code Average weight of
tablet (mg)* Average thickness* (mm) Average hardness* (kp) Friability* (% w/w) Drug content*(%)
F1 300.9±0.5 4.65±0.5 5-6 0.390±0.06 100.54±0.34
F2 300.89±0.2 4.61±0.2 5-6 0.415±0.11 98.44±0.13
F3 300.9±0.5 4.59±0.3 5-6 0.426±0.03 99.68±0.09
F4 300.2±0.3 4.62±0.4 5-6 0.524±0.04 99.77±0.05
F5 300.3±0.8 4.56±0.5 5-6 0.541±0.01 100.9±0.12
F6 300.2±0.1 4.62±0.4 5-6 0.390±0.11 99.95±0.02
F7 300.7±1.2 4.52±0.8 5-6 0.344±0.05 99.98±0.05
F8 300.2±0.3 4.65±0.2 5-6 0.314±0.06 100.09±0.15
F9 300.6±0.3 4.61±0.6 5-6 0.325±0.12 100.5±0.08
F10 300.4±0.2 4.58±0.4 5-6 0.076±0.0.02 101.5±0.12
F11 298.9±1.5 4.59±0.2 5-6 0.072±0.04 100.9±0.04
F12 299.3±0.5 4.57±0.5 5-6 0.066±0.03 99.54±0.11
F13 300.6±0.3 5.54±0.5 5-6 0.050±0.02 100.67±0.13
F14 300.4±0.3 5.53±0.2 5-6 0.040± 100.56±0.14
F15 299.6±0.2 5.56±0.5 5-6 0.060± 99.64±0.13
*Mean±SD; n=3, SD: Standard deviation
Fig. 11: In vitro dissolution profile of various formulations (F1-F15)
Table 7: In vitro dissolution profile of various formulations (F1-F15) Formulation code Time (hrs)*
0 0.5 1 2 4 6 8 10 12
F1 0 46.8±1.12 87.22±0.34 98.05±0.54 98.35±0.04 99.35±0.35 100±0.02 -
-F2 0 21.16±0.16 30.32±0.35 44.05±0.54 71.05±0.06 90.57±0.32 100.34±0.01 -
-F3 0 15.07±0.14 21.93±0.27 33.83±0.43 52.29±0.08 69.07±0.56 82.34±0.03 95.3±0.45 101.02±0.54
F4 0 38.56±0.43 52.45±0.29 74.65±0.54 81.32±0.09 96.78±0.55 99.98±0.32 100±0.44
-F5 0 13.54±0.32 21.47±0.34 33.83±0.58 52.83±0.11 71.2±0.66 86.15±0.35 96.52±0.55 101.56±0.54
F6 0 11.86±0.54 20.86±0.35 34.59±0.12 54.27±0.14 72.42±0.76 81.42±0.37 90.88±0.54 97.13±0.57
F7 0 25.74±0.54 33.37±0.38 48.02±0.36 66.78±0.16 79.29±0.82 88.74±0.38 96.52±0.55 100.03±0.53
F8 0 23±0.56 27.12±0.37 40.39±0.54 59.61±0.18 71.51±0.34 80.2±0.37 88.74±0.56 95±0.52
F9 0 19.74±0.32 24.62±0.36 36.45±0.57 51.23±0.19 65.43±0.35 72.56±0.35 79.46±0.57 89.61±0.38
F13 0 20.25±0.34 27.27±0.35 39.17±0.58 56.1±0.18 73.8±0.33 89.35±0.36 100.8±0.58 101.89±0.45
F14 0 15.37±0.35 22.85±0.34 33.98±0.45 51.22±0.17 63.12±0.32 73.95±0.33 83.71±0.59 89.81±0.43
F15 0 12.24±0.34 20.1±0.35 28.03±0.47 38.41±0.18 48.32±0.54 61.29±0.34 74.25±0.67 83.1±0.45
F10 0 22.25±0.76 29.27±0.37 42.17±0.63 50.1±0.21 75.8±0.45 92.35±0.33 99±0.63 101.89±0.43
F11 0 10.37±0.56 18.85±0.34 30.98±0.92 47.22±0.27 59.12±0.43 67.95±0.35 80.71±0.66 89.81±0.43
F12 0 14.24±0.49 18.1±0.33 29.03±0.97 42.41±0.53 52.32±0.44 60.29±0.37 72.25±0.62 87.1±0.43
effervescent reaction which will provide floating of the dosage form and the total floating duration remained buoyant over the media for periods more than 8 hrs.
Swelling index of tablets composed of the various polymer/blend but compressed with different forces, it could be concluded that softer tablets have higher swelling capability compared to harder tablets which could be due to the lower inter-particle connections in the tablets and higher porosity which lead to greater water uptake and greater and faster swelling degree of the matrix. Tablets containing HPMC K4M tend to swell less compared with the tablets than HPMC K15M due to the highest solubility and erodability (due to low viscosity) of HPMC K4M than tablets containing HPMC K15M (due to high viscosity). All formulations of tablets formed a gel layer fast enough which give them firmness and provided controlled release of active compound in a period of 8 hrs by both diffusions through the pores of the hydrated polymer layer and erosion of the tablets surface. There are no significant differences into the dissolution profiles of tablets containing the same polymer/blend and compressed by different forces, nor of the tablets containing different polymers compressed by the same force.
CONCLUSION
In the present study, an attempt was made to formulate and optimize gastro retentive floating effervescent system of tramadol hydrochloride using HPMC and PEO as polymers. The pre-formulation studies were done initially from which it was inferred that model drug has fair flow properties. The formulated tablets were evaluated for properties such as weight variation, hardness, thickness, friability, drug content, density and floating properties, matrix integrity. The formulated floating tablets complied with USP requirements. The tablets of optimized formula had FLT of 120, 72, and 96 seconds and the tablets remained in the floating condition for more than 12 hrs. The results of drug excipients compatibility studies suggest that there was no significant change in the physical appearance of these blends, when stored at 40°C/75% relative humidity for 4 weeks. From the present study, it was concluded that HPMC K4 M can be used as effective polymer for the formulation of floating effervescent tablets of highly soluble drug indicating successful development of sustained release floating drug delivery system.
REFERENCES
1. Sarada A, Lohithasu D, Nikhil J, Janaki DS. Formulation and evaluation of gastro retentive matrix tablets of atenolol using melt granulation technique. Int J Pharm Sci Res 2016;7:1081-92.
2. Lohithasu D, Midhunkumar D, Hemasundararao I. Design and evaluation of lafutidine floating tablets for controlled release by using semi-synthetic and natural polymer. J Drug Discov Ther 2014;2(24):1-8. 3. Lohithasu D, Ramanamurthy KV. Isolation and evaluation of
binding property of Lannea coromandelica gum. Indian J Pharm Sci 2016;78:224-30.
4. Lohithasu D, Sarada A, Hema ND, Rajya LT. Assessment of film forming potential of Cordia dichotoma fruit mucilage (Boraginaceae): Alfuzosin hydrochloride as a drug of choices. J Appl Pharm Sci 2016;6:36-43.
5. Mohanvarma M, Kumar GE. Design and evaluation of gastroretentive floating matrix tablets of tramadol hydrochloride. Int J Pharm Chem Sci 2012;1:1205-17.
6. Birajdar SM, Darveshwar JD. Development and evaluation of floating-mucoadhesive dipyridamole tablet. Asian J Pharm Res Health Care 2012;4(3):78-89.
7. Debajyoti R, Amresh KP. Designing and in-vitro studies of gastric floating tablets of tramadol hydrochloride. Int J Appl Pharm 2010;1:12-6.
8. Chaurasia D, Kaushik K, Bhardwaj P, Chaurasia H, Jain SK, Shobhna S. Development and in vitro characterization of floating microspheres bearing tramadol HC1. Acta Pol Pharm 2011;68:795-801.
9. Narendra P, Raja SV, Prashanthi M, Jithender M, Sridhar KA. Formulation and in-vitro evaluation of tramadol hydrochloride floating tablets. Int Res J Pharm 2013;4:138-44.
10. Balamurugan J, Vijayalakshmi P. Preparation and evaluation of floating extended release matrix tablet using combination of polymethacrylates and polyethylene oxide polymers. Int J Pharm Pharm Sci 2014;6:584-92. 11. Taghizadeh Davoudi E, Ibrahim Noordin M, Kadivar A,
Kamalidehghan B, Farjam AS, Akbari Javar H. Preparation and characterization of a gastric floating dosage form of capecitabine. Biomed Res Int 2013;2013:495319.
12. Daisychellakumari S, Vengatesh S, Elango K, Devi DR, Deattu PC. Formulation and evaluation of floating tablets of ondansetron hydrochloride. Int J Drug Dev Res 2012;4:265-74.
13. Vamshidharreddy D, Sambashivarao A. Formulation and in-vitro evaluation of tramadol HCl multi-particulate floating tablets. World J Pharm Sci 2015;3:2226-32.
14. Kshetrimayum DD, Nandan KP, Uday BN, Yashraj G. Tramadol hydrochloride floating tablets: Formulation, in-vitro studies and influence of polymer incipient. Int J Pharm Bio Sci 2013;3:98-106. 15. Trivedi P, Verma A, Garud N. Preparation and characterization of
aceclofenac microspheres. Asian J Pharm 2008;2:110-5.
16. Yeole PG. Floating drug delivery system: Need and development. Indian J Pharm Sci 2005;67:265-72.
17. Garg S, Sharma S. Gastro retentive drug delivery systems. Pharmatech 2003;1:160-4.
18. Choi BY, Park HJ. Preparation of alginate beads for floating drug delivery system: Effect of CO2 gas forming agent. J Control Release
2000;25:488-91.
19. Bhavana V, Khopadejain AJ, Shelly WD, Jain NK. Targeted oral drug delivery. Indian Drugs 1996;33:365-73.
20. Sivakumar HG. Floating drug delivery system for prolonged gastric residence time: A review. Indian J Pharm Educ 2004;1:311-6.
21. Deshpande AA, Shah NH, Rhodes CT, Malick W. Development of a novel controlled-release system for gastric retention. Pharm Res 1997;14(6):815-9.
22. Giri S, Velmurugan S, Chowdary S. Formulation and evaluation of glipizide sustain release matrix tablets. Int J Pharm Pharm Sci 2013;5:354-60.
23. Raju KN, Velmurugan S, Deepika B, Vinushitha S. Formulation and in vitro evaluation of buccal tablets of metoprolol tartrate. Int J Pharm Pharm Sci 2011;3:239-46.
24. Sellappan V, Kiran K. Formulation and in vitro evaluation of glipizide mucoadhesive buccal tablets. Int J Pharm Biol Sci 2013;4:594-607. 25. Sellappan V, Srinivas P. Formulation and in vitro evaluation of losartan