R E S E A R C H
Open Access
Performance research on time-triggered Ethernet
based on network calculus
Yu Xiang, Wei Wang
*, Xiang Zhang and Zhenwei Li
Abstract
In the paper, we research on the performance of time-triggered Ethernet based on network calculus. Three kinds of data with different priority are imported to research on time-triggered Ethernet. Firstly, we adopt network calculus to obtain the theory-bound value of the network performance parameters. Then, we design and implement the
time-triggered Ethernet clock synchronization, redundancy fault-tolerant, multi-data communication, service-performance model, node model, and network model successfully in two different topologies. Lastly, we compare the simulation value with the network calculus value and obtain the comparison result. The result shows that the performance parameters of time-triggered Ethernet well meet the theory value, and time-triggered Ethernet specification is feasible.
Keywords:Time-triggered ethernet; Network calculus; Simulation; Service-performance model
1. Introduction
In recent years, the development of real-time tasks based on the existing Ethernet has become a hot-spot issue. In the fierce competition, the time-triggered Ethernet (TTE) stands out, which combines time-triggered technol-ogy certainty, fault-tolerant mechanisms, and real-time performance with the ordinary Ethernet's performances, like flexibility, dynamism, and best effort [1,2]. TTE pro-vides support for synchronous, highly reliable embedded computing and networking, fault-tolerant design. Because of its characteristics, TTE is widely used in the safety-critical system, such as aviation electronic technology, transport system, and industrial automation. It is a new method to analyze TTE using network calculus, and there is no existing research result.
‘Time-triggered’[3] means predictable and determinis-tic, which means all activities in the network would run in a planned way over time. The definition of the time-triggered Ethernet is as follows [4,5]:
TTE = Ethernet + Clock synchronization + Time-triggered communication + Rate-constrained traffic + Guaranteed transport.
In this article, we firstly construct a service-performance network calculus model which is triggered by time.
Meanwhile, we construct a simulation model and realize the TTE clock synchronization algorithm, protocol, and network components and then we use the simulation model to analyze the performance and parameters of the TTE. Lastly, we compare the simulation results with the network calculus results based on network calculus model and simulation model. Conclusions show that TTE can well meet the needs of safety-critical systems.
2. The service-performance model of TTE based on network calculus
Network calculus is a newly developed network quality of service (QoS) theory, and it is based on the Idempo-tent Mathematics and Residuation Theory [6]. The foun-dation of network calculus lies in the mathematical theory of algebra, the min-plus algebra, and the max-plus algebra. Network calculus can give out the network performance boundary. Deterministic network calculus makes use of arrival curve and service curve to work out the deterministic boundary of the network performance parameters [7,8], such as the maximum delay of the net-work data flow, the cache backlog data in the netnet-work communication nodes, and backlog length.
2.1 The service-performance model parameter of TTE Based on the network calculus theory, we give some def-initions as follows. The micro-data stream is defined as * Correspondence:[email protected]
School of Computer Science and Engineering, University of Electronic Science and Technology of China, No. 2006, Xiyuan Ave., West Hi-Tech Zone, Chengdu 611731, China
the data bit stream of the same type from the transmit-ting node.
2.2 Network service curve and service delay
We assume that the arrival curve of the micro-data stream with the priority p(j) isαj(t) =rjt+bj. So, Aj(t) =∑{i:p(i) = p(j)}αi(t) is the arrival curve of aggregated flow Gj, and AH
j ¼∑fi:p ið Þ>p jð Þgαið Þt is the arrival curve of aggregated flow.
We also assume that the service capabilities of the switch are C. Namely, the total service curve of the switch providing all the data stream through this switch is βR,T(t) = C[t−0]+. Based on corollary 6.2.1 [9], we obtain the service curve of the aggregated flow as formula 1:
Based on corollary 6.2.1 [9], we obtain the service curve of the aggregated flowGjas formula 2:
βGj;t¼ βPGj;t−AHj ð Þt
f gbiwith Equation 2, we obtain formula 3:
βGj;t¼
So, the service rate and service delay of the data streamGjare, respectively, formulas 4 and 5:
RG
Generally, when RGj >0, the switch forwards the type of data stream Gj. When RGj ¼0, the value is the mini-mum value, and the switch will have no ability to for-ward the dataGj. It will be no sense whenRGj >0.
Considering the micro-data stream Fj, all the micro-data in the streamGjis serviced in the order of FIFO. In this way, we can deduce the service curve of the micro-data streamFj.βRG
the service curve of the micro-data stream Fj is as follows:
So, the service rate and service delay of the micro-data streamFjare, respectively, as formulas 7 and 8:
Rj¼Max RGj −
Generally, whenRj> 0, the switch forwards the type of data stream Fj. When Rj= 0, the value is the minimum value, and the switch will have no ability forward the dataFj. It will be no sense whenRj< 0.
The network calculus value is the upper bound of the switch processing delay. According to the above reason-ing process, we can apply the theory into the TTE network scenario to deduce the upper deterministic boundary of the delay in star topology.
3. The design and realization of the simulation model
3.1 The design of TTE simulation model
Receive data
Judge the frame type?
PCF BEM/RCM
TTM Judge sync?
Receive and process
Message permanenc
function
Compression function
CM clock correction
Flood pcf
Preempt resources
Search configuration table, whether transmit or not?
Discard data
Forward data
End
Is the buffer full or not?
Store in the buffer
Is the token pool empty?
Wait T No
Sync receive
No Yes
Yes No
Asynchronous process
Yes
e
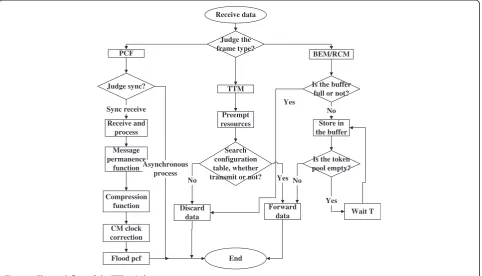
Figure 1The work flow of the TTE switch.
SC, while the TTE terminals can be as the role of SM and SC.
3.1.1 TTE switches
The main function of the TTE switch is to forward time-triggered data (TT data), traditional Ethernet best-effort data (BE data), or rate-limited data (RC data). The work-flow of the TTE switch is as shown in Figure 1 [10].
The most important two differences between the TTE switches and traditional switches are clock synchronization module and admission control module.
3.1.2 TTE terminals
The main function of the TTE terminal is to transmit and receive data. As the same with TTE switches, the TTE ter-minals supports TT data, the traditional Ethernet's BE data, and the RC data. The workflow of the TTE terminals is shown in Figure 2 [10].
3.2 TTE simulation performance
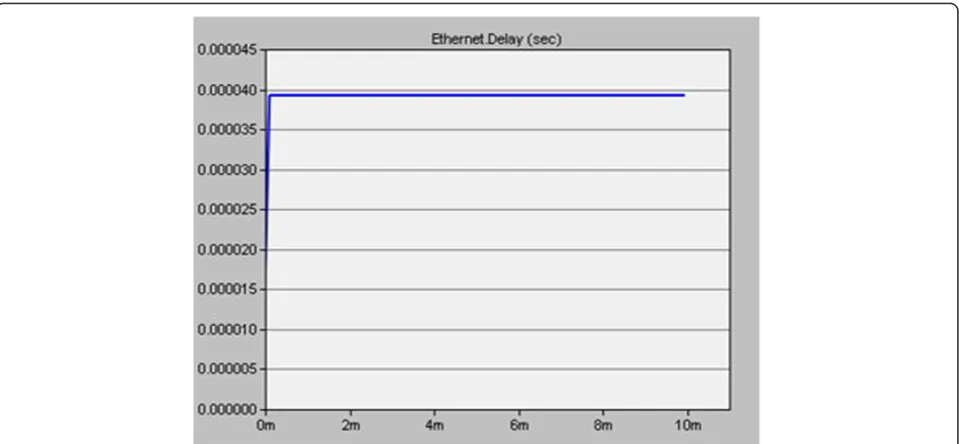
3.2.1 The constituent part of the TTE end-to-end delay The network topology is as shown in Figure 3. Node_1 and node_2 are the TTE terminals, while node_0 and node_3 are TTE switches. Node_1 generates new data and sends the data to node_2 through node_0 and node_3. The size of the data is 100bytes, and creation interval is 0.00001 s. The service capability of the switch is 100Mbps, and the link rate is 100Mbps. The simulation result of the end-to-end delay is as shown in Figure 4.
As the function op_sim_time () being able to get simu-lation time in simusimu-lation platform, we call the function when one node receives a frame. We can also get the simulation time of the frame with function op_pk_crea-tion_time_get (pkt_ptr), getting the time of the creation of frames (pkt_ptr is the point which points to the frame), and tt_ete_delay means one-way delay.
tt ete delay¼op sim timeðÞ−op pk creation time get pkt ptrð Þ:
ð9Þ
Figure 3The simple topology.
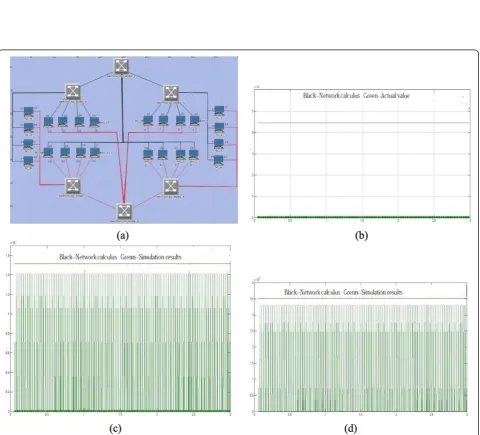
Figure 6Cascade topology and the three types of data. (a)The cascaded topology. The comparison analysis between simulation and network calculus results.(b)The time-triggered data.(c)The rate-constrained data.(d)The best-effort data.
In Figure 4, the x axis refers to the simulation time, and they axis refers to the value of end-to-end delay. It also applies to Figures 5 and 6.
The conclusion is that the TTE end-to-end delay of the above topology is the total sending delay of node_1, node_3, and node_0, and the total processing delay of node_3 and node_0.
4 Comparison analysis of the simulation results and network calculus results
In the second section, we analyze and derivate the max-imum delay of the TTE data in a specified network topology with the use of the theory of network calculus. Then, we conduct the statistical analysis on time-triggered Ethernet network performance parameters with
simulation tools. Here, we use the results of the two research tools to conduct comparative analysis to verify whether the results of the TTE simulation can meet the delay constraints of the maximum delay derived from network calculus.
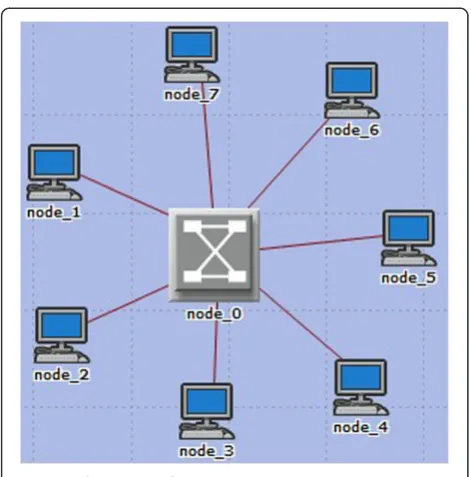
4.1 The star topology
The star topology is as shown in Figure 7. There are seven TTE terminals and one TTE switch in the top-ology. Each TTE terminal communicates with other terminals through the TTE switch. The TTE switch forwards three kinds of data: TT data, RC data, and BE data.
4.1.1 The network calculus process
In the star topology network simulation model, there are three types of data traffic (time-triggered real-time data (TT), RC, and BE).The rules of the terminal nodes send-ing frames are as follows (all the frames are standard Ethernet frames):
For the TT data stream, node_1, node_2, and node_3 send two frames per 0.025 s; node_4, node_5, node_6, and node_7 send one frame per 0.025 s; the TT data frame size varies from 100 to 500bytes. For the RC data stream, each node sends one frame per second; the frame size of the RC data stream varies from 100 to 500bytes. For the BE data stream, each node sends 10,000 frames per second; the frame size of the BE data varies from 100 to 500bytes.
According to the rules of the star topology, the arrival curve of three kinds of data streams is (for example packet_size = 100 bytes)
αTT¼ð4;000tþ100Þbytes
αRC¼ð8;000tþ100Þbytes
αBE¼ð1;000;000tþ100Þbytes:
Figure 7The star topology.
So, the parameters are as follows:
rTT= 4, 000, bTT= 100, rRC= 8, 000, bRC= 100, rBE= 4, 000, bBE= 4, 000, n= 7 (the number of the micro-data).
Based on formulas 1, 2, 3, 4, and 5, we can obtain the parameters of the aggregated flow which is aggregated by the micro-data:
Next, based on formulas 6, 7, and 8, we can obtain the parameters of the micro-data flow:
RRC¼RGRC−ðn−1Þ rRC¼1:044416108bps
Therefore, the separate service curve of the micro-data flowFj(TT, RC, and BE) supported by switch is
βs
In Section 3.2, we know that the end-to-end delay consists of not only the processing delay but also the sending delay. So, we obtain the following results:
Dmax
4.1.2.1 The comparison analysis of the end-to-end
delay of the three kinds of data In Section 4.1.1, we
obtain the calculus results of the star topology. We can obtain the simulation value of the star topology. In the star topology, the comparison analysis of the end-to-end delay of the three kinds of data is as follows (for ex-ample, packet_size = 100 bytes):
In the star topology, for the three kinds of data, the priority of the BE data is the smallest, and the prior-ity of the RC data is larger than that of the BE data, and the priority of the TT data is the largest. For the TT data and RC data, their end-to-end delays are
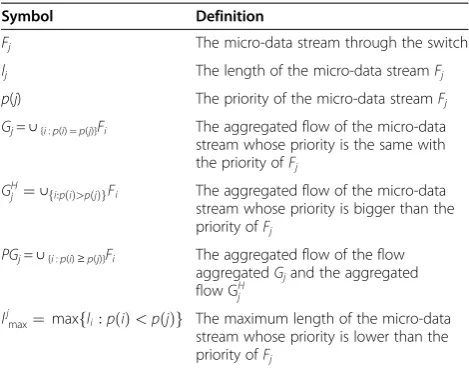
Table 1 The definitions of the symbols
Symbol Definition
Fj The micro-data stream through the switch
lj The length of the micro-data streamFj
p(j) The priority of the micro-data streamFj
Gj=∪{i:p(i) =p(j)}Fi The aggregated flow of the micro-data stream whose priority is the same with the priority ofFj
GjH¼∪fi:p ið Þ>p jð ÞgFi The aggregated flow of the micro-data
stream whose priority is bigger than the priority ofFj
PGj=∪{i:p(i)≥p(j)}Fi The aggregated flow of the flow aggregatedGjand the aggregated flow GHj
ljmax¼ maxfli:p ið Þ<p jð Þg The maximum length of the micro-data
stream whose priority is lower than the priority ofFj
Table 2 The exceeding rate of the BE data
BE data Number of receiving data
Number of exceeding data
Exceeding rate
100 bytes 62,134 2,993 4.817%
Table 3 The comparison results of the TT data with different sizes
100 2.36294 2.36294 2.363
150 3.53855 3.53855 3.54
200 4.72588 4.72588 4.73
250 5.90734 5.90734 5.91
300 7.0888 7.0888 7.1
Table 4 The comparison results of the RC data with different sizes
RC data (bytes) Average of simulation
value (×10−5s) Network calculus value
100 4.6571 8.466
150 7.263 1.27
200 1.0914 1.694
250 1.3643 2.13
guaranteed by the switch. Based on the above discus-sion, the BE data cannot be guaranteed, and it will be lost. From Figure 8a,b, the TT and RC data are well guaranteed, and there is no data exceeding the theory value. From Figure 8c, the best-effort data is not guaranteed, and it is only best effort. There are some data exceeding the theory value. Table 1 gives the ex-ceeding rate of the RC data. From the table, we know that the exceeding rate of the BE data is very small and meets our need when the size of the BE data is 100 bytes. Table 2 shows the exceeding rate of the BE data.
Figure 8 is the description of the receiving and sending rate of switch. The switch services three kinds of data with different sizes.
Tables 3, 4, and 5 are the comparison of the three kinds of data with different sizes. For TT data, it is firstly guaranteed, and it has the const delay value. With different size, the end-to-end delay of the TT data is also different. Generally, when the size is larger, the delay is longer. From Table 3, we know that the delay is longer with larger size. It meets well the actual theory. For the RC and BE data, the con-clusion is the same.
4.1.2.2 The comparison analysis of packet loss rate In
Section 4.1.2.1, we obtain the comparison results of the end-to-end delay of the three kinds of data. In the same circumstance, the comparison analysis of packet loss rate is as in Tables 6, 7, and 8.
In the Section 2.2, we assume that the service rate is not less than 0. When the size is up to 250 bytes, the TT and RC data are guaranteed, and the service rate of the BE data is up to 0. While, in the simulation model,
different types of data are sent in different time intervals. Thus, when the size of the BE data is up to 250 bytes, there are also BE data in the TTE Ethernet. If the size of the data is larger, the loss rate is higher. We can get good simulation results when we set the size at <200 bytes.
4.2 The cascaded topology
The cascaded topology which is different from the star topology is shown in Figure 6a. The topology is more complex than the star topology. The analysis results of the three kinds of data are shown in Figure 6b,c,d.
According to results from the comparison chart of the three types of data stream in the cascaded topology, we can get that the actual delay of the simulation statistical results fully meets the maximum network delay obtained by network calculus, and it also verifies that the TTE simulation results are reasonable. Then, we can verify that the TTE specification is feasible.
5. Conclusions
As a new real-time deterministic network, time-triggered Ethernet has not yet formed a standardized protocol specification and has no mature products for the market. This paper firstly uses network calculus and network simulation to analyze and study the TTE. We present a service-performance network calculus model, which is triggered by time, and obtain the upper deterministic boundary of the delay. With the TTE clock synchro-nization, redundancy fault-tolerant, multi-data commu-nication, node model and network model designed and implemented on the simulation platform, we analyze the performance of the TTE and compare the simulation re-sults with the theoretical values from the time-triggered
Table 5 The comparison results of the BE data with different sizes
BE data (bytes) Average of simulation value
Network calculus value
100 1.1335 × 10⁻⁴s 1.387 × 10⁻⁴s 150 1.5419 × 10⁻⁴s 2.084 × 10⁻⁴s
200 2.6 × 10⁻³s 2.783 × 10⁻⁴s
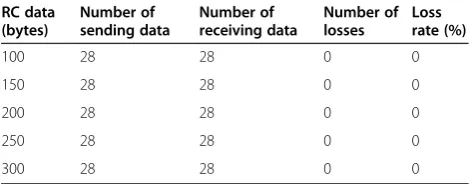
Table 6 The packet loss of the TT data
TT data
Table 7 The packet loss of the RC data
RC data
Table 8 The packet loss of the BE data
BE data
100 3,241 3,182 59 1.82
150 3,241 3,180 61 1.882
200 3,241 2,866 375 11.57
250 3,241 2,292 949 29.28
Ethernet network calculus. The final conclusion shows that TTE has good performance in terms of end-to-end delay and service rate, can be compatible with the tra-ditional Ethernet [11], and meets well the needs of real-time and safety-critical systems.
Competing interests
The authors declare that they have no competing interests.
Received: 18 September 2013 Accepted: 17 December 2013 Published: 19 January 2014
References
1. K Hermann, G Gunter, TTP—a protocol for fault-tolerant real-time systems. IEEE Computer27(1), 14–23 (1994)
2. R Maier, Event-triggered communication on top of time-triggered architecture. DASC21(2), 135–141 (2002)
3. W Steiner, M Paulitsch, H Kopetz,Multiple Failure Correction in the Time-Triggered Architecture(Technische Universitat Wien, Vienna, Real-Time Systems Group, 2003)
4. H Kopetz, Fault containment and error detection in the time-triggered architecture autonomous. Paper presented at the 6th international symposium on decentralized systems. Pisa, 9–11 April 2003 5. TTTech,TTEthernet Specification v.9.1-22968[Z] (D-INT-S-10002, 200.11.GE)
(TTTech Computertechnik AG, Vienna)
6. V Firoiu, JYL Boudec, D Towsley, Z-L Zhang, Theories and models for internet quality of service. Proc IEEE90(9), 1565–1591 (2002) 7. H Kopetz, A Ademaj, P Grillinger, K Steinhammer, The time-triggered
Ethernet (TTE) Design, inPaper presented at the8th IEEE international symposium on object-oriented real-time distributed computing (ISORC), ed. by (Seattle, Washington, 18–20 May2005)
8. RL Cruz, A calculus for network delay, part 1: network analysis. IEEE Trans. Info. Theory37(1), 132–141 (1991)
9. JYL Boudec, P Thiran,Network Calculus: A Theory of Deterministic Queuing System for the Internet(Springer, Germany, 2004)
10. Z Li,Research on time-triggered Ethernet based on deterministic network calculus(University of Electronic Science and Technology of China, Masters Degree Thesis, 2013)
11. D Heffernan, P Doyle, Time-triggered Ethernet based on IEEE 1588 clock synchronization. IEEE Trans. Computers24(3), 264–269 (2004)
doi:10.1186/1687-1499-2014-12
Cite this article as:Xianget al.:Performance research on time-triggered Ethernet based on network calculus.EURASIP Journal on Wireless Communications and Networking20142014:12.
Submit your manuscript to a
journal and benefi t from:
7Convenient online submission
7Rigorous peer review
7Immediate publication on acceptance
7Open access: articles freely available online
7High visibility within the fi eld
7Retaining the copyright to your article