©
DOI: 10.1534/genetics.104.035097
A Composite-Likelihood Approach for Detecting Directional Selection
From DNA Sequence Data
Lan Zhu and Carlos D. Bustamante
1Department of Biological Statistics and Computational Biology, Cornell University, Ithaca, New York 14853 Manuscript received August 17, 2004
Accepted for publication March 30, 2005
ABSTRACT
We present a novel composite-likelihood-ratio test (CLRT) for detecting genes and genomic regions that are subject to recurrent natural selection (either positive or negative). The method uses the likelihood functions ofHartlet al. (1994) for inference in a Wright-Fisher genic selection model and corrects for nonindependence among sites by application of coalescent simulations with recombination. Here, we (1) characterize the distribution of the CLRT statistic (⌳) as a function of the population recombination rate (R⫽4Ner); (2) explore the effects of bias in estimation ofRon the size (type I error) of the CLRT; (3) explore the robustness of the model to population growth, bottlenecks, and migration; (4) explore the power of the CLRT under varying levels of mutation, selection, and recombination; (5) explore the discriminatory power of the test in distinguishing negative selection from population growth; and (6) evaluate the performance of maximum composite-likelihood estimation (MCLE) of the selection coeffi-cient. We find that the test has excellent power to detect weak negative selection and moderate power to detect positive selection. Moreover, the test is quite robust to bias in the estimate of local recombination rate, but not to certain demographic scenarios such as population growth or a recent bottleneck. Last, we demonstrate that the MCLE of the selection parameter has little bias for weak negative selection and has downward bias for positively selected mutations.
T
HE evolutionary fate of a mutation is governed PRF approach also has the advantage of using all of theinformation in the SFS regarding natural selection as by genetic drift, demographic history, and natural
opposed to traditional summary statistics of the data selection acting directly on the mutation or indirectly
such asTajima’s (1989)Dand the methods ofFayand
through the effect of mutations at linked loci. A central
Wu(2000) andFuandLi(1993).
goal of population genetics is to quantify the role of
Unfortunately, since the PRF model assumes indepen-each of these factors in the evolution of particular loci in
dence among sites, the application of the LRT for most
particular populations (Lewontin1974). The Poisson
genetic data is quite limited unless the assumption of
random field (PRF) approach (Sawyer and Hartl
free recombination among sites can somehow be
re-1992;Hartl et al. 1994; Wakeley 2003; Williamson
laxed. One can imagine two potential solutions to the 2003,Williamsonet al. 2005) has proven quite useful in
problem: (a) explicitly modeling natural selection and estimating mutation and selection parameters in various
recombination to evaluate the true likelihood function population genetics settings when DNA mutations are
via the ancestral selection graph (Krone and
Neu-unlinked. The inference rationale behind the approach
hauser 1997; Neuhauser and Krone 1997; Slade
is that natural selection will alter the site-frequency
spec-2001), and (b) taking a “composite-likelihood” approach trum [SFS;i.e., the number of mutations at a frequency
by continuing to treat sites as independent and then 1 out ofn, 2 out ofn, . . . (n⫺1) out ofn, wherenis
correcting parameter estimates and critical values for the number of sequences sampled], making it possible
the LRT via simulation. From a statistical point of view, to estimate the strength of selection needed to explain
the former approach is more desirable, since the likeli-observed deviations from the neutral SFS expectations.
hood function contains all the information about natu-A likelihood-ratio test (LRT) derived from the PRF has
ral selection available in the data (e.g., distribution of shown to be quite powerful and maximum-likelihood
haplotypes, patterns of linkage disequilibrium). Unfor-estimation of mutation and selection parameters
per-tunately, full-likelihood inference is so computationally forms very well when the ancestral states of all mutations
costly as to be out of reach for practical sample sizes at
in the sample are known (Bustamanteet al.2001). The
single loci and certainly out of reach for genome-wide analyses. Composite likelihood has recently been used in population genetics to reduce the computational
1Corresponding author:Department of Biological Statistics and
Com-complexity of various inference problems, for example, putational Biology, 101 Biotechnology Bldg., Cornell University,
Ith-aca, NY 14853. E-mail: [email protected] estimating recombination rate (Hudson2001;
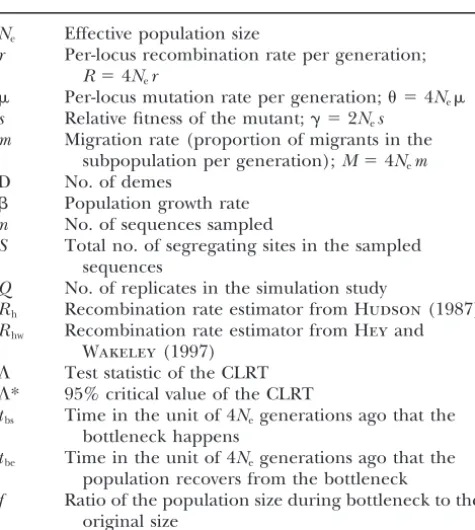
TABLE 1 test as the composite-likelihood-ratio test (CLRT) to distinguish it from the LRT designed for independent
Notations used
data and to signify that we arenotdealing with the true likelihood function of the data under recombination
Ne Effective population size
and selection, but rather an approximate likelihood
r Per-locus recombination rate per generation;
R⫽4Ner function. If the data come from a population with the
Per-locus mutation rate per generation; ⫽4Ne same demography we have used for our neutral simula-s Relative fitness of the mutant;␥ ⫽2Nes tions (e.g., a panmictic population of constant size) and m Migration rate (proportion of migrants in the
our estimate of the recombination rate is accurate, such
subpopulation per generation);M⫽4Nem
a test would be guaranteed not to reject neutrality more
D No. of demes
often then expected (namely, 100⫻ ␣% of the time).
 Population growth rate
A potential pitfall of all “tests of neutrality’’ is that
n No. of sequences sampled
S Total no. of segregating sites in the sampled there are several putative alternative hypotheses to the
sequences single null hypothesis of a neutrally evolving panmictic
Q No. of replicates in the simulation study population of constant size. In other words, certain de-Rh Recombination rate estimator fromHudson(1987) mographic scenarios affect the site-frequency spectrum Rhw Recombination rate estimator fromHeyand
in ways that may be indistinguishable from natural
selec-Wakeley(1997)
tion, leading to spurious rejection of the null hypothesis
⌳ Test statistic of the CLRT
of neutral evolution. For example, low levels of
migra-⌳* 95% critical value of the CLRT
tbs Time in the unit of 4Negenerations ago that the tion among subpopulations will elevate the proportion
bottleneck happens of observed high-frequency-derived mutations above
tbe Time in the unit of 4Negenerations ago that the their neutral expectation in a panmictic population much population recovers from the bottleneck
in the same way as positive selection (Nielsen2001; see
f Ratio of the population size during bottleneck to the
also Figure 1). Likewise, a sample of DNA sequences
original size
drawn from an exponentially growing population can look like a sample drawn from a population of constant size subject to weak negative selection (i.e., both
scenar-headandDonnelly 2002;McVeanet al. 2002;Wall ios lead to an excess of low-frequency variants vis-a`-vis
2004), variation in recombination rate (Li and Ste- neutrality). Therefore, it is imperative to investigate the
phens2003; McVeanet al. 2004), and detecting local robustness of our proposed CLRT to demographic
his-signature of hitchhiking (KimandStephan2002;Kim tory and population structure. This can be
accom-and Nielsen 2004; Innan andKim 2004). Therefore, plished via standard coalescent simulations with
recom-due to practical motivations, the latter approach is inves- bination (Hudson2002). In this article we consider a
tigated here, since the composite-likelihood solution for wide range of demographic scenarios, including
expo-a single locus cexpo-an eexpo-asily scexpo-ale to genome-wide levels nential population growth, an island model of
migra-and can be expmigra-anded to include increasingly realistic tion, and bottlenecks of varying severity. Likewise, it
demographic scenarios. is important to explore the power of the CLRT (the
In this article, we set out to investigate the perfor- probability of rejecting the null hypothesis when it is
mance of a composite-likelihood-ratio test for recurrent false) as well as the bias of the maximum
composite-directional selection under varying levels of selection, likelihood estimates (MCLE) of mutation rates and
mutation, and recombination while relaxing the as- strength of selection. We use a forward simulation
pro-sumption of independence among sites. The initial mo- gram with recombination and selection to address these
tivation for this project wasBustamanteet al.’s (2001) last two issues. We also investigate the discriminatory
result that the LRT proposed byHartlet al. (1994) is power of the CLRT to detect weak negative selection
not robust to deviations from the assumption of inde- when the null model is exponential growth instead of
pendence among sites (i.e., the test has a much higher a panmictic population of constant size.
type I error than expected). The basic idea behind our new test is that by modifying the critical value of the
MATERIALS AND METHODS
LRT statistics a proper test is constructed with desired size (type I error,␣). Specifically, one can correct the
Theory
critical value of the LRT statistic by applyingHartlet
To model the effects of natural selection on the
site-fre-al.’s (1994) test to a large number of simulated replicate
quency spectrum, several assumptions are made within the
neutral data sets generated conditional on S, the
ob-standard PRF models (SawyerandHartl1992;Hartlet al.
served number of segregating sites in the original data,
1994): (a) panmictic population of constant size, (b) weak
and Rˆ, an estimate of the population recombination selection with no dominance, (c) equal selective effects of all rate, and choosing a cutoff such that␣of the simulations nonlethal mutations, (d) free recombination among
segregat-ing sites, (e) infinite-sites mutation model, and (f) no epistatic
Figure1.—Comparison of expected site-frequency spectra for three scenarios. “Neu-tral” is the expected SFS under the standard neutral model (seeHudson1990). “Popu-lation structure” is the expected site-fre-quency spectrum for neutral mutations in a two-deme model with low symmetric mi-gration rate (4Nm ⫽ 0.2) found via 1000 coalescent simulations using ms (Hudson 2002). “Selection” is the expected SFS un-der genic selection for the model described byHartlet al. (1994). We use a value of 2Ns ⫽ 1.353, which maximizes the likeli-hood of the expected population structure data under the selected model. As one can see, the site-frequency spectrum under pop-ulation structure can look similar to that under recurrent positive selection.
effect among mutations.Wakeley(2003) has developed mod- et al.(1994) and investigated byBustamanteet al.(2001) for comparing these hypotheses is
els that relax assumption (a) by considering an infinite-demes population structure;Williamson et al. (2004) have
devel-⌳ ⫽(⫺2 logL(ˆw, 0|X))⫺(⫺2 logL(ˆ,␥ˆ|X)) oped PRF models with dominance, relaxing assumption (b);
andBustamanteet al.(2003) andSawyeret al.(2003) have
⫽2
冢
兺
n⫺1
i⫽1
xilogF(i,␥ˆ)⫺Slog
兺
n⫺1i⫽1
F(i,␥ˆ)⫹
兺
n⫺1
i⫽1 xilogi
modeled the effects of a distribution of selective effects among nonlethal mutations [relaxing assumption (c)]. The purpose
of this article is to relax assumption d for the purpose of ⫹Slog
兺
n⫺1
i⫽1
1/i
冣
, (2)inference.
LetX ⫽{X1,X2, . . . ,Xn⫺1} represent the site-frequency
whereˆwis the MLE of under the neutrality, which turns spectrum for a genomic region of interest such that Xk is
out to beEwens’(1974) andWatterson’s (1975) estimator the number of sites along the sequence that havekderived
of;ˆ and␥ˆ are the maximum-likelihood estimates ofand mutations andn⫺kancestral mutations, wherenis the
num-␥, respectively, under the full model with selection, found by ber of sampled sequences (throughout we assume the
direc-maximizing the profile log-likelihood function as described tionality of mutation is known). In their original article,
Saw-inBustamanteet al.(2001), andS⫽兺n⫺1
i⫽1xiis the observed
yerand Hartl (1992) model the site-frequency spectrum
number of segregating sites. Under the assumption of inde-as a collection of independent Poisson-distributed random
pendence among sites,⌳is asymptotically2
1-distributed ( Ken-variables, governed by the mutation parameter ⫽4Neand
dall1987). a selection parameter␥ ⫽2Nes, whereNeis the haploid
popula-It has been shown by simulation that if sites are not evolving tion size;sis the fitness effect of new mutations such that
wild-independently, the2
1-approximation is too liberal and the type fitness is 1, heterozygote fitness is 1⫹s, and homozygote
LRT will have an unacceptably high type I error (Bustamante fitness for the new mutation is 1 ⫹ 2s; and is the per
et al.2001). The reason for this is that the likelihood of the locus mutation rate for mutations with selective effects. It is
data in the presence of linkage is not simply the product of important to note that the site-frequency spectrum of selected
the likelihood across SNPs. That is, if sites are linked, Equation sites is sensitive to assumptions regarding dominance. The
1 is not the true-likelihood function of the data, but rather a PRF model proposed byWilliamsonet al.(2004) for analyzing
composite-likelihood function, and the LRT statistic no longer the site-frequency spectrum under dominance and selection
corresponds to a true likelihood-ratio test, but rather to a is also amenable to the type of modification we propose here.
CLRT. Under such a scenario the distribution of the test For simplicity and ease of computation, we consider only the
statistic is no longer2
1, but rather depends on the rate of genic selection case here. When ␥ ⫽ 0, the population is
recombination among sites. We must, therefore, use coales-evolving neutrally; when␥ ⬎0, it is under positive selection;
cent simulations with recombination to find the critical value and when␥ ⬍0, it is subject to negative selection. According
⌳* for the test statistic whenever we wish to analyze data with to the results ofSawyerandHartl(1992),Xkis a
Poisson-linkage among SNPs. While the LRT has been shown to have distributed random variable with meanF(k,␥), where
excellent power andˆ and␥ˆ have been shown to have little bias under the independence assumption (Bustamanteet al. F(k,␥)⫽
冮
1
0
冢
n k冣
pk(1⫺p)n⫺k 1⫺e⫺ 2␥(1⫺p)
(1⫺e⫺2␥)p(1⫺p)dp. 2001), nothing is known about the statistical properties of the CLRT or the composite maximum-likelihood estimates of and␥. The algorithm we employ for calculating the CLRT is Since under the model theXk’s are independent, the
likeli-as follows: hood functionL(,␥|X) is the product overP(Xk⫽xk|,␥),
namely Algorithm 1: Composite-likelihood-ratio test:
1. Given an observed site-frequency spectrum,XOBS, estimate L(,␥|X)⫽n
兿
⫺1k⫽1
e⫺F(k,␥)(F(k,␥))xk
xk!
. (1) ˆ and␥ˆ using the one-dimensional optimization described
inBustamanteet al. (2001), and calculate the CLRT statis-Our null hypothesis is that the population evolves neutrally, tic⌳OBSvia Equation 2.
H0:␥ ⫽0, while the alternative hypothesis is the complement, 2. GenerateQ replicate data setsX1, X2, . . . , XQ from a
sponding to the region of interest andS to the observed the CLRT statistic, we generated neutral data from a popula-tion of constant size for seven levels of recombinapopula-tion, R僆 number of segregating sites inXOBS. Apply the optimization
in step 1 to each of the replicate data sets and generate {0, 1, 5, 10, 50, 100, 1000}, usingHudson’s (2002) ms program. For each of three sample sizes (n⫽10, 50, 100), we simulated the replicate CLRT statistics⌳1,⌳2, . . . ,⌳Q.
3. The P-value for the CLRT corresponding to data XOBS is 1000 replicate data sets with a fixed number of segregation sites (S ⫽ 100) and constant recombination rate. For each estimated asP(⌳OBS|H0)⬇ (兺Qi⫽1I(⌳OBSⱕ ⌳i))/Q, where
I( ) is the indicator function that evaluates to 1 if the replicate, we apply the CLRT and retain the test statistic⌳. The distribution of the CLRT statistic and the trend that ⌳ argument is true and 0 otherwise.
varies greatly withRare plotted in Figures 2 and 3, respectively. To implement our proposed composite-likelihood method, In practice, the true recombination rate for sampled se-one needs an estimate of the local recombination rate. Given quences is unknown and must be estimated from data. We a data set, two main approaches have been employed for were interested in investigating the effect of estimation bias estimatingR. One method is based on observing the frequency in the recombination rate on the type I error of the CLRT. of sequence exchange between markers (Ashburner 1989; AsWall(2000) showed, there is no single best estimator of Trueet al. 1996;Bouffardet al. 1997;Nagarajaet al. 1997), Rand, in practice, most estimators do poorly ifRis close to 0. and the other method estimates Rfrom the patterns of se- Here we exploredHudson’s (1987) andHeyandWakeley’s quence variation expected in a random sample of DNA se- (1997) estimators since they tend to overestimate and underes-quences from a population (HudsonandKaplan1985;Hud- timateR, respectively, for a broad range of values. Since Hud-son 1987, 2001; Griffithsand Marjoram 1996; Hey and son’s estimator has low reliability if data sets are not very large Wakeley1997;Wakeley1997;Kuhneret al. 1999;McVean (Hudson1987), we simulated data with sample sizen⫽50 et al.2002;Wall2004). Since here we are interested in the and fixed segregating sites atS⫽100. The detailed algorithm local recombination rate, only the latter approach is applicable is as follows and the results of our analysis are summarized in since a fine-scale estimate requires hundreds of thousands of Figure 4.
meioses. Assuming a constant population size model and no
selection, Hudson (1987) proposed a method-of-moments Algorithm 2: Estimating realized type I error of CLRT when approach that transforms the observed variance in pairwise Ris estimated from data:
nucleotide differences into an estimate of the population
re-1. Generate neutral dataXOBSwith known recombination rate combination rate.HeyandWakeley(1997) derived a method
Rand apply the CLRT to obtain the test statistic⌳OBS. of estimating the recombination rate via coalescent theory
2. ForXOBSestimateRby Hudson’s and Hey and Wakeley’s based on considering multiple subsets of four sequences.
Sim-methods using SITES (HeyandWakeley1997) and de-ulation study (Wall 2000) shows that both Hudson’s (Rh)
note the estimatesRhandRhw. and Hey and Wakeley’s estimators (Rhw) perform well with
3. GenerateQ⫽1000 replicate data sets with the same sample large sample size (e.g.,n⫽50) and improve as the mutation
rate increases. However, comparing these two estimators with size and number of segregating sites as XOBS under the eight others,Wall(2000) demonstrated thatRhoverestimates estimated recombination rate,Rh. For each replicate, per-R(a large proportion ofRh/R⬎5.0); whileRhw underesti- form CLRT and keep test statistic⌳. The empirical (1⫺ matesR(with the majority ofRhw/R⬍0.2). In this article, we ␣) quantile of the distribution of⌳among the 1000 repli-explore these two estimators since they represent the extreme cates is the critical value of the test statistic⌳* at␣-level effects of over- and underestimating the local recombination (for all simulations we used␣ ⫽ 0.05). Similarly, we can rate and are computationally very fast. find⌳* with estimated recombination rateRhw.
4. If⌳OBS⬎ ⌳*, reject the neutral hypothesis; otherwise, fail to reject at the␣ ⫽0.05 level.
Simulations 5. Repeat steps 1–4 1000 times. The proportion of the false
rejection is the realized size of the CLRT under the PRF To explore the statistical properties of the CLRT as well model when the recombination rate is not known. as the MCLE of the selection and mutation parameters, we
simulated five different types of data (Hudson’s 2002 “ms” In the current model, we assume no population structure program was used for all coalescent simulations). The first to the data. We are interested in investigating how well the type of data is neutral from a population of constant size. CLRT performs when this assumption is violated. We simu-These data were used to explore how quickly the CLRT statistic lated the second type of data with sample size n⫽ 50 and ⌳ converges to a 2
1-distribution as a function of Rand to fixed number of segregating sites (S⫽ 100) ,R⫽0 under compare the effect of different estimators of recombination the island model forD僆{2, 5, 10, 20, 50} (Dis the number rates on the realized size of the test. The second, third, and of demes), and 0ⱕMⱕ15 (M⫽4N
em, wheremis the fraction fourth types of data were neutral data from (a) a single subpop- of each deme made up of new migrants each generation). The ulation in an island model, (b) a panmictic population that reason for fixing the number of segregating sites is that the had recently expanded in size, and (c) a panmictic population distribution of the number of segregating sites changes with that had undergone a single bottleneck. These data were used the migration rate if we fix the overall mutation rate of the to explore the effect of these demographic factors on the type entire population (Wakeley 2001). When we explore the I error of the test. The fifth type of data was generated by the effect of the migration rate on the size of the test, we want forwardinfinite-sitessimulation withselection andrecombi- to control for the effect that is caused by the difference in nation (FISHER) program written in ANSI C by L. Zhu. the number of segregating sites. The detailed procedure is as FISHER was used to generate polymorphism data with recur- follows and the results of this analysis are shown in Figure 5. rent selection and recombination under an infinite-sites
model assuming constant population size. We ran FISHER Algorithm 3: Procedure for estimating realized type I error of with 10Negenerations of burn-in and replicate data sets sam- CLRT in the presence of population structure/demographic pled every 2Negenerations. These data were used to explore history:
the power of the test under varying levels of mutation and
1. Generate Q ⫽ 10,000 data sets with S segregating sites selection, as well as recombination.
critical value of CLRT at the␣ ⫽0.05 level as the 9501st largest value and denote this quantity as⌳*.
2. Samplensequences withR⫽0 from a single deme out of Dpossible demes in the island model with migration for a given level ofM. Apply the CLRT and retain the observed test statistic,⌳OBS.
3. If⌳OBS⬎ ⌳*, reject the neutral hypothesis; otherwise, fail to reject at the␣ ⫽0.05 level.
4. Repeat steps 2 and 3 1000 times for each parameter combi-nation. The proportion of data sets that reject neutrality (i.e., number of data sets out of 1000 with⌳OBS⬎ ⌳*) is the realized type I error of the CLRT.
Another assumption of the PRF model that may be problem-atic is the assumption of constant population size. To explore the effects of exponential growth [i.e., the population size is given byN(t)⫽Neexp(⫺t), whereNeis the present popula-tion size,tis the time before present, measured in units of 4Negenerations, andis the growth rate], we modify step 2 of the above algorithm and generate data within ms for rates of growth 僆{0.1, 0.2, 0.4, 0.8, 1.6, 3.2} (Figure 6). For a
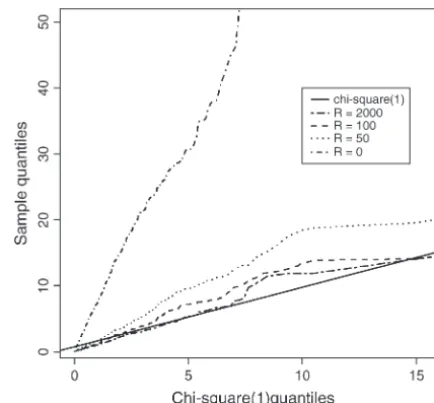
Figure 2.—Distribution of the test statistics (⌳) for the bottleneck, we simulate data forn僆 {10, 100} with various test assumingHartl et al.’s (1994) model as a function of recombination ratesR僆{0, 10, 100}, assuming the bottleneck population recombination rate (R). They-axis is quantiles of happened attbs⫽0.025 or 0.05 (in the unit of 4Negenerations) ⌳’s calculated by CLRT from sampled sequences, thex-axis before the current sampling time and recovered to the current is quantiles of data drawn from a2
1-distribution.⌳converges population size attbe⫽0.0125 (in the unit of 4Negenerations). to a2
1-distribution with largeR. One thousand replicates of We consider two levels of the population reduction during data sets were sampled from Hudson’s “ms” program, each the bottleneck,i.e.,f僆{0.1, 0.01} (Figures 7 and 8). with sample sizen⫽ 50, fixed number of segregating sites
Power simulations:To evaluate the power of the CLRT (i.e., S⫽100, and various levels of recombination rate. probability of rejecting a false null hypothesis of neutrality),
we wrote a forward simulation program, FISHER, to simulate a
genomic region under recurrent selection and recombination RESULTS AND DISCUSSION using an infinite-sites model of mutation assuming constant
population size. Power was estimated as the proportion of How quickly does the test statistic (⌳) converge to a replicates generated under selection for which the null hy- 2
1-distribution?From Figure 2, we confirm the theoreti-pothesis was rejected by the CLRT. The detailed algorithm is cal prediction that the composite-likelihood-ratio test as follows and results of the FISHER simulations can be found statistic⌳converges to a2
1-distribution as recombina-in Figures 9–11.
tion rate increases; unfortunately, the convergence rate is very slow. From Figure 3, we can see that the 95%
Algorithm 4: Procedure for estimating the power of the CLRT:
critical value of⌳(denoted as⌳*) does not attain the
1. Generate a data set ofnsequences via FISHER given muta- expected cutoff of2
1,0.95 ⫽3.84 under the independence tion rate, selection coefficient, and recombination rate;
model untilR ⬎1000 for all three levels of sample size
apply the CLRT to obtain the test statistic⌳OBSand
corre-considered (n⫽10, 50, 100). Were we to test the neutral
spondingP-value from algorithm 1.
hypothesis using the CLRT and assume ⌳ followed a
2. IfP⬍0.05, reject the neutral hypothesis; otherwise, fail to
reject at the␣ ⫽0.05 level. 2
1-distribution, the test would not attain the correct type 3. Repeat steps 1 and 2 500 times and calculate the power of I error until the rate of recombination was inordinately the test as the proportion of rejections. large. This result is consistent with that ofBustamante
et al. (2001) that the LRT is not robust to deviations
The power of the test above is based on estimating theP-value
from the assumption of independence among sites and
assuming a constant population size. Since population growth
may have an effect similar to negative selection, we examine highlights the need for developing a statistical method
how powerful the CLRT is in distinguishing negative selection that can deal effectively with linkage among sites.
from an exponentially growing population model. For these How does bias in estimation of the recombination simulations, the data sets were simulated via FISHER given
rate affect the realized size of the CLRT?We see from
the selection coefficient, mutation rate, and recombination
Figure 4 that the realized type I error of the CLRT
rate. The critical value of the CLRT was determined assuming
decreases with increasing recombination rate for both
the population has been growing exponentially, and
muta-tions were neutral. We sampled 50 sequences with mutation estimators studied. This is consistent with the fact that
parameter ⫽30, recombination rateR⫽100, and selection bothHeyandWakeley’s (1997) andHudson’s (1987) coefficient␥僆{⫺1,⫺5,⫺10}. We analyzed the power of the estimators improve asRincreases (Wall2000). In gen-CLRT in distinguishing negative selection from the
exponen-eral, using Rhto estimate the recombination rate will tial growth with growth rate僆{0.1, 0.2, 0.4, 0.8, 1.6, 3.2}.
result in larger type I error than usingRhw. From our To achieve this, we modify step 2 in algorithm 1 and simulate
study, forRⱕ15, Hey and Wakeley’s estimator performs
data under an exponential growth model. All other steps
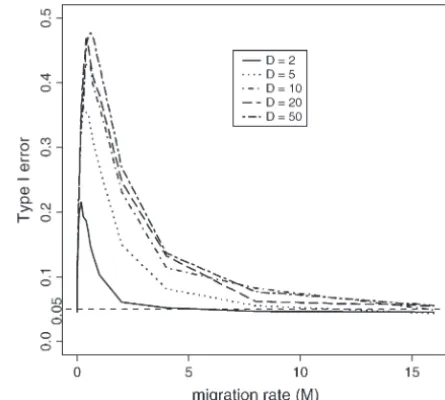
Figure3.—95% critical value of the test statistic (⌳*) con- Figure5.—Effect of the population structure on the size verges to 2
1,0.95⫽3.84 (plotted in log scale for both x- and of the CLRT. Data were drawn from the island model using y-axes). Data were drawn from Hudson’s “ms” program with Hudson’s “ms” program with given number of demes, D僆 sample sizen僆{ 10, 50, 100} and fixed segregating sitesS⫽ {2, 5, 10, 20, 50} withR⫽0.
100.
How does undetected migration affect the size of the
(0.05); for 15 ⱕ R ⱕ 125, Hudson’s method actually CLRT? Even if we had a “perfect” estimator of R, we
performs better than Hey and Wakely’s, and for R ⱖ might not attain a realized type I error of␣ ⫽0.05 due
125, both are overly conservative. Recalling that Rh is to other factors, such as population history. We see from
upwardly biased for low levels of R (Wall 2000), it Figure 5 that an island model of population subdivision
becomes clear that overestimating the recombination is such a scenario. For all levels of D examined, the
rate leads to a lower⌳* and hence an increased proba- observed pattern is very similar: the type I error of the
bility of rejecting the null hypothesis (and therefore CLRT is 0.05 atM⫽0; it then increases sharply for 0⬍
larger type I error). Consistent with this observation M⬍1 and then decreases slowly to 0.05 asMincreases
is that Rhw, which is downwardly biased, leads almost toward infinity. In a structured population withM⫽0,
uniformly to a very conservative CLRT. all subpopulations are completely isolated and within
each subpopulation, individuals undergo random mat-ing. Since sequences subject to the CLRT are all sampled from one subpopulation assumed to be at equilibrium, it is not surprising to see that the realized size of the CLRT for data withM⫽0 is at the proper level for all levels ofD.
Slightly increasing the migration rate will impact the site-frequency spectrum by reducing the relative propor-tion of low-frequency SNPs and increasing the relative proportion of high-frequency SNPs. This is due to the fact that ifMis “small but not too small,” a sample of DNA sequences from a single subpopulation will often contain a single migrant from another deme. This mi-grant will, more often than not, be involved in the last coalescent event of the genealogy, since the rate of migration is small relative to the rate of coalescent for
M ⬍ 1. This will cause an overrepresentation of gene
genealogies that are stretched near the root and com-pressed near the external nodes. The site frequency
Figure 4.—Effect of the bias of the recombination rate spectrum will, thus, look similar to what is expected estimator on the size of the CLRT. Data were drawn from
under positive selection, predicting an increase in the
Hudson’s “ms” program with sample size n⫽50 and fixed
type I error of the CLRT for neutrality.
segregating sitesS⫽100. Recombination rates were estimated
subpopula-that population growth causes an increase in the coales-cent rate as the process proceeds back in time, leading to star-like genealogies, which results in an excess of mutations in external branches (i.e., singletons or substi-tutions present in only one sampled sequence) (Tajima
1989;SlatkinandHudson1991). It is difficult to differ-entiate the site-frequency spectrum of population growth data from that under negative selection. The larger the population growth rate, the more singletons and hence the more likely it is to make false rejections. It is expected that recombination substantially affects the size of the CLRT, which is shown to be true in Figure
6. For small population growth rate ( ⬍ 0.1), CLRT
still performs very well with type I errorⱕ0.05, which means slight changes in the population size do not affect
the size of the CLRT. Williamson et al. (2005) have
recently developed a method that can jointly estimate
Figure 6.—Effect of the population size changes on the selection and population growth assuming indepen-size of the CLRT. Data were drawn from the population expo- dence among sites. For that model, one can also per-nentially growing model by Hudson’s “ms” program with
sam-form the CLRT, conditioning on the
maximum-likeli-ple sizen⫽50, fixed segregating sitesS⫽100, growth rate
hood estimate of the growth parameter from the rest
僆{0.1, 0.2, 0.4, 0.8, 1.6, 3.2}, and various levels of
recombina-tion rate. of the genome and an estimate of the local
recombina-tion rate to simulate the critical value of the test statistic for a given gene.
tion that originated in another deme increases linearly. How does a recent population bottleneck affect type
And asM tends toward infinity, the fixation indexF I error?Simulation study reveals that the effect of
popu-will tend to be zero [Fˆ⫽1/(1⫹4Nem), at equilibrium], lation bottlenecks on the patterns of SFS is very
compli-indicating no population structure. Hence a sample of
cated (Figure 7). Moderate bottlenecks (Figure 7A) re-DNA sequences randomly drawn from a subpopulation
sult in less low-frequency SNPs and more medium- and would be wholly representative of the entire population
high-frequency SNPs than under neutrality. Strong bot-and the CLRT should have type I error at the desired
tlenecks (Figure 7B) function in the opposite direction, level. Indeed, from our simulation study, whenMⱖ16,
namely, more rare SNPs than expected under the con-for a number of subpopulations⬍10, all tests we studied
stant population size model. The reason for this is that have type I errorⱕ0.05. For a large number of
subpopu-rate of coalescence increases during the bottleneck pe-lations (⬎10),Mshould be⬎32 to have proper size of
riod and depending on parameter values can look like the CLRT.
either positive or negative selection (Galtieret al. 2000). There are two possible ways to improve the CLRT
vis-For example, a recent weak bottleneck can lead to dis-a`-vispopulation structure. One is to modify the critical
proportionately longer internal branches as several
lin-value of the CLRT by estimatingM from neutral data
eages make it back into the ancestral population and and thus reducing the type I error by producing a more
thus contribute to high-frequency-derived mutations sophisticated null model. The second approach is to
that can look like positive selection. Alternatively, a very jointly estimate selection and migration coefficients
un-severe recent bottleneck will likely lead to the most der various population structure models. It is important
recent common ancestor event during the bottleneck to note that both fixes might also introduce systematic
period and thus to star-like external branches that may bias in the realized type I error due to bias in estimation
be difficult to distinguish from negative selection. As a of demographic parameters.
consequence, the type I error of the CLRT is quite high
How does recent population expansion affect the
in populations that have experienced a recent
bottle-type I error? Another important assumption in this
neck event (Figure 8). Increasing sample size and muta-model is the assumption of constant population size
tion rates leads to even higher type I error (results not over generations. This assumption does not hold for
shown). the vast majority of species that we would like to analyze
While it is clear that the CLRT is not robust to the for evidence of natural selection at the genetic level.
effects of a recent bottleneck, it may be possible to From Figure 6, we can say that CLRT is not robust
distinguish whether the rejection of the test is due to against the assumption of constant population size
al-natural selection or the effect of the recent population though it does not do badly for relative tight linkage
bottlenecks. One approach is to use a composite-like-with low population growth rate. The type I error
concor-Figure8.—Effect of recent population bottleneck on the size of the CLRT. f is the ratio of population size during bottleneck to the original size. The data sampling scheme is the same as that described in Figure 7.
evaluate a statistical test, we want not only to control the type I error, but also to assess the power [1⫺Pr(type II error)]. Our simulation results (Figure 9) suggest that the CLRT has relatively good power to detect negative selection and moderate power to detect positive selec-tion, if the population recombination rate is on the order of the mutation rate and there is moderately strong selection.
If natural selection is very weak (|␥| ⬍ 1) and sites are tightly linked, selection has little effect on the SFS and the CLRT and, thus, has little power. When selec-tion is strong and negative (␥ ⬍ ⫺5), the site-frequency spectrum is skewed toward rare alleles and the CLRT performs very well even for small sample size irrespective of the mutation or recombination rates. In detecting
weak positive selection (␥ ⬎5), the CLRT has medium
power for moderate levels of recombination relative to
mutation (R⬎5; ⫽30). We find that increasing the
sample size fromn⫽15 ton⫽50 will uniformly increase power (Figure 9). However, increasing the mutation
rate from ⫽ 30 to ⫽ 75, paradoxically, decreases
the power for detecting positive selection. The statistical reason for this is that the site-frequency spectrum of data with a high mutation rate and tightly linked sites
Figure7.—Site frequency spectrum of data from a single subject to weak positive selection is similar to the SFS population having undergone a recent bottleneck. Bottleneck from a neutral population (Figure 10). One biological occurred 0.1Negenerations ago, and it lasted 0.05Ne
genera-reason for this phenomenon is that increasing the
muta-tions. Sample size n ⫽10, with fixed segregating sites S ⫽
tion rate (or reducing the recombination rate) increases
100.fis the ratio of population size during bottleneck to the
original size.␣is the type I error of the CLRT. (A) Moderate interference among selected mutations and thus
re-bottleneck withf⫽0.1; (B) strong bottleneck withf⫽0.01. duces the overall efficacy of natural selection (
Robert-son 1961; Hill and Robertson 1966; Felsenstein
1974;ComeronandKreitman2002).
dance between the data and a selective model (Jensen Can the CLRT distinguish negative selection from the
et al.2005, accompanying article). Alternatively, the ge- effect of population growth?As we see from Figure 11,
nomic distribution of the CLRT statistic itself can be the CLRT does not have much power in distinguishing
used, since a bottleneck would uniformly increase the very weak negative selection (␥ ⫽ ⫺1) from exponential
proportion of loci across the genome that rejects neu- growth. However, for moderately strong negative
selec-trality. tion (␥ ⫽ ⫺5), the CLRT has very high power to
differ-entiate selection from exponential growth with growth
Figure9.—Power of the CLRT under varying levels of selec- Figure11.—Power of the CLRT in distinguishing negative tion. Thex-axis is the value of the selection parameter in the selection from the population exponentially growing model. PRF model under which the data were simulated. Data were simulated by the “FISHER” program under the assumption of constant population size with sample sizen⫽ 50, ⫽30,R⫽100 under the forward simulation model with
rate in the range of 0.1ⵑ3.2. This suggests the CLRT selection coefficient␥ ⫽ ⫺1,⫺5,⫺10, respectively. Thex-axis is the growth rate , the parameter of the data where the
maybe particularly useful for finding genes that may be
empirical distribution of the test statistics was obtained to get
subject to moderate negative selection.
the critical value for the test. Is the MCLE a good estimator of selection
coeffi-cients?If the assumption of independence among sites
is met, maximum-likelihood estimation of the selection rameter to the true selection coefficient as a function
and mutation rate parameters performs very well (Bus- of␥. We can see that for weak negative selection (␥⬇
tamanteet al. 2001). We are interested to know whether ⫺1), composite-maximum-likelihood estimation
per-the estimator is still reliable when we relax per-the assump- forms very well for all parameter combinations
consid-tion of independence among sites. In Figure 12, we ered. Both mutation and recombination affect the
accu-summarize the ratio of the MCLE of the selection pa- racy of estimation. The parameter is underestimated
with higher mutation rate or less recombination events. In general, the maximum-composite-likelihood
estima-Figure10.—Site-frequency spectrum under recurrent neg- Figure12.—␥ˆ/␥ for data drawn from forward simulation with the recombination model (by the “FISHER” program). ative selection, neutral, and positive selection with varying
levels of mutation and recombination rates. They-axis is the ␥ˆ is the maximum-likelihood estimator of the selection coeffi-cient, and␥is the true parameter value under which the data proportion of SNP sites that were found at frequencies 1/15,
tor does not deviate far away from the true parameter processes such as population shrinking, inbreeding, and a single selective sweep could also produce genealogies value under which the data were simulated for negative
selection with moderate mutation rate and have total that are consistent with some form of recurrent natural
selection. Functional information will ultimately be
recombination events⬎100 per generation.
The MCLE performs rather poorly in estimating the needed to sort the false from the true positives.
strength of positive selection in the presence of linkage We thank members of the Bustamante lab for discussion. We also with a large bias toward underestimation. The main thank Feng Feng for his kind assistance with the source code. The comments of two anonymous reviewers greatly improved the article. reason is likely to be reduction in the effectiveness of
This research was supported by National Science Foundation award selection because of interference among selected
muta-0319553 to M. Purugganan, S. McCouch, R. Nielsen, and C.D.B. as tions (seeComeronandKreitman2002). That is, even well as by a U.S. Department of Agriculture-Hatch grant (NY 151411)
if each mutation that enters the population has a selec- to C.D.B.
tive advantage of, say, Ns ⫽ 5, because there are few
chromosomes that lack positively selected mutations, there will be only small fitness difference among
chro-LITERATURE CITED
mosomes. As a result, mutations have a smaller realized
Ashburner, M., 1989 Drosophila: A Laboratory Manual.Cold Spring effect on the site-frequency spectrum than predicted
Harbor Laboratory Press, Cold Spring Harbor, NY.
under the independence assumption. Bouffard, G. G., J. R. Idol, V. V. Braden, L. M. Iyer, A. F.
Cunning-hamet al., 1997 A physical map of human chromosome 7: an
Conclusions:The composite-likelihood method
pre-integrated YAC contig map with average STS spacing of 79kb. sented here for inferring natural selection from DNA
Genome Res.7:673–692.
sequence data has reasonably good performance, in Bustamante, C. D., J. Wakeley, S. SawyerandD. L. Hartl, 2001
Directional selection and the site-frequency spectrum. Genetics terms of power and robustness. One advantage over
159:1779–1788.
previous PRF tests is proper control of type I error if
Bustamante, C. D., R. NielsenandD. L. Hartl, 2003 Maximum DNA sites are linked. As expected, the method used to likelihood and Bayesian methods for estimating the distribution of selective effects among classes of mutations using DNA poly-estimate the local recombination rate can have
pro-morphism data. Theor. Popul. Biol.63(2): 91–103.
found effects on the realized size of the test. We predict
Comeron, J. M., andM. Kreitman, 2002 Population, evolutionary this will be a general property of composite-likelihood and genomic consequences of interference selection. Genetics
161:389–410.
methods that aim to infer selection from standing
pat-Ewens, W. J., 1974 A note on the sampling theory for infinite alleles terns of genetic variation, and very little is known about
and infinite sites models. Theor. Popul. Biol.6:143–148.
the accuracy of methods for estimating recombination Fay, J. C., andC.-I Wu, 2000 Hitchhiking under positive Darwinian
selection. Genetics155:1405–1413.
in the presence of recurrent selection.
Fearnhead, P., andP. Donnelly, 2002 Approximate likelihood We also find that undetected population structure,
methods for estimating local recombination rates. J. R. Stat. Soc.
population growth, and/or bottlenecks can all inflate Ser.64:657–680.
Felsenstein, J., 1974 The evolutionary advantage of recombination. the realized type I error of the test above its nominal
Genetics78:737–756.
level. One possible solution is to explicitly model
selec-Fu, Y.-X., and W.-H.Li, 1993 Statistical tests of neutrality of
muta-tion and demography in future incarnamuta-tions of the tions. Genetics133:693–709.
Galtier, N., F. DepaulisandH. N. Barton, 2000 Detecting bottle-CLRT. In particular, by analyzing several unlinked loci
necks and selective sweeps from DNA sequence polymorphism. simultaneously one may be able to estimate common
Genetics155:981–987.
shared parameters (such as expansion rate or time since Griffiths, R., and P. Marjoram, 1996 Ancestral inference from samples of DNA sequences with recombination. J. Comp. Biol. bottleneck), while allowing for locus-specific selection
3:479–502.
parameters. Likewise, it is known that variation in
selec-Hartl, D. L., E. N. MoriyamaandS. A. Sawyer, 1994 Selection
tion among sites as well as dominance can have strong intensity for codon bias. Genetics138:227–234.
Hey, J., andJ. Wakeley, 1997 A coalescent estimator of the popula-effects on the SFS (Bustamanteet al. 2003;Williamson
tion recombination rate. Genetics145:833–846.
et al. 2004). We hope to incorporate these factors into
Hill, W. G., andA. Robertson, 1966 The effect of linkage on the
future versions of the test. limits to artificial selection. Genet. Res.8:269–294.
Hudson, R. R., 1987 Estimating the recombination parameter of a Our simulation study shows that the
composite-likeli-finite population model without selection. Genet. Res.50:245–
hood-ratio test has excellent power to detect negative
250.
selection and moderate power to detect positive selec- Hudson, R. R., 1990 Gene Genealogies and the Coalescent Process.Oxford University Press, Oxford.
tion. However, for weak selection |␥| ⬍ 1 and tight
Hudson, R. R., 2001 Two-locus sampling distributions and their
linkageR⬍5, the method does not perform well,
pre-application. Genetics159:1805–1817.
sumably due to interference selection. We have also Hudson, R. R., 2002 Generating samples under a Wright-Fisher
neutral model. Bioinformatics18:337–338.
shown that mutation rate and recombination rate
pro-Hudson, R. R., andN. L. Kaplan, 1985 Statistical properties of the foundly influence the power of the CLRT.
number of recombination events in the history of a sample of
It should be pointed out that a significant result of DNA sequences. Genetics111:147–164.
Innan, H., andY. Kim, 2004 Pattern of polymorphism after strong the CRLT (as with all tests of neutrality) should be
artificial selection in a domestication event. Proc. Natl. Acad. Sci. interpreted cautiously since there are several putative
USA101(29): 10667–10672.
alternative hypotheses to a single null hypothesis. In- Jensen, J. D., Y. Kim, V. Bauer-DuMonth, C. F. AquadroandC. D.
and demography using DNA polymorphism data. Genetics170: 2003 Bayesian analysis suggests that most amino acid replace-ments in Drosophila are driven by positive selection. J. Mol. Evol. 1401–1410.
57:S154–S164.
Kendall, M., 1987 Kendall’s Advanced Theory of Statistics.Oxford
Uni-Slade, P. F., 2001 Simulation of ‘hitch-hiking’ genealogies. J. Math. versity Press, Oxford.
Biol.42(1): 41–70.
Kim, Y., andR. Nielsen, 2004 Linkage disequilibrium as a signature
Slatkin, M., andR. R. Hudson, 1991 Pairwise comparisons of
mito-of selective sweeps. Genetics167:1513–1524.
chondrial DNA sequences in stable and exponentially growing
Kim, Y., andW. Stephan, 2002 Detecting a local signature of genetic
populations. Genetics129:555–562.
hitchhiking along a recombining chromosome. Genetics 160:
Tajima, F., 1989 Statistical method for testing the neutral mutation 765–777.
hypothesis by DNA polymorphism. Genetics123:585–595.
Krone, S. M., andC. Neuhauser, 1997 Ancestral processes with
True, J. R., J. M. MercerandC. C. Laurie, 1996 Differences in
selection. Theor. Popul. Biol.51:210–237.
crossover frequency and distribution among three sibling species
Kuhner, M. K., J. YamatoandJ. Felsenstein, 1999 RECOMBINE,
of Drosophila. Genetics142:507–523.
Version 1.0 (http://evolution.genetics.washington.edu/lamarc.
Wakeley, J., 1997 Using the variance of pairwise differences to esti-html).
mate the recombination rate. Genet. Res.69:45–48.
Lewontin, R. C., 1974 The Genetic Basis of Evolutionary Change.
Co-Wakeley, J., 2001 The coalescent in an island model with variation lumbia University Press, New York.
among demes. Theor. Popul. Biol.59:133–144.
Li, N., andM. Stephens, 2003 Modeling linkage disequilibrium
Wakeley, J., 2003 Polymorphism and divergence for island-model and identifying recombination hotspots using single-nucleotide
species. Genetics163:411–420.
polymorphism data. Genetics165:2213–2233.
Wall, J. D., 2000 A comparison of estimators of the population
McVean, G., P. AwadallaandP. Fearnhead, 2002 A
coalescent-recombination rate. Mol. Biol. Evol.17:156–163.
based method for detecting and estimating recombination from
Wall, J. D., 2004 Estimating recombination rates using three-site
gene sequences. Genetics160:1231–1241.
likelihoods. Genetics167:1461–1473.
McVean, G., S. R. Myers, S. Hunt, P. Deloukas, D. R. Bentleyet al.,
Watterson, G. A., 1975 On the number of segregating sites in
2004 The fine-scale structure of recombination rate variation in
genetic models without recombination. Theor. Popul. Biol.7:
the human genome. Science304(5670): 581–584. 256–276.
Nagaraja, R., S. Macmillan, J. Kere, C. Jones, S. Griffinet al., 1997 Williamson, S., 2003 Adaptation in the env gene of HIV-1 and
X chromosome map at 75-kb STS resolution, revealing extremes evolutionary theories of disease progression. Biol. Evol. Mol. Biol.
of recombination and GC content. Genome Res.7:210–222. Evol.20:1318–1325.
Neuhauser, C., andS. M. Krone, 1997 The genealogy of samples Williamson, S., A. F. AlonandC. D. Bustamante, 2004 Population
in models with selection. Genetics145:519–534. genetics of polymorphism and divergence for diploid selection
Nielsen, R., 2001 Statistical tests of selective neutrality in the age models with arbitrary dominance. Genetics168:463–475.
of genomics. Heredity86:641–647. Williamson, S., R. Hernandez, A. F. Alon, L. Zhu, R. Nielsenet
Robertson, A., 1961 Inbreeding in artificial selection programmes. al., 2005 Simultaneous inference of selection and population
Genet. Res.2:189–194. growth from patterns of variation in the human genome. Proc.
Sawyer, S. A., andD. L. Hartl, 1992 Population genetics of poly- Natl. Acad. Sci. USA102(22): 7882–7887.
morphism and divergence. Genetics132:1161–1176.