Meta data driven Big Data Analytics
Big Data Solution for Data Mining and Warehousing
Dr. Murugan A , Ganesan S
Associate Professor, PG & Research Dept. of Computer Science, Dr. Ambedkar Govt. Arts College
Chennai, India
Research Scholar, PG & Research Dept. of Computer Science, Dr. Ambedkar Govt. Arts College,
Chennai, India
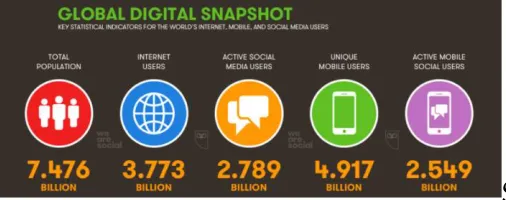
ABSTRACT: World statistical indicators prove analytics value of 3.7 billion internet users, 4.9 billion unique mobile users, and 2.8 billion active social media users. Denominator is with 7.4 billion world population data. In turn, the amount of business data has grown steadily every year in digital formats. In essence, collecting many diverse types of data very quickly does not create value. This paper is on need of analytics to uncover insights that will help the business.
Big data analysis is a continuum, not an isolated set of activities. There are five key approaches to analyzing big data and generating insight. They are Discovery tools, BI tools, In-Database Analytics, Pre-processing Hadoop and Decision Management. This powerful analytic environment offers a tremendous range of capabilities of security, scalability, and performance. It includes data mining tools to create complex models and deploy them on very large data sets. The results of these predictive models leveraged within Business Intelligence (BI) applications. Big Data Analytics has four levels namely Descriptive, Diagnostic, Predictive and Prescriptive. They show the value difference with the degree of human input, auto decision and action. Our work is related to drive Big Data analytic by meta-data design. It is an extension of our earlier research on Meta Data Driven Enterprise Data Hub.
KEYWORDS: Big Data, Analytic, Mining, Predictive, Meta data, Prescriptive.
I. INTRODUCTION
ISSN(Online): 2319-8753 ISSN (Print): 2347-6710
I
nternational
J
ournal of
I
nnovative
R
esearch in
S
cience,
E
ngineering and
T
echnology
(A High Impact Factor, Monthly, Peer Reviewed Journal)
Visit: www.ijirset.com
Vol. 7, Issue 4, April 2018
World statistical indicators prove analytics value of 3.7 billion internet users, 4.9 billion unique mobile users, and 2.8 billion active social media users. Denominator is with 7.4 billion world population data. In turn, the amount of business data has grown steadily every year in digital formats. In essence, collecting many diverse types of data very quickly does not create value.
This paper is on need of analytics to uncover insights that will help the business.
II. PROBLEM STATEMENT
In current social computing enabled industry, data production, movement and growth rate are outstanding. In spite of larger data set, the biggest business pain point is to rely on veracity of the available data store.
Fig. 2. Data movement in a minute
It is astounding to learn the data movement of 16 million text messages [4], 4 million video views [4], and 156 million emails within just a minute [4]. Beyond the business, process, people, etc. Information Technology department faces the key challenge to leverage the value of this humongous digital data. Technically, it is expected to co relate and predict the data movement, at a bare minimum.
III. PROPOSED SOLUTION
Fig. 3. Reference Architecture of EDH
From the above-proposed EDH solution, the golden single source data is persisted using Meta data driven process. The single source data contains the business characteristics of trustable, cleansed, usable, etc. With high degree of veracity in data store, target state of perfect prediction is possible.
In traditional reporting model, the output is specific and structured. By using the technical advantage of Big Data, the next generation report is built in adhoc and predictable mode. The biggest advantage is to produce the proactive indications, prior to the actual happenings.
IV. KEY APPROACHES
Big data analysis is a continuum, not an isolated set of activities. There are multiple approaches used in the space of big data to generate the business insight [3]. This powerful analytic environment offers a tremendous range of capabilities of security, scalability, and performance.
There are five key approaches to analyzing big data and generating insight:
1) Discovery Tools
2) BI Tools
3) In database analytics
4) Hadoop
5) Decision Management
In computer system, few Discovery tools are available to explore/infer the information in rapid, intuitive mode from any type of structured and unstructured sources of the industry. In our paper, this layer is so important to extract the valid data for the next stat of business intelligence systems. In real world of Big Data, the end user does not provide the up-front modeling. It is up to the user to build new insights, which makes the meaningful conclusions for the business. As the result, it makes the right business decisions quickly.
ISSN(Online): 2319-8753 ISSN (Print): 2347-6710
I
nternational
J
ournal of
I
nnovative
R
esearch in
S
cience,
E
ngineering and
T
echnology
(A High Impact Factor, Monthly, Peer Reviewed Journal)
Visit: www.ijirset.com
Vol. 7, Issue 4, April 2018
computing advantage of memory process than the disk based. Eventually, it accelerates the information cycle times and reduces total cost of system.
In the emerging big data industry, Hadoop is the core engine to perform the pre-processing data to identity macro trends or find nuggets of information, such as out of range values [2]. The processing is not based on the traditional high cost mainframe computers. Instead, Hadoop [2] eco system leverages the inexpensive commodity servers to unlock the potential business value from the humongous enterprise data.
In the olden days, computer system produced the decision reports in reactive way. It means the activity reports and the implication results generated based on the past event data. Now, the industry is reversed and it is expected to produce the instantons decision management on proactive mode, prior to the predicted event occurs. It is possible using the predictive modeling, business rules, and self-learning to take informed action based on the current context. Big Data Analytic integrates to operationalize complex predictive analytic models and create real-time decision processes. The report is distributed across multiple delivery channels, which maximize the value of every customer to boost the business value.
All of these approaches have a role to play uncovering hidden relationships. In this paper, we mainly focus on the integrated use of Hadoop and In-Database Analytics to process and analyze a vast field of new data.
It includes data mining tools to create complex models and deploy them on very large data sets. The results of these predictive models leveraged within BI applications of the enterprise.
In fact, Big Data analytic is completely different from Business Intelligence approach [8]. To illustrate the value of this statement, five key differential factors are listed against Traditional BI and emerging Big Data Analytic applications in the business world.
# Differential
factor Traditional BI
Big Data Analytic
1 Work load Repetitive Experimental in adhoc mode
2 Sources Operational
Operation along with external system
3 Volume Giga Bytes to low Terra Bytes
Terra Bytes to Peta Bytes
4 Variety Structured Semi to unstructured
5 Reporting
mode Re active Pro active
Fig. 4. Analytic Characterstics on Past, Present and Future mode
On extending the analytic characteristics, the state of the reports are categorized in three tenses, namely past, present and future. In Past mode, the metallurgical department shares the natural calamity data in the simple dashboard format. The cause of the event, is extracted using Data mining technology. In Present world, real time analytic is popular to tweet few minutes delayed update for the common person. In Future mode, predictive analytic will play the key role to share the likely happening of the calamity damages in advance. Predictive analysis helps the human beings to prepare themselves towards the preventive prescription.
All of the above listed details are quite interesting concepts to leverage Big Data technology to serve up to the common people in the society. Our paper is related to execute the underlying framework using the dynamic factor of metadata in an enterprise application.
V. ROLEOFMETADATA
In simple term, Metadata is data, which provides information about other data [10]. The core features of modern software packages are metadata-driven. All of social media content comes with metadata—information about the item’s creation, name, topic, features, and the like. Metadata is key to the functionality of the systems holding the content, enabling users to find items of interest, record essential information about them, and share that information with others.
In fact, Metadata is considered as core element of social media platforms [11]. As an example, Facebook users create metadata on managing friend lists, posting statuses or adding descriptions to media, liking/re-sharing posted content, etc. By tracking these social activities, Facebook analyzes trending topics and promotes sponsored posts that generate revenue. Metadata supports digital-object management by providing the information needed to render digital content appropriately or deliver the appropriate version to match a user need.
#
Types of Meta Data
Meta data type
Example
properties Primary Uses
1 Descriptive Title
Author name Subject name Publication info
Discovery Display Interoperability
2 Structural Sequence
Place of hierarchy Navigation
3 Technical
File type File size
Creation date/time
ISSN(Online): 2319-8753 ISSN (Print): 2347-6710
I
nternational
J
ournal of
I
nnovative
R
esearch in
S
cience,
E
ngineering and
T
echnology
(A High Impact Factor, Monthly, Peer Reviewed Journal)
Visit: www.ijirset.com
Vol. 7, Issue 4, April 2018
#
Types of Meta Data
Meta data type
Example
properties Primary Uses
management
5 Mark up
Heading Paragraph List Date Name
Navigation Interoperability
b. Industry classification of meta data
In this paper, EDH is completely driven by metadata. Metadata also enforces the definition of business terms to business end-users. In spite of few advantages of metadata, it also has its challenges. In terms of usage to manage EDH solution, metadata has to be correctly defined initially. In addition, it is identified that there are no industry-wide accepted standards.
VI. LEVEL OF BIG DATA ANALYTICS
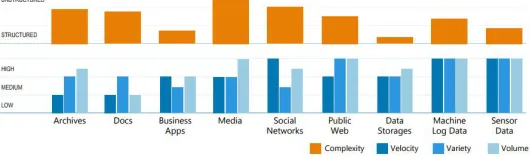
Big data is characterized by three primary factors: volume (too much data to handle easily); velocity (the speed of data flowing in and out makes it difficult to analyze); and variety (the range and type of data sources are too great to assimilate). With the right analytics, big data can deliver richer insight since it draws from multiple sources and transactions to uncover hidden patterns and relationships. :
Fig. 5. Big Data Analytic Levels
Let us evaluate the details of big data analytic levels wit
Big data can be applied to real-time fraud detection, complex competitive analysis, call center optimization, consumer sentiment analysis, intelligent traffic management, and to manage smart power grids, to name only a few applications.
Big Data analytic is broadly categorized into four types as listed below:
Let us evaluate the details of big data analytic levels with the appropriate illustration.
Descriptive – Key theme is ‘what happened?’ This model reports the past historical data to show the value of data points. The result of the analysis is often as business status scorecard.
Diagnostic – Key theme is ‘why did it happen?’ This model looks at past historical data to determine the cause of the data points. The result of the analysis is often an analytic dashboard.
Predictive – Key theme is ‘what will happen?’ It is futuristic analytical report in which the deliverables are usually a predictive forecast. The result is based on the pattern or practices of the historical data along with few external environment factors.
Prescriptive – Key theme is ‘what should I do?’ This type of analysis reveals what actions should be taken. This is the most valuable kind of analysis and usually results in rules and recommendations for next steps.
A. Descriptive
Descriptive analytics or data mining are at the bottom of the big data business value. As its theme ‘what happened‘, explains it assess the business insight based on the historical events/data points. A simple example will illustrate the business value precisely. In general, Meteorology department records the daily temperature of a city (say Chennai, India). Based on the previous day records, it is possible to generate various reports for weekly, monthly, annual weather report of Chennai city. It is termed as Descriptive weather report of a city.
Descriptive analytics can be useful in the weather report cycle, for example, to categorize the city by their likely period and location.
B. Diagnostic
Diagnostic analytic theme ‘why did it happen’, discovers to determine why something happened. In our example, Meteorology department use descriptive analytics to assess the number of city, location, temperature, wind, air pollution, moisture, etc. There can be thousands of online weather reports and prediction to distill into a single view to see what worked in your past days. However, Meteorology department’s diagnostic analysis is truth table with all possible parameters to explain why it happened.
C. Predictive
Predictive analytic focuses on what will happen theme. It uses big data to identify past patterns to predict the future. In our example, Meteorological department leverages these types of analytical process using predictive analytics for weather lead scoring. Properly tuned predictive analytics can be used to support all weather types of complex forecasts across the various cities.
D. Prescriptive
Prescriptive analytic theme ‘what should I do’ is valuable, but largely not used. Where big data analytics in general sheds light on a subject, prescriptive analytics gives you a laser-like focus to answer specific questions. As an example, Meteorological department can perform better by using prescriptive analytics to measure the weather parameters of cities, then add various filters like temperature, humidity, wind speed & direction, rain fall, solar radiation, etc. It determines to focus weather protection process for every citizen. The similar prescriptive model can be applied to almost any industry target group or problem.
ISSN(Online): 2319-8753 ISSN (Print): 2347-6710
I
nternational
J
ournal of
I
nnovative
R
esearch in
S
cience,
E
ngineering and
T
echnology
(A High Impact Factor, Monthly, Peer Reviewed Journal)
Visit: www.ijirset.com
Vol. 7, Issue 4, April 2018
VII.RELATED WORK
This section of the paper describes the details of our research work implementation.
A. Physical Design
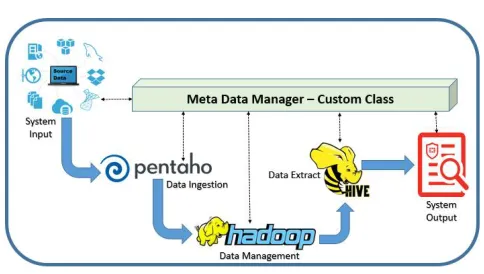
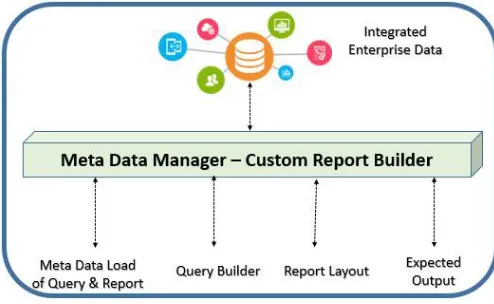
Input of our work, is fed from our previous research work on Enterprise Data Hub’s output. This paper is developed using Meta Data Manager for custom report building process with four key stages as defined below:
Fig. 7. Our research on meta data driven report
Technical workflow of this proposed design illustrates our paper work. Source of data ingests from Enterprise Data Hub; it is considered as the cleansed single source of truth data [1]. Our research work is to build Custom Report Builder with meta data manager. On technical process, it loads the information about the query building & report generation capabilities. After readiness with the technical flow using meta data, the reporting query has been built dynamically. On execution of this run time generated query string, the framework executes the instructions. In the meantime, report layout is constructed dynamically with the selected meta data. In conjunction, the output is mapped into dynamic report layout to finalize the expected output.
With this design and framework, our work enables to construct the big data analytical report with dynamic meta data design.
VIII.CONCLUSION AND FUTURE WORK
Ultimately, this paper helps the industry to generate the advanced big data analytical reports, for the business benefits. This paper is specialized on building the custom meta data manager to drive the complete operation.
As the next step, custom meta data manager can be fine-tuned with in-memory management architecture. It will help to improvise the solution with better system performance for an enterprise.
REFERENCES
[1] Paul A.Harris, Robert Taylor, Robert Thielke, Jonathon Payne, Nathaniel Gonzalez & Jose G.Condee, "Research electronic data capture (REDCap)—A metadata-driven methodology and workflow process for providing translational research informatics support", Journal of Biomedical Informatics Volume 42 Issue 2 Pages 377-381, April 2009.
[2] Tom White, “Hadoop: The Definitive Guide”, O'Reilly Media, Inc., 3rd Edition, May 2012.
[5] Thusoo A, Sarma J, Jain S, Shao N, Chakka Z, Anthony P, Liu S and Wyckoff H, “A warehousing solution over a Map-Reduce framework in VLDB”, 2009.
[6] Claypool, K. T., J. Jin, E. A. Rundensteiner, "SERF:Schema Evolution through an Extensible, Re-usable and Flexible Framework.", CIKM 1998, 314-321.
[7] O. V. Dolomanov, L. J. Bourhis, R. J. Gildea, J. A. K. Howard and H. Puschmann, "OLEX2: a complete structure solution, refinement and analysis program", Journal of Applied Crystallography 339-341, 2009.
[8] Chawathe, Sudarshan S. and Hector Garcia-Molina "Meaningful Change Detection in Structured Data",SIGMOD 1997, 26-37. [9] Ronald J. Dovich, Peter J. Eppele, "Metadata-driven data presentation module for database system", US6308168B1, February 1999
[10] Yan, Ling-Ling, Renée J. Miller, Laura M. Haas, Ronald Fagin, "Data-Driven Understanding and Refinement of Schema Mappings", SIGMOD 2001.
[11] Steven Shea MD William DuMouchel PhD & Lisa Bahamonde BA, "A Meta-analysis of 16 Randomized Controlled Trials to Evaluate Computer-Based Clinical Reminder Systems for Preventive Care in the Ambulatory Settin", Journal of the American Medical Informatics Association Volume 3 Issue 6 Pages 399–409, November 1996.