ISSN(Online) : 2319-8753 ISSN (Print) : 2347-6710
International Journal of Innovative Research in Science,
Engineering and Technology
(An ISO 3297: 2007 Certified Organization)
Vol. 5, Issue 4, April 2016
Doehlert 4-Variable Design for the
Optimization of Lead Biosorption Using
Activated Carbon Derived From Palm Kernel
Cake
S. Silas1, D.Sailaja2, G.H.Rao3
Lecturer, Department of Biotechnology, GITAM Institute of Technology, GITAM University, Gandhinagar,
Visakhapatnam, Andhra Pradesh, India
Professor, Department of Biotechnology, GRIET, Nizampet Road, Bachupally, Kukatpally, Hyderabad Telangana,
India
Professor, Department of Chemical Engineering & Biotechnology, ANITS, Sangivalasa, Visakhapatnamt, Andhra
Pradesh, India
ABSTRACT: The aim of the present investigation was to study the effects of four different process parameters such as initial lead concentration (10 to 30 mg L-1), pH (3.5 to 6.5), dosage concentration (10 to 50 g L-1) and temperature (20 0
C to 40 0C) using activated carbon derived from Palm kernel cake as the adsorbent for the removal of hazardous lead metal from aqueous solution. Doehlert Design of Response Surface Methodology was employed to model the biosorption process by a second order quadratic model. Optimization of the response surface model predicted a 91.80% maximum removal of lead at the optimum process conditions of initial lead concentration: 21 mg L-1, pH: 4.6, adsorbent dosage: 26 g L-1 and temperature: 32 0C. The validation experiment carried out at the optimum process conditions confirmed the predicted values. The results demonstrated the potential use of activated carbon of palm kernel cake as a novel adsorbent for the optimal removal of lead using 4-variable Doehlert design.
KEYWORDS: Doehlert design; response surface methodology; biosorption, activated carbon; palm kernel cake.
I. INTRODUCTION
Public sensitivity to the presence of heavy metals in aquatic bodies is of great concern since they cannot be decayed or treated biologically. Further the unavailability of inexpensive technologies of waste water is an all time challenge to industrialists and environmentalists. Lead is discharged into natural waters from a wide range of industries such as storage batteries, tetra ethyl lead manufacturing, lead smelting, mining, plating, ammunition and the ceramic glass industries [1].
The permissible amount of lead in potable water is 0.05mgL-1 [2]. Health disorders such as anemia, encephalopathy and hepatitis are caused due to the presence of excess lead in potable water. At times lead ions get immobilized for years and the metabolic disorders caused due to their presence cannot be identified [3]. Some commonly used techniques to eliminate heavy metal pollution include precipitation, ultra filtration, electrode deposition, cementation, ion-exchange, selected solvent extraction, activated carbon adsorption and biological processes. Adsorption is most often used for treatment of waste water containing heavy metals in view of its ease.
ISSN(Online) : 2319-8753 ISSN (Print) : 2347-6710
International Journal of Innovative Research in Science,
Engineering and Technology
(An ISO 3297: 2007 Certified Organization)
Vol. 5, Issue 4, April 2016
simplicity of design [4]. Activated carbon due to its high surface area, micro porous character and surface chemistry has been proven to be an effective adsorbent for the removal of heavy metals from industrial waste water [5]. Despite its frequent use in the water and waste industries, activated carbon remains an expensive material [6]. In view of the high cost of activated carbon, a lot of research has been directed to the development of low-cost activated carbon from cheap and readily available materials. Among the low-cost raw materials are the agro-forestry and agro-industrial residues. A wide variety of carbons have been prepared from agricultural wastes such as olive seeds, rice husks, walnut shells, palm shells, hazelnut shells, almond shells, pistachio nut shells and apricot stone [7-12]. Each of the carbons has characteristic properties and variation exists in the efficiency of removal of a range of heavy metal ions from solution. There is a constant need to investigate the potential of various raw materials as activated carbon precursors, depending on their costs and availability. Because of their wide usage in industry, the demand of the activated carbon is increasing year by year. Commercial activated carbon is quite expensive. As such, the industry now seeks for the cheaper activated carbon derived from agriculture waste or residues. The residues can be oil seed cakes, rice husk, sawdust or other carbonaceous material. The aim of the present research is to study the efficiency of activated carbon made from palm kernel cake (PKC) to optimally remove lead using 4-variable Doehlert experimental design.
After screening of the key parameters, the conventional technique for optimization is the “one factor at a time” method in which a single parameter is varied while fixing all others at a specific level. This method ignores the interaction among the process variables and might lead to unreliable results and conclusions, while requiring a large number of experiments. The disadvantage of single parameter optimization process can be eliminated by optimizing all the parameters collectively using statistically planned experimental design like Doehlert [13] which is based on the strategy of Response Surface Methodology (RSM). The optimization process based on RSM involves three major steps: 1) conducting the statistically designed experiment,
2) fitting the experimental data with quadratic model and determining the corresponding coefficients, and 3) predicting the response and checking the adequacy of the model. These techniques were used by many researchers for process optimization [14-16]. The present study reports the application of Doehlert experimental design to optimize the biosorption of lead using activated carbon obtained from Palm Kernel Cake (PKC) (Elaeis guineensis).
II. EXPERIMENTAL PROCEDURES
2.1. Preparation of Activated carbon
In this work activated carbon was prepared from PKC. The cake was collected from the local palm oil distillery unit of Vizianagaram district in Andhra Pradesh, India. The cake was washed, sundried and heated in the oven for 12 hours at 55 0C. The Carbonization process was accomplished in a muffle furnace. A known amount of PKC was introduced into the furnace which was heated to the desired temperatures of 800 K for 2hr. The charcoal was then soaked in a 25% concentrated solution of CaCl2, the gases that are formed due to exothermic reaction are allowed to escape for the first 3 min. and then covered with a lid for 24 hours. The sample is shifted to a drain tray where it is allowed to drain for 30 minutes and repeated washed with distilled water to remove traces of chemical. The washed sample is now placed in an oven for 2 hours at 110˚C. The chemically activated carbon of PKC is then cooled and
sealed in polythene bags to keep away from moisture and dust for further use.
2.2 Preparation of metal solution
Analytical reagent (AR) grade of chemicals were used for analysis. Appropriate amount of Pb (NO3)2 salts were dissolved in distilled water to prepare a stock solution of lead. The test solutions of lead ions were prepared by appropriate dilution of stock solution. The concentrations of lead ions varied between 10 and 200 mgL-1. Before adding the adsorbent, the pH of each test solution was adjusted to the required value with 0.1 M NaOH or 0.1 M HCl.
2.3 Doehlert experimental design of response surface methodology (RSM)
ISSN(Online) : 2319-8753 ISSN (Print) : 2347-6710
International Journal of Innovative Research in Science,
Engineering and Technology
(An ISO 3297: 2007 Certified Organization)
Vol. 5, Issue 4, April 2016
y (response) = f(x, β) (model) + ε(error) (Eq.1)
The surface represented by f(x, β) is called a response surface. The response can be represented graphically, either in the three-dimensional space or as two-dimensional contour plots that help visualize the shape of the response surface. In RSM, a quadratic model is used to relate the vector of scaled independent variables (x), with the data of dependent variable (y). The unknown coefficients (β) are estimated by multiple regression. For the case of 4-variable process, the response is given by the equation:
y = β0 + β1 x1 + β 2 x2 + β 3 x3 + β 4 x4 +β12 x1 x2 + β13 x1x3 + β14 x1x4 + β23 x2x3 + β24x2x4 + β34 x3x4 + β11 x12 + β22 x22 + β33
x32 + β44 x42 + ε (Eq.2)
where, y is the measured response, and ε is the random experimental that is assumed to follow normal probability distribution with constant experimental variance. The random error is estimated in the form of residual which is the difference between the observed and predicted values of y. The square terms, (x12, x22, x32, x42), account for the curvature of the response. The maximum response will be obtained when all the four coefficients (β11, β22, β33, β44) are negative. They are all positive for the case of a minimum surface. The optimum value (stationary point) will be found by solving the derivatives of Eq.2 with respect to the four independent variables after equating them with zero values.
δy/δx1 = δy/δx2 = δy/δx3 = δy/δx4 = 0 (Eq.3)
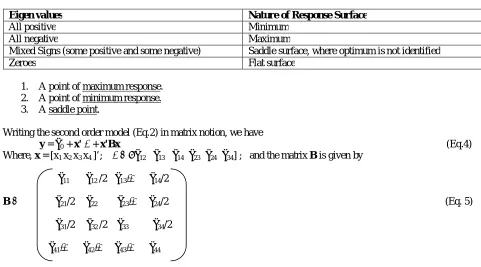
The solution at this point, i.e., x1s, x2s, x3s, x4s, is called stationary point. This stationary point might represent any one of the following situations which also depends on sign of the Eigen values of matrix, B, as mentioned in Table 1:
Table 1: Eigen Values vs. Nature of response surface
Eigen values Nature of Response Surface
All positive Minimum
All negative Maximum
Mixed Signs (some positive and some negative) Saddle surface, where optimum is not identified
Zeroes Flat surface
1. A point of maximum response.
2. A point of minimum response.
3. A saddle point.
Writing the second order model (Eq.2) in matrix notion, we have
y = β0 + x'β + x'Bx (Eq.4)
Where, x = [x1 x2 x3 x4 ]’; β = [ β12 β13 β14 β23 β24 β34] ; and the matrix B is given by
β11 β12 /2 β13/2 β14/2
B = β21/2 β22 β23/2 β24/2 (Eq. 5)
β31/2 β32 /2 β33 β34/2
β41/2 β42/2 β43/2 β44
The matrix B is a (4 4) symmetric matrix whose main diagonal elements are the pure quadratic coefficients (βij), rest being the halves of interaction coefficients. The derivative of y w.r.t. elements of vector x when equated to 0 is given by
δy/δx = β + 2 Bx = 0 (Eq.6)
The stationary point is the solution to the above equation, or
ISSN(Online) : 2319-8753 ISSN (Print) : 2347-6710
International Journal of Innovative Research in Science,
Engineering and Technology
(An ISO 3297: 2007 Certified Organization)
Vol. 5, Issue 4, April 2016
Furthermore, by substituting the above equation (7) in equation (4) we can find the predicted response at stationary point as:
ys = β0 + 0.5 xsβ (Eq.8)
The percentage removal of metal by biosorption is represented as the response (dependent variable) and given by the relation:
y = 100(Co - Cf)/ Co (Eq.9)
where, Co is the initial concentration, Cf is the final concentration.
The natural variables, Xi, are associated with the scaled variables, xi, by the relation
Xi = Xmid,i + (Xmax,i – Xmid,i) * xi/xmax,i (Eq.10)
Where, the middle and maximum values for scaled and natural variables are listed in Table 2.
Table 2: Experimental range and levels of the variables
Variables Range and Levels
Coded Variable1(x1) -1 -0.5 0 0.5 1
Initial metal cocn.(X1) 10 15 20 25 30
Coded Variable2 (x2) -0.866 -0.577 -0.289 0 0.289 0.577 0.866
pH (X2) 3.5 4.0 4.5 5.0 5.5 6.0 6.5
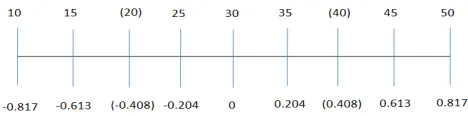
Coded Variable3(x3) -0.817 -0.613 -0.204 0 0.204 0.613 0.817
Dosage (X3) 10 15 25 30 35 45 50
Coded Variable4 (x4) -0.791 0 0.791
Temperature (X4) 20 30 40
It is to be noted that the levels for the third variable are not uniformly distributed in the specified range. The coded values and corresponding natural values are doubled between 2nd and 3rd levels and similarly between 5th and 6th levels as shown below. Hence the values mentioned within the brackets are not included in the design as far as 3rd variable is concerned.
ISSN(Online) : 2319-8753 ISSN (Print) : 2347-6710
International Journal of Innovative Research in Science,
Engineering and Technology
(An ISO 3297: 2007 Certified Organization)
Vol. 5, Issue 4, April 2016
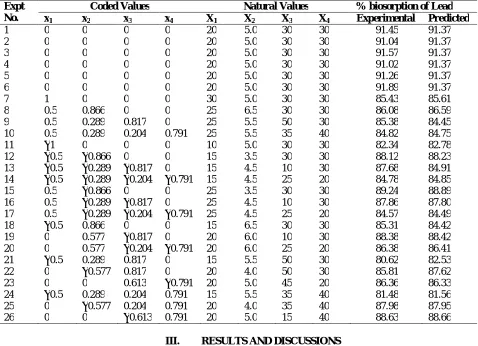
Table 3: Doehlert 4-variable experimental design along with experimental and predicted values
Expt No.
Coded Values Natural Values % biosorption of Lead
x1 x2 x3 x4 X1 X2 X3 X4 Experimental Predicted
1 0 0 0 0 20 5.0 30 30 91.45 91.37
2 0 0 0 0 20 5.0 30 30 91.04 91.37
3 0 0 0 0 20 5.0 30 30 91.57 91.37
4 0 0 0 0 20 5.0 30 30 91.02 91.37
5 0 0 0 0 20 5.0 30 30 91.26 91.37
6 0 0 0 0 20 5.0 30 30 91.89 91.37
7 1 0 0 0 30 5.0 30 30 85.43 85.61
8 0.5 0.866 0 0 25 6.5 30 30 86.08 86.59
9 0.5 0.289 0.817 0 25 5.5 50 30 85.38 84.45
10 0.5 0.289 0.204 0.791 25 5.5 35 40 84.82 84.75
11 −1 0 0 0 10 5.0 30 30 82.34 82.78
12 −0.5 −0.866 0 0 15 3.5 30 30 88.12 88.23
13 −0.5 −0.289 −0.817 0 15 4.5 10 30 87.68 84.91
14 −0.5 −0.289 −0.204 −0.791 15 4.5 25 20 84.78 84.85
15 0.5 −0.866 0 0 25 3.5 30 30 89.24 88.89
16 0.5 −0.289 −0.817 0 25 4.5 10 30 87.86 87.80
17 0.5 −0.289 −0.204 −0.791 25 4.5 25 20 84.57 84.49
18 −0.5 0.866 0 0 15 6.5 30 30 85.31 84.42
19 0 0.577 −0.817 0 20 6.0 10 30 88.38 88.42
20 0 0.577 −0.204 −0.791 20 6.0 25 20 86.38 86.41
21 −0.5 0.289 0.817 0 15 5.5 50 30 80.62 82.53
22 0 −0.577 0.817 0 20 4.0 50 30 85.81 87.62
23 0 0 0.613 −0.791 20 5.0 45 20 86.36 86.33
24 −0.5 0.289 0.204 0.791 15 5.5 35 40 81.48 81.56
25 0 −0.577 0.204 0.791 20 4.0 35 40 87.98 87.95
26 0 0 −0.613 0.791 20 5.0 15 40 88.63 88.66
III. RESULTS AND DISCUSSIONS
3.1 Optimization of biosorption using Doehlert Design
The selection of the range for process variables is extremely important when planning the experimental design; otherwise, after completion of the experimental runs, the optimal conditions, obtained by response surface methodology, might not be found within the experimental region. From the results of preliminary experimental runs, the four variables (initial lead concentration, pH, biosorbent dosage and temperature) were identified as the potential variables for the percentage biosorption of lead. Out of them, pH and biosorbent dosage showed stronger effect on percentage biosorption of lead, and hence they were assigned seven levels, followed by initial lead concentration which was assigned five levels and temperature was assigned three levels. A summary of the independent variables and their range and levels is presented in Table 2.
Twenty six experimental runs (Table 3) including three replicates at the center point were carried out for 60 minutes of contact time. By using the ‘regstats’ MATLAB program, Eq.2 was fitted with the observed data of Table 3 and the resulting model with the estimated coefficients is given by the following equation.
y = 91.3715 – 1.4162 x1 – 1.7635 x2 – 1.7303 x3 + 0.1296 x4+ 0.8666 x1 x2– 0.3127 x1 x3+ 1.8467x1x4 – 2.3391 x2 x3–
2.7818 x2x4 – 3.7064 x3x4 – 7.1782 x12 – 3.3913 x22 – 4.9808 x32 –6.0766 x42 Eq. (11)
ISSN(Online) : 2319-8753 ISSN (Print) : 2347-6710
International Journal of Innovative Research in Science,
Engineering and Technology
(An ISO 3297: 2007 Certified Organization)
Vol. 5, Issue 4, April 2016
estimated coefficients yielded the optimal settings for coded variables as x1: 0.097146, x2= -0.24553, x3= -0.16172, x4= 0.13094 that predicted a maximum 91.80% removal of lead. In terms of natural variables, they are found to be:
Initial lead concentration = 21 mg L−1 pH = 4.6 Biosorbent dosage = 26 g L−1
Temperature = 32 0C % maximum biosorption of Lead by PKC = 91.80%
When a validation experiment was carried out at the values of optimum process variables, a 92.96 % biosorption of lead was observed which is very close to the maximum predicted by Eq.11. Moreover, the observed value is well within the 95% intervals as shown in Table 4.
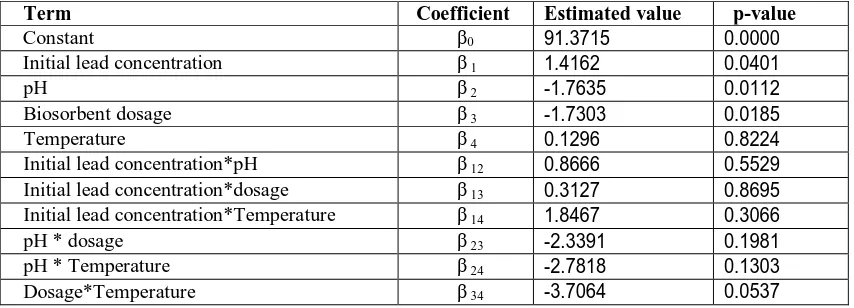
Table 4: Model coefficients estimated by multiple linear regression
Term Coefficient Estimated value p-value
Constant β0 91.3715 0.0000
Initial lead concentration β 1 1.4162 0.0401
pH β 2 -1.7635 0.0112
Biosorbent dosage β 3 -1.7303 0.0185
Temperature β 4 0.1296 0.8224
Initial lead concentration*pH β 12 0.8666 0.5529
Initial lead concentration*dosage β 13 0.3127 0.8695
Initial lead concentration*Temperature β 14 1.8467 0.3066
pH * dosage β 23 -2.3391 0.1981
pH * Temperature β 24 -2.7818 0.1303
Dosage*Temperature β 34 -3.7064 0.0537
The Confidence interval explains how much variation could be possible with a certain model. The uncertainty in the specific estimate is reflected by prediction interval, and logically the error is greater than the confidence interval. Unlike confidence interval, prediction interval predicts the spread for ‘individual’ observation, rather than the mean value.
Eigen values of the matrix B (from Eq.5) are found to be: -8.7254; -6.6625; -3.5552, -2.6838. As all the Eigen values are negative, the response surface for biosorption of lead represents a unique maximum.
The significance of each coefficient in Eq. (11) was determined by student’s t-test and p-values, which are listed in Table 5. Usually, the coefficients with p-values < 0.05 are included in the fitted equation. A model is said to be hierarchical if the presence of higher-order terms (such as interaction and second-order terms) requires the inclusion of all lower-order terms contained within those of higher order. Many regression model builders believe that hierarchy is a reasonable model building practice when fitting polynomials. So in this model all the terms are included using the hierarchical principal, even though values of ‘p’ for certain coefficients are high. However, the deletion of such terms would not affect the optimality of Eq.11.
Table 5 ANOVA for the entire quadratic model
Source of variation
Sum of squares (SS
Degree of freedom (d.f.)
Mean squares
(MS) F-value Probe>F
Model 229.7473 14.0000 16.4105 10.3212 0.0002
Error 17.4897 11.0000 1.5900
Total 247.2370 25.0000
ISSN(Online) : 2319-8753 ISSN (Print) : 2347-6710
International Journal of Innovative Research in Science,
Engineering and Technology
(An ISO 3297: 2007 Certified Organization)
Vol. 5, Issue 4, April 2016
Pmodel >F=0.0002
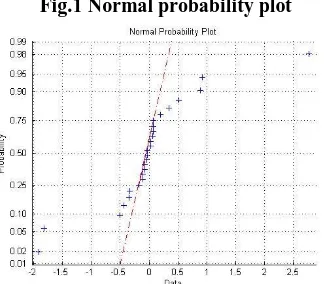
3.2 Normal Probability Plot:
A normal probability plot (Fig.1) is a useful graph for assessing whether data relating to Eq.11 comes from a Normal distribution. Regression of RSM model makes the assumption that the underlying distribution of the data is Normal. The plot provides some assurance that the assumption of Normality is not being violated, and may provide an early warning of a problem with the assumptions. If all the data points fall near the line, the assumption of Normality is reasonable. But, if the data is non Normal, the plus signs may follow a curve. As the points in Fig.3 lie on the line, it is presumed that the observed response data points of Table 3 follow Normal distribution.
Fig.1 Normal probability plot
3.3 Residual Plot:
Residuals are estimates of experimental error obtained by subtracting the observed responses from the predicted responses. Examination of residuals is a key part of all statistical modeling. Careful observation of residuals would give the information whether the assumptions made for Eqs.1&2 are reasonable and the choice of model is appropriate. Residuals can be thought of as elements of variation unexplained by the fitted model. It is evident from the Fig. 2 that the residuals are scattered randomly above and below the zero line without any significant trend. Hence it is assumed that the residues are randomly distributed with a constant variance.
ISSN(Online) : 2319-8753 ISSN (Print) : 2347-6710
International Journal of Innovative Research in Science,
Engineering and Technology
(An ISO 3297: 2007 Certified Organization)
Vol. 5, Issue 4, April 2016
3.4 Perturbation Plot:
This plot depicts the result of individual parameters on the percentage removal of Lead. The plot does not show any interaction effects among the parameters, but it is similar to the behavior of a process where experiment is carried out by varying one parameter at a time. The plot assists in comparing the result of all the parameters at an exact point in the design space. The outcome is estimated from Eq.11 by changing a particular scaled variable in its entire range while keeping the others at their optimum levels. The curve for a variable indicates that the response is sensitive even to a small change in particular variable in the specified range; where as a straight line indicates that the particular variable is not critical in affecting the process. The perturbation plot (Fig.3) is a useful aid in visualizing the effect of each variable graphically. From the figure it is evident that each of the process variables has its individual effect on the biosorption process. However, pH had more pronounced effect on metal removal. Keeping the levels of initial metal concentration and dosage of PKC at a fixed value, a change in pH would drastically affect the metal uptake. The curves of other two variables almost coincide in the entire range and hence their influence is equally appreciable in affecting the metal uptake.
Fig.3 Perturbation plot of lead removal at the optimal conditions of pH, lead concentration, biosorbent dosage and temperature
The goodness of fit of the response surface model can be examined by the determination coefficient (R2). The model predicts the response efficiently when the R2 value is closer to 1. The value of the determination coefficient (R2=0. 92926) indicates that 92.92% of the variability in the response could be explained by the model.
ISSN(Online) : 2319-8753 ISSN (Print) : 2347-6710
International Journal of Innovative Research in Science,
Engineering and Technology
(An ISO 3297: 2007 Certified Organization)
Vol. 5, Issue 4, April 2016
Fig.4A. Response surface and contour plot of Initial lead concentration vs. pH on percentage biosorption of lead
Fig.4B depicts the effects of initial metal concentration and biosorbent dosage on the percentage biosorption of lead. It is observed that the increase of biosorbent dosage from 20 to 45 g L-1, metal concentration (in the range 12 to 24) influenced the biosorption of lead
Fig. 4B. Response surface and contour plot of Adsorbent dosage vs. Initial lead concentration on percentage biosorption of lead
ISSN(Online) : 2319-8753 ISSN (Print) : 2347-6710
International Journal of Innovative Research in Science,
Engineering and Technology
(An ISO 3297: 2007 Certified Organization)
Vol. 5, Issue 4, April 2016
Fig. 4C. Response surface and contour plot of Initial lead concentration vs. Temperature on percentage biosorption of lead.
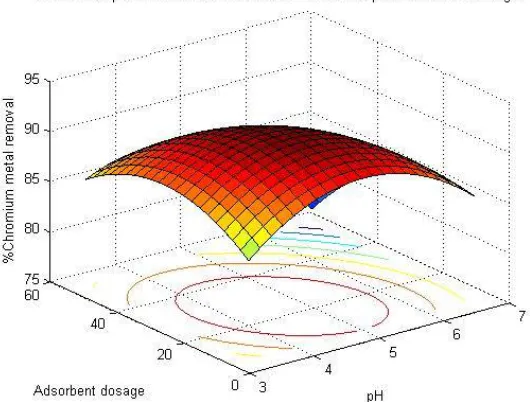
The interaction affect of pH (in the range 2 to 6) and adsorbent dosage (in the range 2 to 42) can be seen in Fig. 4D
Fig. 4D. Response surface and contour plot of Adsorbent dosage vs. pH on percentage biosorption of lead
Surface and contour plots showing the interaction effect between pH (in the range of 4 to 6) and temperature (in the range 15 to 35) are portrayed in Fig.4E
ISSN(Online) : 2319-8753 ISSN (Print) : 2347-6710
International Journal of Innovative Research in Science,
Engineering and Technology
(An ISO 3297: 2007 Certified Organization)
Vol. 5, Issue 4, April 2016
The effect of temperature in the range of 20 to 35, and adsorbent dosage in the range of 20 to 45 on biosorption is depicted in Fig 4F
Fig.4F. Response surface and contour plot of Temperature vs. Adsorbent dosage on percentage biosorption of lead
IV. CONCLUSION
ISSN(Online) : 2319-8753 ISSN (Print) : 2347-6710
International Journal of Innovative Research in Science,
Engineering and Technology
(An ISO 3297: 2007 Certified Organization)
Vol. 5, Issue 4, April 2016
activated carbon derived from Palm Kernel Cake was an efficient biosorbent for lead ion in dilute solutions. Maximum removal of lead (91.8%) was observed at the initial metal concentration: 21 mg L−1, pH: 4.6, adsorbent dosage: 26 g L−1 and temperature : 320C. When a validation experiment was carried out at the optimum process conditions, the observed maximum percentage removal of lead was found to be closer to that of the predicted maximum. The results confirmed the utility of activated carbon derived from PKC as a potential adsorbent for the effective removal of lead from aqueous solution using Doehlert 4-variable design involving a minimum experimental effort of 26 runs.
REFERENCES
[1] Volesky, B.: Detoxification of metal-bearing effluents: biosorption for the next century. Hydrometallurgy, 59, 203 – 216, 2001.
[2] Zhang, K.; Cheung, W.H.; Valix, M.: Roles of physical and chemical properties of activated carbon in the adsorption of lead ions. Chemosphere, 60, 1129 – 1140, 2005.
[3] Clarkson, T.W.; Friberg, L.; Nordberg, G.F.; Sager, P.R.: Kluwer Academic Publishers, New York, 1998.
[4] Ahmad, A.A.; Hameed, B.H.; Aziz, N.: Adsorption of direct dye on palm ash: kinetic and equilibrium modeling. Journal of Hazardous Materials, 141, 70-76, 2007.
[5] Avelar, F.F.; Bianchi, M.L.; Goncalves, M.; Gaspa, E.D.M.: The use of piassava fibers (Attalea funifera) in the preparation of activated carbon. Bioresour. Technol., 101, 4639 – 4656, 2010.
[6] Farooq, U.; Kozinski, J.A.; Khan, M.A.; Athar, M.: Biosorption of heavy metal ions using wheat based biosorbents – A review of the recent literature. Bioresour. Technol., 101, 5043-5053, 2010.
[7] Zabhi, M.; Ali Haghighi, Asl.; Ahmadpour, A.: Studies on adsorption of mercury from aqueous solution on activated carbons prepared from walnut shell. Journal of Hazardous Materials, 174, 251-256, 2010.
[8] Ye, H.; Zhu, Q.; Du, D.: Adsorptive removal of Cd(II) from aqueous solution using natural and modified rice husk. Bioresour. Technol., 101, 5175-5179, 2010.
[9] Ozcimen, D.; Erosy-Mericboyu, A.: Removal of copper from aqueous solutions by adsorption onto chestnut shell and grapeseed activated carbons. Journal of Hazardous Materials, 168, 1118-1125, 2009.
[10] Owlad, M.; Aroua, M.K.; Wan Daud, W.M.A.: Hexavalent chromium adsorption on impregnated palm shell activated carbon with polyethyleneimine. Bioresour. Technol., 101, 5098-5103, 2010.
[11] Kazemipour, M.; Ansari, M.; Tajrobehkar, S.; Majdzadeh, M.; Kermani, H.R.: Removal of lead, cadmium, zinc, and copper from industrial wastewater by carbon developed from walnut, hazelnut, almond, pistachio shell, and apricot stone. Journal of Hazardous Materials, 150, 322-327, 2008.
[12] Kula, I.; Ugurlu, M.; Karaoglu, H.; Celik, A.: Adsorption of Cd(II) ions from aqueous solutions using activated carbon prepared from olive stone by ZnCl2 activation. Bioresour. Technol. 99, 492-501, 2008.
[13] Doehlert, D.H.: Uniform shell designs. Appl Stat., 19, 231-239, 1970.
[14] Vanot, G.; Valérie, D.; Guilhem, M.C.; Phan-Tan-Luu, R.; Comeau, L.C.: Maximizing production of Penicillium cyclopium partial acylglycerol lipase. Appl Microbial Biotechnol., , 60, 417-419, 2002.
[15]Dutra, R.L.; Maltez, H.F. ; Carasek, E. : Development of an on-line preconcentration system for zinc determination in biological samples. Talanta, 69, 488-493, 2006.
[16] Imandi, S.B.; Bandaru, V.V.R.; Somalanka, S.R.; Garapati, H.R.: Optimization of medium constituents for the production of citric acid from byproduct glycerol using Doehlert experimental design. Enzyme Microbial Technol., 40, 1367-1372, 2007.