ABSTRACT
YU, XUNWEI. Power and Energy Management Strategy for Solid State Transformer Interfaced DC Microgrid. (Under the direction of Dr. Alex Q. Huang.)
As a result of more and more applications of renewable energy into our ordinary life, how to
construct a microgrid (MG) based on the distributed renewable energy resources and energy
storages, and then to supply a reliable and flexible power to the conventional power system
are the hottest topics nowadays. Comparing to the AC microgrid (AC MG), DC microgrid
(DC MG) gets more attentions, because it has its own advantages, such as high efficiency,
easy to integrate the DC energy sources and energy storages, and so on. Furthermore, the
interaction between DC MG system and the distribution system is also an important and
practical issue. In Future Renewable Electric Energy Delivery and Management Systems
Center (FREEDM), the Solid State Transformer (SST) is built, which can transform the
distribution system to the low AC and DC system directly (usually home application level).
Thus, the SST gives a new promising solution for low voltage level MG to interface the
distribution level system instead of the traditional transformer. So a SST interfaced DC MG
is proposed. However, it also brings new challenges in the design and control fields for this
system because the system gets more complicated, which includes distributed energy sources
and storages, load, and SST.
The purpose of this dissertation is to design a reliable and flexible SST interfaced DC MG
based on the renewable energy sources and energy storages, which can operate in islanding
mode and SST-enabled mode. Dual Half Bridge (DHB) is selected as the topology for
DC/DC converter in DC MG. The DHB operation procedure and average model are
distributed energy management strategy for the DC MG operating in the SST-enabled mode.
In this method, the system is not only in distributed control to increase the system reliability,
but the power sharing between DC MG and SST, State of Charge (SOC) for battery, are both
considered in the system energy management strategy. Then the DC MG output power is
controllable and the battery is autonomous charged and discharged based on its SOC and
system information without communication. The system operation modes are defined,
analyzed and the simulation results verify the strategy. The second power and energy
management strategy is the hierarchical control. In this control strategy, three-layer control
structure is presented and defined. The first layer is the primary control for the DC MG in
islanding mode, which is to guarantee the DC MG system power balance without
communication to increase the system reliability. The second control layer is to implement
the seamless switch for DC MG system from islanding mode to SST-enabled mode. The
third control layer is the tertiary control for the system energy management and the
communication is also involved. The tertiary layer not only controls the whole DC MG
output power, but also manages battery module charge and discharge statuses based on its
SOC. The simulation and experimental results verify the methods.
Some practical issues for the SST interfaced DC MG are also investigated. Power unbalance
The experimental results verify that individual module can plug into and unplug from the DC
MG randomly without affecting the system stability. Furthermore, the communication ports
are embedded into the system and a universal communication protocol is proposed to
implement the plug and play function. Specified ID is defined for individual PV and battery
for system recognition. A database is built to store the whole system date for visual display,
© Copyright 2014 Xunwei Yu
Power and Energy Management Strategy for Solid State Transformer Interfaced DC Microgrid
by Xunwei Yu
A dissertation submitted to the Graduate Faculty of North Carolina State University
in partial fulfillment of the requirements for the degree of
Doctor of Philosophy
Electrical Engineering
Raleigh, North Carolina
2014
APPROVED BY:
________________________________ ________________________________ Dr. Alex Q. Huang Dr. David Lubkeman
Committee Chair
DEDICATION
To my parents
BIOGRAPHY
The author, Xunwei Yu, was born in Fengxin, Jiangxi Province, China. He received his B.S.
and M.S. degree from Anhui University of Science & Technology and Huazhong University
of Science & Technology, China in 2002 and 2007, respectively, both in electrical
engineering. Since fall of 2009, he started to pursue a Ph.D. degree at National Science
Foundation funded Engineering Research Center: FREEDM, Department of Electrical and
ACKNOWLEDGMENTS
I would like to thank to my advisor Dr. Alex Q. Huang for his guidance, encouragement and
support in my whole Ph.D. period. Dr. Huang’s creative thinking, broad knowledge,
insightful vision and warm character always inspire my work and study. I really appreciate
all of these and I really enjoy my five years study and work in FREEDM Systems Center.
I am very grateful to my other committee members, Dr. Mo-Yuen Chow, Dr. Srdjan Lukic
and Dr. David Lubkeman for their valuable suggestions and helpful discussions in these five
years. It is my great pleasure to work with you in my whole Ph.D. career. I would like also to
thank Dr. YiChao Wu for serving as the Graduate School Representative for my defense.
I want to thank my student colleagues who have helped with many good discussions and
gave me so much joyful time: Dr. Tiefu Zhao, Dr Xijun Ni, Dr. Xiaofeng Yang, Dr. Xiaohu
Zhou, Dr. Jun Li, Dr. Zhigang Liang, Dr. Yu Du, Dr. Gangyao Wang, Dr. Qian Chen, Dr.
Xiang Lu, Dr Ruiyang Yu, Dr. Xu She, Dr. Sanzhong Bai, Dr. Yen-Mo Chen, Dr. Zhan Shen,
Mr. Xingchen Yang, Mr. Xing Huang, Mr. Fei Wang, Mr. Kai Tan, Mr. Zhuoning Liu, Mr.
Rui Wang, Mr. Xiaoming Li, Mr. Rui Gao, Mr. Yizhe Xu, Mr. Yang Lei, Mr. Yang Xu, Mr.
Xiaoqing Song, Mr. Fei Xu, Miss. Huan Hu, Miss. Mengqi Wang, Miss. Suxuan Guo, Miss
Qi Tian.
TABLE OF CONTENTS
LIST OF FIGURES……… ...viii
LIST OF TABLES…………..….……… ...xi
Chapter 1 Introduction ... 1
1.1 Research Background ... 1
1.2 Survey of Conventional DC MG ... 4
1.2.1 Overview of DC MG Structure ... 4
1.2.2 DC MG Bus Voltage Standards ... 6
1.2.3 Overview of DC MG Power and Energy Management Strategy ... 6
1.3 DC MG in FREEDM Systems ... 13
1.4 Dissertation Outline ... 16
Chapter 2 DC/DC Converter Modeling for DC MG ... 19
2.1 DC/DC Converter Selection Applied in DC MG ... 19
2.2 DHB Large Signal Model ... 20
2.3 ZVS Operation Boundary ... 29
2.4 Small Signal Modeling for DHB ... 31
2.5 Control Algorithm for DHB... 33
2.6 Simulation and Experimental Results ... 33
2.7 Summary ... 37
Chapter 3 Distributed Energy Management Strategy for SST Interfaced DC MG ... 38
3.1 Introduction and Motivation ... 38
3.2 Description of DC MG Enabled by SST... 39
3.2.1 SST Topology ... 41
3.2.2 Converter for the PV, Fuel cell and Battery ... 42
3.3 System Energy Management ... 42
3.4 Control Algorithm Design ... 46
3.4.1 SST Control ... 47
3.4.2 Battery Control... 49
3.4.3 PV Control ... 55
3.4.4 Fuel Cell Control... 56
3.5 Case Study and Simulation Results ... 56
3.6 Summary ... 66
Chapter 4 Hierarchical Power and Energy Management for SST Interfaced DC MG ... 67
4.1 Review and Motivation ... 67
4.2 System Introduction ... 68
4.3 Primary Control ... 72
4.3.1 Primary Control Method Review ... 72
4.3.2 Primary Control Introduction ... 74
4.3.3 Primary Control Diagram ... 77
4.4 SST Control Algorithm ... 79
4.6 Tertiary Control Algorithm ... 81
4.6.1 PCC Power Flow Control by Changing SST Low DC Output Voltage ... 82
4.6.2 SOC Control by Changing SST Low DC Output Voltage ... 84
4.6.3 PCC Power Flow and SOC Management by Shifting Battery Droop Curve ... 85
4.6.4 Pros and Cons for Two Tertiary Control ... 87
4.7 Simulation and Experiment Verifications ... 87
4.7.1 Primary Control Simulation and Experiment Verifications ... 88
4.7.2 Secondary Control Simulation and Experiment Verifications... 97
4.7.3 Tertiary Control Simulation and Experiment Verifications ... 104
4.8 Summary ... 116
Chapter 5 Practical Issues for SST Interfaced DC MG ... 117
5.1 Introduction and Motivation ... 117
5.2 Power Balance Issue for SST ... 118
a) Rectifier Stage Power Balance Control ... 120
b) Distributed Power Balance Control Strategy for DC/DC Stage ... 121
5.3 BlackStart and Blackout Control ... 132
5.3.1 BlackStart ... 132
5.3.2 Blackout ... 132
5.4 Plug and Play Function ... 135
Case I: PV I Unplug and Plug in Islanding Mode ... 142
Case II: Battery II Unplug and Plug in Islanding Mode ... 145
Case III: Islanding Mode to DC Source-enable Mode... 147
Case IV: DC Source-enable Mode to Islanding Mode ... 149
5.5 Summary ... 151
Chapter 6 Conclusion and Future Work ... 152
6.1 Conclusion ... 152
6.2 Future Work ... 154
LIST OF FIGURES
Figure 1.1 World Electricity Generation. ... 2
Figure 1.2 World MG Generation Market. ... 2
Figure 1.3 Typical AC MG Diagram. ... 3
Figure 1.4 Typical DC MG Diagram. ... 3
Figure 1.5 SIC and MIC Structure of DC MG... 5
Figure 1.6 DC MG Centralized Control Diagram. ... 8
Figure 1.7 DC MG Distributed Control Diagram. ... 10
Figure 1.8 DC MG Hierarchical Control Diagram. ... 12
Figure 1.9 Part of FREEDM Systems Diagram. ... 14
Figure 1.10 FREEDM DC MG System Structure. ... 15
Figure 2.1 Topology of DHB. ... 20
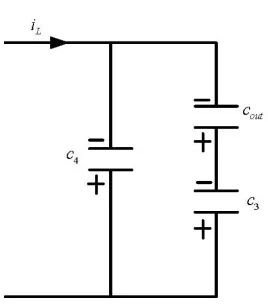
Figure 2.2 Primary-referred Equivalent Circuit of DHB. ... 21
Figure 2.3 Ideal Operation Waveform of DHB in One Switching Cycle. ... 21
Figure 2.4 Secondary Side Equivalent Circuit when S3 is On and S4 is Off. ... 24
Figure 2.5 Secondary Side Equivalent Circuit when S3 is Off and S4 is On. ... 24
Figure 2.6 Large Signal Average Model of DHB. ... 27
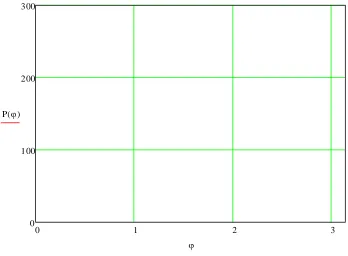
Figure 2.7 Relationship between Power and Shift Angle. ... 28
Figure 2.8 Equivalent Model for DHB. ... 28
Figure 2.9 Soft Switching Process a of S2. ... 29
Figure 2.10 Soft Switching Process b of S2. ... 30
Figure 2.11 Average Output Model and Small Signal Output Model. ... 32
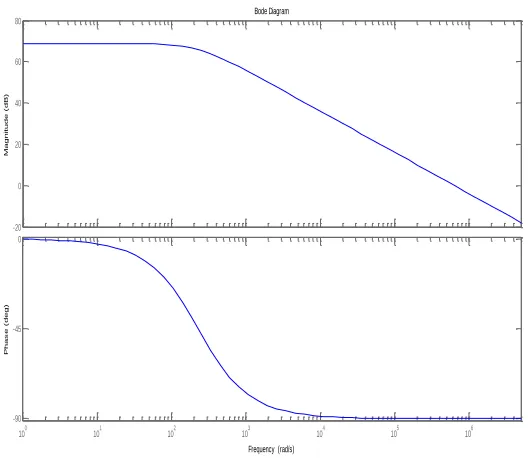
Figure 2.12 Bode Plot for Load of 100ohm. ... 32
Figure 2.13 DHB Control Diagram. ... 33
Figure 2.14 DHB Testbed. ... 35
Figure 3.1 Topology of SST. ... 38
Figure 3.2 SST Enabled DC MG. ... 40
Figure 3.3 Simplified Single Phase, Three Stage SST Topology. ... 41
Figure 3.4 SST & Battery Droop Curves. ... 43
Figure 3.5 Battery Operation Mode. ... 45
Figure 3.6 SST Rectifier Control in Single DQ Transform. ... 48
Figure 3.7 SST Low DC Voltage Side Control. ... 48
Figure 3.8 SST Inverter Stage Output Control. ... 49
Figure 3.9 Battery Control Algorithm. ... 50
Figure 3.10 Battery Control Algorithm Judgment Flow Chart. ... 52
Figure 3.11 PV Control Algorithm. ... 56
Figure 3.12 Fuel Cell Control Algorithm. ... 56
Figure 3.13 Simulation Results for Case I. ... 59
Figure 3.14 Simulation Results for Case II. ... 62
Figure 3.15 Simulation Results for Case III. ... 65
Figure 4.2 Hierarchical Control Frame. ... 70
Figure 4.3 DC Bus Power Flow. ... 71
Figure 4.4 DC MG Operation Curve Diagram. ... 75
Figure 4.5 System Equivalent Circuit in Islanding Mode... 77
Figure 4.6 Primary Control Diagram. ... 78
Figure 4.7 SST DAB Control Diagram... 79
Figure 4.8 Secondary Control Diagram. ... 80
Figure 4.9 Droop Curve Shift with Secondary Control. ... 80
Figure 4.10 DC MG PCC Power Flow Diagram. ... 81
Figure 4.11 Tertiary Control Diagram for DC MG Power Flow Control and Change SST DC Voltage to Manage Battery Status. ... 83
Figure 4.12 SST DC Voltage Changes for PCC Power Flow Control. ... 83
Figure 4.13 SST DC Voltage Changes for SOC Control... 84
Figure 4.14 Tertiary Control Diagram for DC MG by Shifting Battery Droop Curve. ... 86
Figure 4.15 Battery Curve Shift for PCC Power Flow Control. ... 86
Figure 4.16 Battery Curve Shift for SOC Control. ... 86
Figure 4.17 Simulation Results for Non-critical Load Shedding and Back. ... 89
Figure 4.18 Simulation Results for PV II Shedding. ... 93
Figure 4.19 PV and Battery Testbed. ... 94
Figure 4.20 Waveform for Load Shedding. ... 94
Figure 4.21 Waveform for PV Shedding and Back. ... 95
Figure 4.22 Simulation Results without Secondary Control. ... 98
Figure 4.23 Simulation Results with Secondary Control... 101
Figure 4.24 A Cascaded Type Three Stage SST Prototype. ... 102
Figure 4.25 Experimental Results with Secondary Control... 104
Figure 4.26 Power Information Simulation Results in First Tertiary Control Strategy... 106
Figure 4.27 Battery Current & SOC Information Simulation Results in First Tertiary Control Strategy. ... 106
Figure 4.28 SST High and Low DC Voltage Simulation Results in First Tertiary Control Strategy. ... 107
Figure 4.29 Voltage Recovery Signal, PCC Control Signal & SOC Control Signal Simulation Results in First Tertiary Control Strategy. ... 107
Figure 4.30 SST Waveform with First Tertiary Control... 109
Figure 4.31 Battery Current, DC MG Bus Voltage and SST AC Output with First Tertiary Control. ... 109
Figure 4.38 Battery Current, DC MG Bus Voltage and Control Flag with Second Tertiary
Control. ... 115
Figure 4.39 PV Waveform with Second Tertiary Control. ... 115
Figure 5.1 SST Topology. ... 117
Figure 5.2 SST Equivalent Block Diagram. ... 118
Figure 5.3 Single Phase DQ Control for Rectifier ... 120
Figure 5.4 Typical DAB Topology. ... 121
Figure 5.5 Equivalent Circuit for Two DAB in Parallel ... 123
Figure 5.6 Adaptive Droop Curve. ... 124
Figure 5.7 Adaptive Droop Control Diagram. ... 124
Figure 5.8 Simulation Results without Current Balance Control. ... 126
Figure 5.9 Simulation Results with Proposed Current Balance Control. ... 127
Figure 5.10 Input Voltage and Current. ... 129
Figure 5.11 Individual Three High DC Voltage. ... 129
Figure 5.12 Three DAB Output Currents and Low DC Voltage without Current Balance. . 130
Figure 5.13 Inverter Output Voltage, Current, High DC and Low DC Voltage... 130
Figure 5.14 Three DAB Output Currents and Low DC Voltage with Conventional Droop Control. ... 131
Figure 5.15 Three DAB Output Currents and Low DC Voltage with Adaptive Droop Control. ... 131
Figure 5.16 Equivalent System Diagram. ... 132
Figure 5.17 SST Interfaced DC MG System Blackout Flow Chart. ... 133
Figure 5.18 DC MG Supports Inverter Simulation Results. ... 134
Figure 5.19 DC MG Diagram. ... 137
Figure 5.20 Typical SCI Data Frame Format. ... 139
Figure 5.21 Plug and Play DC MG System Architecture. ... 140
Figure 5.22 HMI and Data center. ... 141
Figure 5.23 Hardware Testbed. ... 142
Figure 5.24 PV I Unplug and Plug in Islanding Mode Waveform. ... 144
Figure 5.25 Battery II Unplug and Plug in Islanding Mode Waveform. ... 146
Figure 5.26 Islanding Mode to DC Source-enable Mode Waveform. ... 148
LIST OF TABLES
Table 2-1 Simulation and Testbed Parameters. ... 34
Table 3-1 Symbols for SST Control Diagram. ... 49
Table 3-2 Symbols for Battery, PV and Fuel Cell Control Diagrams. ... 50
Table 3-3 Key Parameters for the Simulation... 57
Table 4-1 Key Simulation Parameters ... 88
Table 4-2 Hardware key parameters. ... 95
Table 4-3 Symbols for Hardware Testbed Parameters. ... 95
Table 5-1 Simulation Parameters. ... 127
Table 5-2 Customer Design Communication Protocol. ... 139
Chapter 1 Introduction
1.1 Research Background
The global demand for electric energy has increased continuously for the last few decades.
On the other way, the shortage of energy and the problems of environment have become
serious concerns in the today’s world. Alternative renewable energy sources generation, like
PV, Wind, Fuel cell and tidal power, have drawn more and more attentions in last ten years
[1]-[5]. Figure 1.1 shows the renewable energy source generation ratio in 2012 and it will
take more and more important role in the future. In 2012, 22100 terawatt-hours (Twh)
electrical power will come from the renewable energy in global electricity generation, which
is 20% of the whole electrical power. Based on Siemens prediction (Figure 1.1), in 2030, the
electrical power generated by renewable energy source is about 37100 Twh, which is 28% of
the global electrical generation [6].
Thus, how to utilize the renewable energy sources and deliver their power into the
traditional AC utility reliably based on their different features, is the hottest research topic in
recent years. The microgrid (MG) is the most promising method to integrate these various
renewable energy sources and interface them to the utility [7]-[10]. The basic idea of MG is
using the power electronics technology to construct a sub-grid, which consists of distributed
renewable energy resources (DRERs), distributed energy storage device (DESD) and the
local load. Then the power generated by DRESs and DESD will supply the local load, or be
delivered to the utility. Thus, the biggest feature of MG is that it can not only interface to the
will keep increasing and the market might be 12.7 billion at 2018, which depicts a promising
future for the MG.
converter converter converter converter PV
Wind Fuel cell Battery
PHEV washer light Air conditionControl center
Breaker Transformer
Load
Renewable Energy source Energy storage
Communication line Power line
Utility converter converter converter converter
AC Microgrid
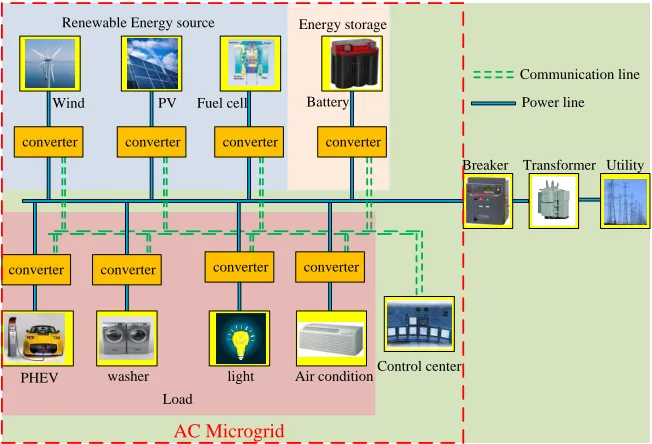
Figure 1.3 Typical AC MG Diagram.
converter converter converter converter PV
Wind Fuel cell Battery
PHEV washer light Air conditionControl center
Breaker Transformer
Load
Renewable Energy source Energy storage
Communication line Power line
Utility converter converter converter converter
DC Microgrid
rectifier
As mentioned before, MG can be considered a sub-grid which includes multiple DRERs,
DRSDs, and the load. Then, the conventional MG interfaces to the distribution system or
utility by traditional transformer. All DRERs, DESDs and load share a common bus by
converters and communication ports are embedded into the system to transit the MG
information or instructions between the control center and the local controllers for converters.
Basically, MG can be divided into two major groups based on its structure, which the first
one is the AC MG (shown in Figure 1.3) [11]-[15] and the other one is DC MG (shown in
Figure 1.4) [16]-[20]. The AC MG is the system which all devices (DRERs, DESD, load)
share a common AC bus, while the DC MG is the system which all devices connects a
common DC bus. Comparing to AC MG, DC MG has its own advantages such as:
1) higher efficiency because of elimination of multiple power conversion stages and
reduction of filter requirements;
2) better to power future homes’ DC loads, like electric vehicle (EV), light-emitting diode
(LED), projector, and etc, [21]- [24];
3) easier to integrate the renewable resources and energy storages, especially for some DC
sources like fuel cell [25]-[28], PV [29]-[31], battery [32], and etc.;
4) no harmonic and reactive power factors.
which several DRERs and DESDs share a common converter which interfaces to DC bus,
while SIC is the structure which each DRER or DESD interfaces to the DC bus by the
individual converter.
Comparing to the SIC, MIC has its own advantages, such as higher efficiency and less
devices. Three-port DC/DC converter is a typical application for MIC [34]-[40]. But its
disadvantages are obvious, like complicated circuit and control algorithm design. The SIC
which are applied in DC MG are some typical DC/DC topologies, such as buck-boost,
flyback, dual active bridge (DAB), dual half bridge (DHB), and so on. These topologies are
easy to implement. Furthermore, the corresponding control algorithm design is easy to
accomplish since it only deals with one DESD or DRER.
1.2.2 DC MG Bus Voltage Standards
Similar to AC system, the DC MG system bus voltage can be categorized into several
levels for different applications. The first major application is the DC system for data center.
A 380 V DC testbed system for data center is developed by the Lawrence Berkeley National
Laboratory (LBNL). Based on [41], 380 V DC system achieves an improvement of 4-6%
efficiency points over well designed efficient 408-208 V AC systems available today. The
second major application is the home DC appliances. In home application, the DC voltages
are divided into three levels, which are 12 or 24 V, 48 V and 120 V DC. 12 or 24 V is used
for low-power devices in interior spaces, such as lighting, sensors, routers and modems [42].
48 V is the standard voltage for the telecommunications. 120 V is defined as the upper
boundary of extra-low voltage (ELV), which is low risk under dry conditions [43].
1.2.3 Overview of DC MG Power and Energy Management Strategy
Comparing to the conventional utility, the MG is more complicated because of the
integration of multiple DRERs and DESDs. The system information is usually changing
because not only the load varies frequently, but the power generated by DRERs is not always
constant. The reason is that the DRERs output power is based on their inputs. For example,
the power generated by PV panels and wind turbine is depends on the sun irradiation and
power management is how to maintain the system’s power balance in the presence of
stochastic DRERs, DESDs and loads, especially the system is in islanding mode. When the
DC MG connects to the grid, usually, the grid is considered as infinite energy source. Thus,
the system power balance can be always guaranteed. Then the system energy management
becomes the major concern, such as how to manage the individual DRER and DESD output
power based on their different features. Basically, like AC MG, there are three basic
categories for DC MG power and energy management strategy: Centralized control,
distributed control and hybrid control or hierarchical control.
1) Centralized control
As shown in Figure 1.6, besides the traditional power line connection, a communication
line is attached between central controller and each individual local controller for DRERs,
DESDs and load. The direction of the communication line is bidirectional. It conveys every
device’s information in the system to the central controller and transits the instructions from
the central controller to the local controller. The objective of centralized controller is to
monitor the whole system operation and make the power and energy management
instructions for each device in the system based on the system information, which is coming
from the local controllers’ measurements [44]-[46]. For the local controllers, the operation
modes or the control algorithms are pre-embedded. When they receive the instructions from
central controller, the corresponding modes or the control algorithms start to operate. Since
all local controllers operations are based on the central controller’s instructions, a
high-bandwidth communications link is required and necessary to guarantee the whole system
Figure 1.6 DC MG Centralized Control Diagram.
The main advantage for this control strategy is that the system energy management can be
on the communication ports. Any malfunctions occur in the communication link might cause
the whole system fail or unstable.
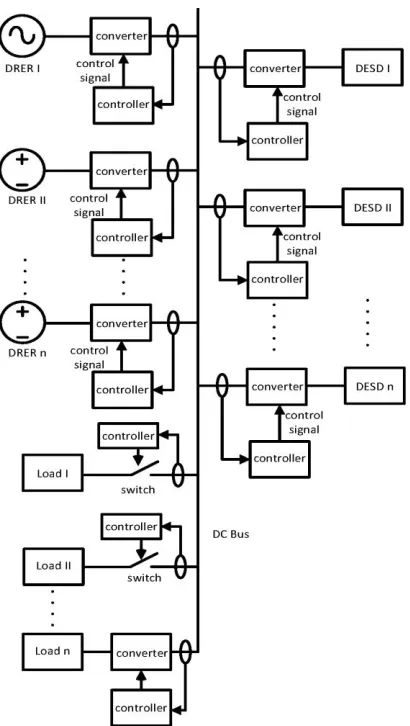
2) Distributed control
The basic idea of distributed control is that each local controller’s operation is only based
on the local information, as shown in Figure 1.7. Different from the centralized control, the
central controller is removed in the distributed control. Since all devices in the system share a
common DC bus, the DC bus voltage must be some valuable information that can be used for
the local controllers. Actually, in DC system, the DC bus voltage represents the whole
system power information. In other word, if the system power balance achieves, this voltage
will be a constant; if not, the bus voltage will vary. Thus, the bus voltage is commonly used
in distributed control and DC bus voltage signal (DBS) is the most popular method [47] -[49]
for DC MG distributed control.
Obviously, comparing to the centralized control, the system’s reliability gets upgrade. The
operation mode or control algorithm for the local controller is based on the source
characteristic and DC bus voltage instead of the instructions from communication link. When
the system information changes, the local controller will automatically make faster response
than centralized control, because the control algorithm bandwidth is usually faster than the
communication. However, there are some shortcomings for distributed control. The first is
the system energy management might be a problem because the operation for local controller
only has its individual local information but missing the system information. For instance,
the battery can only operate in one status in distributed control algorithm based on some fix
damaged, which might lead system to unstable, especially in islanding mode. If the energy
management is involved, the battery can be charged with the sacrifice of some bus voltage
drop. Unfortunately, it usually can’t be achieved without the system information involved
into the local controller. The third problem is the system maintenance. Since the whole
system monitor function is missing, the whole system has to be shut down even only one
device is damaged.
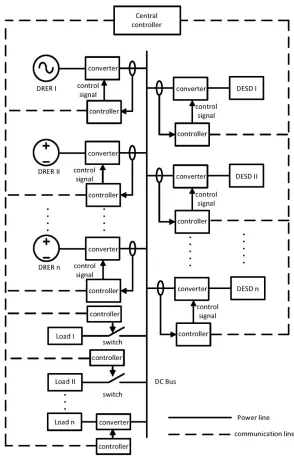
3) Hierarchical control
Hierarchical control [50] [51] is a hybrid control strategy which combines the advantages
for centralized control and distributed control. Its control diagram is shown in Figure 1.8.
Although its structure is same as the centralized control, its operation principle is different.
Same as the centralized control, the communication ports are bidirectional to deliver the
system information and instructions between central controller and local controllers.
Different from the centralized control, the control algorithm for power balance is embedded
in individual local controller and the instructions are just for the power management. Thus
the local controller still can operate by itself based on the local information liked the
distributed control, when the communication ports fail or delay. Therefore, the system power
balanced can be achieved by local controller and the system reliability gets increasing.
Furthermore, the system optimization or energy management is guaranteed because the local
controllers can also operate based on the instructions issued from the centralized controller
based on the system information. Then the requirements of bandwidth for the communication
link decreases because the requirement of time scale for energy management is slow.
Nowadays, more and more communication protocols are added into the MG system, such as
Zigbee [52], Power Line Communication (PLC) [53], Controller Area Network (CAN) [54],
and WIFI [55]. Which one is selected depends on the system design and requirement.
The major weakness of hierarchical control is hard to accomplish. Since the MG system
distributed control and the instructions coming from the centralized control is another factor
need to be considered.
1.3 DC MG in FREEDM Systems
The FREEDM Systems Center is a US National Science Foundation (NSF) generation-III
Engineering Research Center (ERC) established in 2008 with its headquarters at North
Carolina State University, US. The center’s objective is to develop the fundamental and
enabling technologies for a future power distribution system called the FREEDM system
[56].
Targeted as a future grid architecture suitable for large scale plug-and-play integration of
distributed resources, the proposed FREEDM system is depicted in Figure 1.9 and its
feasibility is based on current and future progress of power electronics technology and
information technology. The medium voltage AC grid (12.45 kV) is powered by a substation
SST (SST1) from the 69 kV transmission grid. Several distribution-level SSTs are connected
to the medium voltage system and transform the 12.45 kV to the low voltage AC (120 V) and
DC (380 V), both of whichcan thenenable the residential AC MG and DC MG. A solid state
fault isolation device (FID) is adopted to isolate the malfunction areas when the system is in
abnormal condition, such as single phase or three phase faults. Bidirectional communication
in the SSTs and FIDs deliver the system information to the control center and take the
instructions from the control center. A completely decentralized software and communication
architecture is also be researched by the center. In summary, the key features of this
innovative FREEDM system are:
2. Intelligent power management (IPM) through the use of high bandwidth SST that directly
controls medium voltage and low voltage interfaces.
3. Intelligent fault management (IFM) with ultra-fast and intelligent fault isolation
capability of the FID.
4. Intelligent energy management (IEM) via coordinated optimization and dispatch of
distributed resources.
SST1
SST2 SST3
69 KV 12.45 KV
FID 1 FID 2
120 V AC
380 V DC Residential
AC system
Residential DC system DC microgrid
AC microgrid 380 V DC Residential DC system DC microgrid
120 V AC Residential AC system AC microgrid
Communication line Power line
Control center Grid
FID 3
Figure 1.9 Part of FREEDM Systems Diagram.
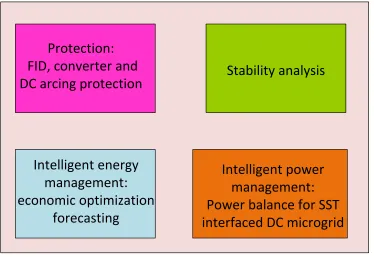
one is the intelligent energy management, including the economic optimization [59],
forecasting, and so on; the last section is the system power management. This dissertation is
focusing on the last two areas for a single SST interfaced DC MG system.
The three popular control strategies for DC MG, which are discussed in section 1.2.3, can
all be applied to the system. One major challenge for such a system is to operate each
component in a distributed fashion while maintaining system stability under all operation
conditions. This is the objective of the IPM and IFM control. The instructions from the
control center are too slow and can only be used for system monitoring, optimization and
economic operation (the IEM functions). Therefore, IPM and IEM are the major concerns
will be discussed and solved in the following chapters.
Protection:
FID, converter and
DC arcing protection
Stability analysis
Intelligent energy
management:
economic optimization
forecasting
Intelligent power
management:
Power balance for SST
interfaced DC microgrid
1.4 Dissertation Outline
The dissertation has six chapters and is organized as follows:
Chapter I introduces the DC MG background and the research objectives. The DC MG
prospect, structure and control algorithms are reviewed. Furthermore, a DC MG system
structure in FREEDM center which needs to interface to SST is proposed. The research
objective is presented.
Chapter II introduces the DHB topology, which is applied to the DC MG system for DESD
and DRER, is presented. Several corresponding factors for DHB are analyzed, including 1)
the large signal average model of DHB for system simulation is achieved; 2) ZVS procedure
and boundary of DHB for experiment are analyzed; 3) the control algorithm for DHB is
proposed; 4) the switching model for single DHB is implemented in Matlab/Simulink; 5) the
experimental results verify the ZVS procedure and the control algorithm for DHB.
Chapter III proposes a novel distributed energy management strategy without
communication for SST interfaced DC MG, which includes DRERs (fuel cell, PV) and
DESD (battery). Furthermore, SST is firstly adopted to enable the DC MG to interface AC
system and the distribution system. The proposed distributed control algorithms for SST, fuel
cell, PV and battery are also presented based on their different features. In this energy
energy management strategy, the corresponding simulation model is constructed and the
simulation results verify it.
In chapter IV, a hierarchical power and energy management strategy for SST interfaced DC
MG is proposed, which includes primary control, secondary control and tertiary control. The
primary control is based on the distributed control level to guarantee the system power
balance without communication. Furthermore, some extreme cases, like load shedding and
PV shedding, are considered and verified in primary control. The secondary control is
adopted to eliminate the voltage difference when DC MG switches from islanding mode to
SST-enabled mode and then seamless switch is achieved. Furthermore, the DC MG power
flow control and battery’s SOC management are involved into the tertiary control. If the
battery SOC in the predetermined range, tertiary control is to control DC MG output power.
Otherwise, the tertiary control objective is to manage battery operate in charge or discharge
status instead of controlling the DC MG power flow. Two tertiary control methods are
presented and investigated. One is to change SST low DC output voltage and the other one is
to manage battery droop curve. The advantages and disadvantages for these two methods are
analyzed. The simulation and experimental results verify it.
Chapter V analyzes some practical issues for the SST interfaced DC MG. The unbalanced
power issue of SST is investigated and a distributed control method is presented. Simulation
and experimental results are shown to verify it. Then the control strategy for SST interfaced
DC MG blackout is proposed and the simulation results valid it. Lastly, a DC MG with plug
and play function is proposed. A distributed control strategy is applied to the system, which
proposed and a corresponding universal communication protocol is proposed. Furthermore,
the wireless communication is added into the system to implement the system monitoring
and plug and play function implementation. A database built in MYSQL is adopted to save
the system historic data for query.
Chapter 2DC/DC Converter Modeling for DC MG
2.1 DC/DC Converter Selection Applied in DC MG
One mention is applied firstly that only DC/DC converters are considered in this chapter
since the DRERs and DESDs in the proposed DC MG are all DC sources. There are many
DC/DC converters which can be applied into the DC MG along with the power electronics
technology increasing in this decade. As mentioned in Chapter I, there are two major types
for MG structure, which one is SIC and the other one is the MIC. Here the SIC is selected
because of its advantages mentioned in chapter I. Usually, there are several basic
requirements for DC/DC converters in DC MG:
1) The converter should can be applied into both DESDs and DRERs;
2) The converter should be easy paralleled or serried since the voltage levels for input
and output of DC MG are different;
3) The efficiency of the converter should be high to avoid much energy loss;
4) When the converter plugs and unplugs from system, the system stability should be
guaranteed since the plug and play function is one of the import characteristic of
system;
5) The control of the converter should be easy to design to alleviate the system design
burden because the MG system usually consists many converters;
6) The economic factors of converters should be considered to decrease the cost;
Based on these above requirements, DHB is adopted as the DC/DC converter which applies
into the DC MG. The topology of DHB is shown in Figure 2.1. DHB, which was proposed
energy area and MG system because of its simplicity in structures and control algorithm
implementation [62]-[65]. This topology can implement the bidirectional power flow which
is necessary for the DESDs in MG. Since the DHB large signal model can equivalent to a
current source, this is easy to be paralleled. Furthermore, zero voltage switch (ZVS) is easy
to achieve to ensure the converter efficiency with appropriately circuit parameters design.
The basic idea for DHB control is phase shift control (PSC). Comparing to the dual active
bridge (DAB) topology [66]-[68], only four power electronics devices are needed. In the
latter sections of this chapter, the modeling of DHB, the design for the control algorithm, the
selection for the main circuit parameters and the efficiency evaluation are carried out.
converters which are adopted for DC MG are DHB. Thus, the large signal model for DHB is
critical. As shown in Figure 2.1, the AC terminals of DHB are connected by leaking inductor
and high frequency transformer. Figure 2.2 shows the primary-referred equivalent circuit and
its idea operation waveform in one switching cycle is depicted in Figure 2.3 [62].
Figure 2.2Primary-referred Equivalent Circuit of DHB.
Based on the Figure 2.2, equation (2.1) can be concluded
( )
L
a b
di t
L v v
dt (2.1)
Where L=Lr+Lm, Lr and Lm are the transformer leaking inductance and excitation
inductance, respectively. Based on the Figure 2.3, the equations (2.2) and (2.3) can be
deduced. 1 1 2 2
0
2
av
t
v
t
v
v
t
v
t
(2.2) 4 3 3 40
2
bv
t
v
t
v
v
t
v
t
(2.3)φ is the phase shift angle between high frequency transformer primary side and second side
drive signal. Then
1 4 1 3 3 2 4 2
0
( )
2
Lv
v
t
v
v
t
di t
L
v
v
t
dt
v
v
t
1 4 1 3 3 2 4 2 ( ) (0) 0 ( )( ) ( ) ( ) ( )( ) ( ) ( )( )
( ) 2
L L L L L v v i L v v i L i v v i L v v i L (2.5)
Based on the Figure 2.3, equation (2.6) is concluded.
(0)
( )
( )
(
)
L L L Li
i
i
i
(2.6)
Equation (2.7) can be achieved from equations (2.5) and (2.6):
1 3 1 4
1 3 1 4
1 3 1 4
1 3 1 4
(
)(
) (
)
(0)
2
(
)(
) (
)
( )
2
(
)(
) (
)
( )
2
(
)(
) (
)
(
)
2
L L L Lv
v
v
v
i
L
v
v
v
v
i
L
v
v
v
v
i
L
v
v
v
v
i
L
(2.7)When S3 is on, S4 is off, secondary side of high frequency transformer can be shown as
Figure 2.4 Secondary Side Equivalent Circuit when S3 is On and S4 is Off.
Then
3 3
( )
outL out
dv
dv
i
c
c
dt
dt
(2.8)4 4
out out
dv
dv
c
c
dt
dt
(2.9)then 3 3 out out
dv
dv
c
c
dt
dt
(2.10)
4 4
( )
(
out)
L out
dv
dv
i
c
c
dt
dt
(2.11)Define S3=1 when S3 is on, and S3=0 when S3 is off in one cycle, the following equation
can be defined based on the equations (2.8) to (2.11).
3
3 3 3
4
4 3 3
[ ( )
]
(1
)
[
( )
](1
)
out out
L out out
out out
L out out
dv
dv
dv
c
i
c
S
c
S
dt
dt
dt
dv
dv
dv
c
i
c
S
c
S
dt
dt
dt
(2.12)Usually, the capacitor selection is as
c
3
c
4
c
m, and thenv
out
v
3v
4, equation(2.13) can be concluded based on (2.12)
3 3
( ) ( )(1 )
( )
2 4
m out L L
out
c dv i S i S
c
dt
(2.13)
Based on the waveforms for DHB,
3
3 3
[ ( )
( )](
) [ (
)
( )]
( )
2
( )(1
)
( )
L L L L
L
L L
i
i
i
i
i
S
i
S
i
S
(2.14)Substituting (2.7) into (2.14), (2.15) can be yielded
1 4 3
3
1 4 3
3
(
)(2
)
( )
2
(
)(2
)
( )(1
)
2
L
L
v
v
v
i
S
L
v
v
v
Usually, the duty cycle for DHB is 0.5, therefore, (2.16) can be concluded 1 2 3 4
1
2
1
2
in outv
v
v
v
v
v
(2.16)Combine (2.13) (2.15) and (2.16), equation (2.17) can be produced
_ 2
(
)
(
)
4
8
out
eq out in in
dv
c
v
v
dt
L
fL
(2.17)Where f is the switching frequency.
Considering the voltage turn ratio, (2.18) can be concluded from (2.17).
_ 2
(
)
8
outeq out in
dv
N
c
v
dt
fL
(2.18)Where _
2
m eq out out
c
c
c
and N is the transformer turn ratio.Because of the symmetrical structures for primary and second side, the input voltage can
be given as (2.19).
_ 2
(
)
8
in
eq in out
dv
N
c
v
dt
fL
(2.19)Where _
2
n eq in out
c
Figure 2.6 Large Signal Average Model of DHB.
Where
(
2)
8
N
g
fL
As stated in the [62], the output power of DHB can be depicted as (2.20)
2
(
)
8
in out
nv v
p
fL
(2.20)Figure 2.7 shows the output power versus different phase shift angle. The maximum power
is delivered when phased shift angle equals to π/2. When the phase shift angle is greater than
zero, the power will be delivered from the primary side to the secondary side. While the
value of phase shift angle is negative, the power direction will be reversed. Thus, DHB can
be considered as an inductor interfaced by two controllable square wave voltage sources, as
0 1 2 3 0
100 200 300
P( )
2.3 ZVS Operation Boundary
To guarantee the system efficiency, it should make the converter to operate in ZVS as
much as possible [69]-[71]. The ZVS operation principle is analyzed as following. According
to the topology symmetric characteristic, only soft switching process of S2 is shown and the
same process can be applied to other switches.
The turn-on process of S2 can be divided into two statuses. The first one is that S1 is turned
off from conducting and Cs2 is conducting. In this period, Cs1, Lr, and Cs2 begin to
resonate. Cs1 starts to charge while Cs2 begins to discharge. The current direction is shown
in Figure 2.9.
The second one is that Vds_ds2 equals to zero and D2 begins to conduct, clamping
Vds_ds2 to zero. Thus, when S2 is turned on in this period, ZVS for S2 can be guaranteed.
The current direction is shown in Figure 2.10.
Figure 2.10 Soft Switching Process b of S2.
Therefore, to achieve ZVS, a certain current must charge and discharge the snubber
capacitors. Based on the analysis of S2’s turn-on process, ZVS the boundary for primary side
can be drawn as equation (2.21).
(0)
0
LIn the same theory, the secondary side ZVS boundary can be defined as equation (2.23)
because of the topology symmetry.
2
1
n
(2.23)Where n is the transformer turn ratio.
2.4 Small Signal Modeling for DHB
As shown in Figure 2.6, the output average model of DHB can be modeled as a
controllable current source, which the current value is (2 )
8 in N V fL
. Thus, the equivalent
output circuit of DHB can be depicted as Figure 2.11 (a) [72],[73]. For a given operation
condition of Vin and duty cycle, the transfer function from phase shift angle to output voltage
can be shown as equation (2.24).
2 ( 2 ) 8 out in out v N V Z fL
(2.24)
where out 1 / / 0
out
Z R
SC
, the corresponding small signal of DHB can be depicted as Figure
2.11 (b). Based on equation (2.24), the small signal of DHB from phase shift to output
voltage is the first order system. The Bode plot for simplified linear model is shown in Figure
out C 2 ( ) 8 in N V fL R out v 2 i R out v 2 i 2
( 2 )
8 in N V fL 1 out SC
(a) average output model (b) small signal output model Figure 2.11 Average Output Model and Small Signal Output Model.
Figure 2.12 Bode Plot for Load of 100ohm.
-20 0 20 40 60 80 M a g n it u d e ( d B )
100 101 102 103 104 105 106
-90 -45 0 P h a s e ( d e g ) Bode Diagram
2.5 Control Algorithm for DHB
For the DHB converter, the phase shift control is adopted while the control objective
depends on the energy source or energy storage which is on the low voltage side. Here,
battery is selected as an example while the other DESDs and DRERs’ control algorithms are
depicted in later chapters. The battery is usually the energy buffer for DC MG, thus its
control objective is to regulate its output voltage. Here, a constant voltage value (380 V) is
adopted and its control diagram is shown in Figure 2.13. First the outer loop is the voltage
control loop which the input is the difference between the output terminal DC voltage Vdcand
the reference voltage. Then the voltage error gets through the PI controller. In the DC system,
the output power is linear to the source input current when the bus voltage is regulated as a
constant if the loss is considerable small and ignored. Thus the inner loop is the current
control loop which the input is the difference between the battery output current and the
voltage control loop output (Iref). The phase shift angle (
) is achieved by the PI controller.Figure 2.13 DHB Control Diagram.
2.6 Simulation and Experimental Results
To verify the DHB topology and the control algorithm discussed above, a 500 W DHB
testbed is constructed (Figure 2.14). The simulation and testbed parameters are listed in
Table 2-1. The stable status simulation results for DHB are depicted in Figure 2.15 and the
experimental waveforms for hardware testbed are shown in Figure 2.16.
Low voltage side
High frequency
transformer
High voltage side
Driver
Driver
Sampling
Auxiliary
Power
Figure 2.14 DHB Testbed.
(a) DHB Load changes waveform (b) DHB Phase shift at small load waveform
(c) DHB Phase shift at heavy load waveform (d) DHB ZVS zoom in waveform Figure 2.16 DHB Experimental Result.
As shown in Figure 2.15 and 2.16, the simulation results and experimental results verify the
When the load increases, the phase shift gets large which is consistent to equation (2.20).
ZVS is also verified (shown in Figure 2.16(d)) which guarantees the converter’s efficiency.
2.7 Summary
In this chapter, the DHB topology, which is applied to the DC/DC converter of DC MG
system, is presented. Several corresponding factors for DHB are analyzed: 1)The large signal
average model for DHB is achieved; 2)ZVS procedure and boundary for DHB are analyzed;
3)The control algorithm for battery based on DHB is proposed; 4)The switching model for
single DHB battery is implemented in Matlab/Simulink; 5) The experimental results very the
Chapter 3Distributed Energy Management Strategy for SST Interfaced DC MG
3.1 Introduction and Motivation
The topology of the SST in FREEDM is illustrated in Figure 3.1[74]-[75]. The front-end
stage adopted cascaded multilevel rectifier with three H-bridges. Three dual active bridge
(DAB) converters are connected to each high DC link with secondary side parallel as the
DC/DC stage to step down high DC voltage to the low value. In the last stage, a single phase
inverter is to transform the low DC voltage to 120 V AC output.
hac
v
hac
i
1
hdc
v
2
hdc v
hdcN v
lac
v lac
i h
L
s
L
s
C
l
C
ldc
v
rectifier DC/DC stage (DAB) inverter
In addition, SST is also good to increase the system efficiency and interface DC and AC MG
to the traditional distribution level utility. However, DC MG also faces some challenges: 1)
how to supply sustainable and reliable power to the load or the utility; 2) how to intelligently
control each device in the system; 3) how to maximize the utilization of DESDs and DRERs
based on their different characteristics. Thus, in order to fulfill these challenges, a novel
distributed energy management strategy based on SST enabled DC MG is presented. The
main contribution of this chapter can be summarized as follows:
1) a SST-enabled DC MG system is envisioned;
2) a novel distributed energy management strategy is proposed for SST enabled DC MG;
3) several operation modes of battery are defined based on its SOC information and the
SOC is involved into the system energy management strategy;
4) dynamic power sharing between SST and DESD is investigated.
The rest of the chapter is organized as follows: In Section 3.2, the DC MG system enabled
by a single phase, three-stage SST is presented to illustrate the key feature of the proposed
system, and the topology for DESD and DRER is introduced. The system energy
management is proposed in Section 3.3. In Section 3.4, the corresponding control algorithms
for individual DESD and DRER are introduced. Typical case studies to verify the proposed
energy management are illustrated in Section 3.5. The conclusion is given in Section 3.6.
3.2 Description of DC MG Enabled by SST
The envisioned DC MG architecture enabled by SST is shown in Figure 3.2. Only DC MG
system energy management is considered here. For the AC MG enabled by the SST ac output
of system is the same as the traditional DC MG, this chapter only focuses on the
SST-enabled mode for better demonstration of the proposal.
Figure 3.2 SST Enabled DC MG.
PV, fuel cell and battery are selected as typical DRERs and DESD respectively to construct
a DC MG, and the DC bus is connected to SST low DC output terminal. SST can be
considered an interface between low voltage AC and DC systems to the distribution system.
the extra power will feed back to the utility by SST, and vice versa. More details about the
power flow will be discussed in Section 3.3.
3.2.1 SST Topology
SST is one of the newest family members of flexible ac transmission (FACTs) devices
[74]–[76]. The key idea for SST is to apply power electronics control technology and the
state of art power device technology to increase the operating frequency of the transformer
and therefore decrease its volume.
Figure 3.3 shows a simplified single phase, three-stage SST unit under the consideration.
The device limitation is not considered while higher power and voltage rating SST can be
composed by series and paralleled connection of this unit.
DC/AC inverter
120V
Distribution system
DC/DC stage (DAB) Rectifier
hdc
V Vldc
3.2.2 Converter for the PV, Fuel cell and Battery
PV, fuel cell and battery modules share a common dc bus, thus the three modules can be
modeled as the dc voltage or current sources. The DHB topology is adopted and the
modeling and control details of DHB are discussed in chapter II.
3.3 System Energy Management
The MG system information is very complicated and stochastic, for example: the output
power of PV will change as the irradiation changes; the load is not always constant; DRERs
and DESD have different dynamic responses, and so on. Therefore, to supply reliable and
high quality power to the users, the system energy management strategy should consider
these factors. Comparing to the AC MG, there is no frequency in the DC MG system, and the
bus voltage is the only information can be utilized in distributed control. The bus voltage
represents the system power information, meaning when the system has extra power, the bus
voltage will rise; when the system needs more power, the bus voltage will drop. Droop
control is adopted for both SST and battery (the droop control algorithm will be discussed in
Section 3.4). Thus the DC bus voltage, which varies in a certain range, is regulated by the
SST DC/DC stage and battery module together. In addition, to avoid DC MG operating at too
high or too low voltage, the system will enter the constant bus voltage control mode when the
voltage and frequency will drop. In the worst case, the grid will collapse. On the other side,
the battery can’t supply its maximum power to the load because its output power is defined
by its droop curve. Then, to reduce burden for AC grid and maximum the battery capacity, an
adaptive droop control is proposed with operation curve shown in Figure 3.4.
V I 380V I2 390V 400V 370V 360V A I1 B
Ib_cha_limit Ib_dis_limit
C D E F G H
Charging
Discharging
Battery droop curve SST droop curve
J K
L
Battery in current control
Battery in droop control Battery in
current control
Figure 3.4 SST & Battery Droop Curves.
380V is used as the boundary value between charging and discharging mode for SST and
battery. Charging mode for SST means that SST absorbs extra power from DC MG and
discharging mode means SST delivers extra power to the DC MG. The droop slope for SST
is chosen to be smaller than that of battery because the battery’s power rating is smaller than
SST. The traditional droop control can make battery achieve seamless switch between
rating cannot get fully utilized because the power of battery depends on the system operating
condition. To address this issue, the battery will switch to constant current control loop when
the DC bus voltage reaches a predetermined critical value. For example, when the bus
voltage is in charging mode and reaches 390 V, meaning the DRER’s output power is higher
than the load, the battery will enter the constant current charging mode (battery trajectory
jumps from point A to point B in Figure 3.4), while the SST is still in droop control. The
constant current value is the battery maximum charging current. Two consequences might
happen: the first one is that the output power of DRER is less than the sum of the load and
battery constant charging power, then the power feeding into SST will decrease and the DC
bus voltage will begin to drop until the system power reaches a new balance. For the battery
curve, it will go down vertically from point B. The second one is that if the generated power
of DRER is still higher than the sum of battery charging power and the load, the bus voltage
will keep increasing and the battery curve will go up vertically from point B. As soon as the
bus voltage reaches 400 V (point C), the SST switches to constant voltage control mode to
keep DC bus voltage at 400 V, and then the extra power will feed back into SST. To avoid
battery oscillating between two operating modes, battery can switch from current control
loop to the droop control only when the DC bus voltage drops to the 380 V (point D).
constant discharging value is the battery’s maximum discharging current. If the power
generated by the battery and DRERs is larger than the load needs, the bus voltage will be
recovered and the battery curve will go up vertically from point F; otherwise, the battery
curve will go down vertically from point F. When the DC bus voltage reaches 360V (point
G), SST will operate at constant voltage control mode to keep bus voltage at 360V, then the
extra power will be supplied by SST. Battery can only switch back to droop control when the
DC bus increases to 380V (point H) to avoid battery oscillating between two operation
modes.
Figure 3.5 Battery Operation Mode.
In addition, the operation of battery has to be determined based on its SOC, thus the SOC
has to be included in the battery control algorithm. Furthermore, due to the battery’s
bidirectional power flow nature, three basic modes are defined for the battery: Mode