Nifty Prediction using SVM
Milind Kolambe, Prof. Aparna JunnarkarPostgraduate Research Scholar, Department of Computer Engineering, PESMCOE, Pune, India
Department of Computer Engineering, PESMCOE, Pune, India
ABSTRACT: This study covers data mining methodology, Stock market parameter set based support vector machine model which is proposed to analyze stock market trend direction. In the first part this approach uses various technical indicators which are useful to discover market trend direction as well as reversal. In the next part stock market parameters those impose direct or indirect impact on stock market prices are used in support vector machine. These are used as feature vectors selection. Normalization is used to reduce the computation complexity in SVM mathematics. Next part of work is dedicated to sentiment analysis which plays very crucial role to identify impact of news and related discussion happening regarding stock prices which is useful in the prediction of stock prices. Prediction ability of SVM along with technical analysis and sentiment analysis is evaluated in percentages and hit ratio. SVM performs better than other forecasting models, proving that the proposed approach is a promising model to predict stock price prediction.
KEYWORDS: Stock trading, Data Mining, Support vector regression, technical indicators, MACD, SMA
I. INTRODUCTION
Stock market is a very complex, volatile and non-linear dynamical system [1]. So many parameters and factors have direct or indirect influence on stock market index price including politics, economic conditions, international markets etc. News and decisions made in these fields have huge impact on stock market. Also some factors like traders’ expectations, fear, greedy flow changes stock market condition. Therefore, prediction on stock market price movements is very difficult. But these movements in market prices are not random. They behave in a non-linear way. There have been many attempts using the techniques like artificial neural networks (NN) in this area. Many successful applications have been developed and all experiments reveal that ANN can be a very useful tool in time series forecasting. But some cases proved that however, ANN had some limitations in learning the patterns because stock market data contains huge noise and complex parameter set.
One newly developed technique support vector machine (SVM) introduced by Vapnik [2], [3] showed great results. There are mainly four main benefits of using SVM over NN and other prediction/classification methods. First one is that it has a regularization parameter, which allows the user to avoid over-fitting problem. Second it uses the kernel trick, so you can build in expert knowledge about the problem via engineering the kernel. Third an SVM is defined by a convex optimization problem. So there is no local minima, local minima problem for which there are effective methods. Lastly, it is an approximation to a bound on the test error rate, and there is a substantial body of theory behind it which suggests it should be a good idea.
II. RELATED WORK
motivation of this study is to propose a new prediction approach for exploring stock market movement and to test the predictability of the proposed SVM model by in terms of percentage and hit ratios. Daily closing price, high value, low values play very important role in next day price computation in stock market. Along with the stock market index value the highest quote, lowest quote, closing quote, volume, and total amount of contracts traded and the day of contract from beginning are the parameter that decides the contract current quote. The rest of the study is organized as follows. The next section includes stock market background. Section IV discusses proposed system. In section V experimental results are shown.
III.BACKGROUND
A. Technical analysis (indicators)
Largenumber of technical indicators isavailable for technical analysis. They use various statistics generated in the market like closing prices of history, volume traded etc. Earlier in 1960s and 1970s severalresearchers studied trading rules based on TIs. Though they did notfind them much profitable [8], [9] recent studies [10], [11]show that they are very useful.Commonly used TIs aresimple moving averages (SMA), exponential moving averages (EMA), moving average convergence divergence (MACD), exponential moving average (EMA) and relative strength index (RSI).
1. Simple Moving Averages (SMA)
Moving averages give smooth price data to form a trend following indicator. Though they cannot predict price direction, but rather give some ideal about the current direction with a lag. Moving averages include lag because they are computedusing past prices. Despite this lag, moving averages gives smooth price action and filter out the noise. They are also useful as the building blocks for many other technical indicators and overlays, such as bollinger bands, MACD and the McClellan Oscillator.
A simple moving average is computedas the average price of a security over a specific number of periods. Most moving averages are calculated using closing prices. A 5-day simple moving average is the five day sum of closing prices divided by five. As its name indicates, a moving average is an average that moves. Past data is averaged as new data becomes available. This causes the average to move along the time scale.
2. Exponential Moving Average (EMA)
The lag in SMA can be reduced by applying more weight to recent prices. EMA is the extension of SMA. The weighting applied to the most recent price depends on the number of periods in the moving average. There are three steps to calculating an exponential moving average. In first step simple moving average is calculated. An exponential moving average (EMA) has to start somewhere so a simple moving average is used as the previous period's EMA in the first calculation. In second step, the multiplier (weighing multiplier) is computed. Finally, the exponential moving average can be computed.
3. Relative Strength Index (RSI)
RSI was developed by J. Welles Wilder. It is a momentum oscillator [12] that measures the speed and change of price movements. RSI oscillates between zero and hundred. Traditionally according to Wilder’s calculation, RSI is said to be overbought when above 70 and said to be oversold when below 30. Signals can also be generated by looking for divergences, failure swings and centerline crossovers. RSI is useful for identifying general trend too.
4. Moving Average Convergence/Divergence Oscillator (MACD)
MACD was introduced by Gerald Appel in the seventies, the Moving Average Convergence/Divergence oscillator (MACD) is one of the simplest and most effective momentum indicators available. MACD tracks the changes in strength, direction, momentumand direction of a trend [13], [14]. The MACD turns two trend-following indicators, moving averages, into a momentum oscillator by subtracting the moving average for longer period from the moving average for shorter period. As a result, the MACD offers the best of both worlds: trend following and momentum. The MACD goes up and down with respect to the line called as zero line as the moving averages converge, cross and diverge. Someone canwatch for signal line crossovers, centerline crossovers and divergences to generate signals. Because the MACD is not bounded, it is not particularly useful for finding overbought and oversold status.
B. Support Vector Machine (SVM)
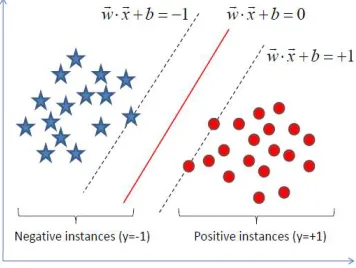
Although SVM can be applied to various optimization problems such as regression, the typical problem is to classifythe data. The basic idea is shown in figure. The data points are identified as being positive or negative, and the problem is to find a hyper-plane. This plane separates the points (data) by a maximal margin.
“Support Vector Machine” (SVM) falls under a category of supervised machine learning algorithms which can be used for both classification and regression challenges. Howeverresearchersmostly use it for classification problems. In this algorithm, we plot each data item as a point in n-dimensional space (where n is number of features you have) with the value of each feature being the value of a particular coordinate. Then, we perform classification by finding the hyper-plane that differentiate the two classes very well (look at the below snapshot).
Figure 1: Support Vector Machine
The above figure only shows the 2-dimensional case where the data points are linearly separable. The mathematics of the problem to be solved is the following [15] [16] [17]:
Above figure only shows the 2-dimensional case where the data points are linearly separable.SVM approachto linear regression amounts to (simultaneous) minimization of
-insensitive loss and minimization of the norm of linear parameters. This can be formally described by introducing (non-negative) slack variables,to measure the deviation of training samples outside
-insensitive zone. Pai et al. [18] proposed a hybrid approach with SVM and ARIMA (Autoregressive Integrated Moving Average) model and found it gave promising results.w b
w 2
1 min
,
C. Sentiment Analysis
Sentiment analysis includes identifying or discovering the sentiment trend of public and expert opinion about stock prices. Reviews are gathered from various websites whereauthors have discussion on stock’s positionfor a particular day. After collecting this information, it is processed further to discover sentiment that can be useful in identifying the trend direction and hence improving the accuracy of other prediction methods.The entire process is as follows.Sentences are brokenat characters like .or ?or ; or ! andare stored as text. Each word in the sentence is then Part-ofspeech(POS) tagged using Stanford POS tagger. According to the role of the word sentiment score may vary e.g. if it is noun or adjective etc. The words indicate sentiment score according to its impact e.g. good vs bad. All such words are processed further to compute total sentiment score.
SentiWordNet [19] lists sentiment words and theirpositive negative scores along with their parts of speech. It is used to find out particular sentiment score of every stored word. The entire sentiment is identified by summing the scores of all words splitting the sentences. As the score could be positive or negative, summing the scores of all words gives us aggregate result and hence finding out the actual overall trend. In 2013 Aparna bhat and Sowmya Kamath [20] proposed a system making the use of SentiWordNet, technical indicators and neural network to predict stock prices.
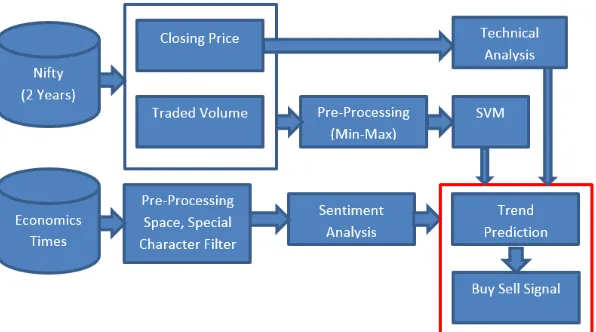
IV.PROPOSED SYSTEM
The proposed system for stock market price prediction works in 4 phases.
A. Historical Data
Stock prices can be obtained using National Stock Exchange official website for any specified period. Data is collected for the years 2015 and 2016. Data includes closing prices of the stock as well as the volume traded.
Figure 2: Proposed System Architecture
B. Technical Analysis
tune the system to find priority among various indicators to make better prediction. Technical indicators used in the proposed systems are simple moving averages (SMA), Moving average convergence and divergence (MACD) and relative strength index (RSI).
C. Support Vector Machine
Historical data has also been used as an input vector for support vector machine to predict the next day closing price. Numerical difference can gives us the prediction about the next day trend that is if the next day is going to be uptrend day or downtrend day. Prices have been normalized so that it can lies in between 0 to 1.
D. Sentiment Analysis
For sentiment analysis news and comments are fetched from indiatimes official website for the year 2015 to 2016. This information is processed using wordsentinet text files to find out sentimental score of every word said in news, comments or opinions.
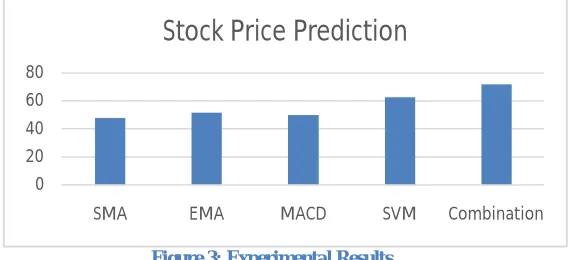
V. EXPERIMENTAL RESULTS
The proposed approach uses various methods of stock prediction and identifies if the next day is going to be of uptrend or downtrend. This means if the stock prices are going to increase or decrease in the next day. Result given by traditional tools (technical indicators) found to fair but not too much useful.
SMA gives the accuracy less than 50% whereas EMA shows the accuracy up to 52%. Though MACD is proven to be a good technical indicator to discover change in trendits accuracy found to be around 50% only. Combining all technical indicators accuracy was found to be less than 55%.
Figure 3: Experimental Results
Support vector machine gives better prediction accuracy than technical indicators and it’s the accuracy is found to be up to 62% which is really better than neural network.
Sentiment analysis gives outstanding accuracy as the trend is really a mirror of human sentiments and its impact on stock market. Sentiment analysis gives the accuracy up to 60%.
Combining the predictions made by technical indicators, SVM and sentiment analysis finally gives us the accuracy more than 70%.
0 20 40 60 80
SMA EMA MACD SVM Combination
VI.CONCLUSIONANDFUTURESCOPE
In this paper, we proposed a stock price prediction system. Though various approaches and techniques are available to increase profit in stock market investment, every methods has its advantages and limitations. Fundamental analysis really helps to find a stock's intrinsic value but it is not much profitable for short term trading. Technical indicators look to predict the future price levels by looking at past patterns and hence useful for long term trading as well as short term trading. SMA smoothen the price movement thus eliminating most fake outs but it also cause a lag in buying and selling signals. EMA reduces the lag by applying more weight to recent prices hence better than SMA in terms of recent movements in the market. Benefit of using RSI is that it immediately indicates the overbought and oversold levels to traders but since the indicator is showing momentum, as long as momentum remains strong (up or down) the indicator can stay in overbought or oversold territory for long periods of time. Therefore, price analysis or some other confirmation is still needed for reversals.The MACD indicator is a so called trend following indicator. We discovered that support vector machine gives better accuracy than neural network. Though the prediction accuracy obtained by technical indicators, support vector machine and sentiment analysis independently is not fair enough to get considerable returns for invested money, combination of these three method gives us considerable accuracy which can be used for stock market trading.
ACKNOWLEDGEMENT
A special thanks to Prof. Mrs. AparnaJunnarkar for providing invaluable guidance.
REFERENCES
[1] Abu-Mostafa YS, Atiya AF, “Introduction to financial forecasting”, Applied Intelligence 1996; 6:205–13. [2] Vapnik VN, Statistical Learning Theory, New York: Wiley, 1998.
[3] Vapnik VN, “An overview of statistical learning theory”, IEEE Transactions of Neural Networks 1999;10:988–99.6614 [4] Kim, K.J, “Financial time series forecasting usingsupport vector machines”, Neurocomputing 2003; 55:307-319
[5] Huang, Wang, Nakamori, “Forecasting Stock Market Movement Direction with Support Vector Machine”, Computers & Operations Research 2005; 32:2513-2522
[6] Yu, L., Wang, S., &Lai, K.K. Mining stock market tendency using GAbased support vector machines. Lecture Notes in Computer Science, 3828, 336–345, 2005
[7] Cao LJ, Tay FEH, “Financial forecasting using supportvector machines”, Neural Computing Applications 2001;10:184–92. [8] Alexander S. (1961), Price movements in speculative markets: trends orrandom walks, Industrial Management Review, (2), pp. 7–26.
[9] Fama E. F. and Blume M. E. (1966) Filter Rules and Stock-MarketTrading, Journal of Business, 39 (1), Part2: Supplement on SecurityPricing, pp. 226–241.
[10] Fernández-Blanco, P., Bodas-Sagi, D. J., Soltero, F. J., and Hidalgo, J. I.(2008) Technical market indicators optimization using evolutionaryalgorithms. In: Keijzer (Ed.) Proceedings of the Genetic andEvolutionary Computation Conference (GECCO’2008). New York2008. pp. 1851-1858.
[11] Bodas-Sagi, D. J., Fernández, P., Hidalgo, J. I., Soltero, F. J., Risco-Martín, J. L. (2009) Multi-objective optimization of technical marketindicators. In: Proceedings of the 11th Annual Conference on Geneticand Evolutionary Computation. GECCO’09. pp. 1999–2004. [12] J. Welles Wilder, “New Concepts in Technical Trading Systems”, ISBN0-89459-027-8, 1978.
[13] D. Moldovan, M. Moca, and S. I. Nitchi, “A stock trading algorithm model proposal, based on technical indicators signals,” InformaticaEconomica, vol. 15, no. 1, pp. 183–188, 2011.
[14] W. Brock, J. Lakonishok, and B. LeBaron, “Simple technical trading rules and the stochastic properties of stock returns,” The Journal of Finance, vol. 47, no. 5, pp. 1731–1764, 1992.
[15] S. R. Gunn, “Support Vector Machines for Classification andRegression”, ISIS Technological 1998, Dept. of Electronics andComputer Science, University of Southampton.
[16] Corinna Cortes and V. Vapnik, “Support-Vector Networks” MachineLearning, vol.20, pp. 273--297, 1995
[17] SVM - Support Vector Machines, Introduction to Support Vector Machine (SVM) Model http://www.dtreg.com/svm.htm
[19] S. Baccianella, A. Esuli, and F. Sebastiani, “Sentiwordnet 3.0: An enhanced lexical resource for sentiment analysis and opinion mining,” in Proceedings of the 7th conference on International Language Resources and Evaluation (LREC10), Valletta, Malta, May, 2010.
[20] Aparna bhat, Sowmya Kamath, “Automated Stock Price Prediction and Trading Framework for Nifty Intraday Trading”, 4th ICCCNT – 2013 July 4-6, 2013, Tiruchengode, IEEE 2013
BIOGRAPHY