ISSN 2286-4822 www.euacademic.org
Impact Factor: 3.4546 (UIF) DRJI Value: 5.9 (B+)
The effect of variance and tails of test on sample
size determination
MOHAMMED OMER ADAM1 Department of Statistics Sudan University of Science and Technology
ADIL MOUSA YOUNIS
Qassim University
AFRAA HASHIM
Department of Statistics Sudan University of Science and Technology
Abstract
When different techniques of sampling are used, there are different formulas for determination of appropriate sample size.
The aim of this study was to employ formula for determining representative sample size, when simple random sampling technique is used test from one tail and two tails. at the level of significant , depending on that, the value of test from two tails and test from one tail with variance ranging (0.1 to 2) and Standard Error , was used to obtain different sizes of samples.
Key words: sample size, variance effect, precision, random sampling, confidence interval
1. INTRODUCTION
Sample size estimation is usually conducted through a pre-study power analysis. To select a sample size for achieving a desired power of correct detection of a meaningful difference at a given level of significance (1)
If we desire to estimate, with a confidence interval, the mean of a population (µ), one of the first question arise is how large the sample should be? This question must be given serious consideration, because it is a waste of time and resources to take a larger sample than is needed for the required results. On the other hand, if the number of samples is too small it may lead to results of no practical value. The key questions are how do you want our estimate to be close to the true value? Or, how wide would we like to make the confidence interval? The second question is, how much confidence do we want to place in our interval? That is, what confidence coefficient do we wish to employ? (2).
To answer these questions may need to use the confidence interval
̅ ⁄
√ Where ⁄
√ is equal one half of the confidence interval,
accordingly question one can be answered, by the set up of the following equation:
⁄
√
⁄
Sample size estimation is referred to the calculation of required number of samples for achieving some desired statistical confidence of accuracy and reliability (2).
In many researches, sample size calculation may be performed based on precision analysis, variance of population, probability assessment or other statistical inferences) (1).
This study was focusing on the estimation of sample size depending on the effect of variance of population. In surveying studies, once data are collected, the most important objective of a statistical analysis is to draw inferences about the population using sample information, e.g. how big a sample is required?. as one of the most frequently asked questions by the investigators. If the sample size is not taken properly, conclusions drawn from the investigation may not reflect the real situation for the whole population (5).
The computer programming or computation may be effectively used to determine an appropriate sample size, as one of the most important steps in statistical studies. Sample size computation should be done appropriately because if the sample size is not appropriate for a particular study then the inference drawn from the sample may lead to some wrong conclusions (5).
assurance probability, that, the actual power exceeds the planned power. The other provides the necessary sample size , such that the expected power attains the designated power level. The suggested paradigm of adjusted sample variance combines the existing procedures into one unified framework. Numerical results may be presented to illustrate the usefulness and advantages of the proposed approaches that accommodate the stochastic nature of the sample variance. More importantly, supplementary computer programs are developed to aid the implementation of the suggested techniques. The exposition may helps to clarify discrepancy and to extend the development of sample size methodology (2). Simple regression and correlation analysis of some data collected, to test, hypotheses and make conclusions on the factors affecting the sample size for audit purposes of the internal auditors in the public sector in Kenya, was found that , materiality of audit issue, type of information available, source of information, degree of risk of misstatement, auditor skills and independence are some of the factors influencing the sample size determination for the purposes of internal audit evidence collection in public sector in Kenya (3).
2. METHODOLOGY
Table 1: Z test values
Two tails 1.96 2.58
One tail 1.645 2.33
3. RESULTS AND DISCUSSION
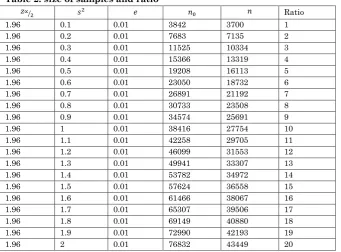
Z-test value from two tails, ⁄ with level of significance , variance values ranging from (0.1 to 2) and Standard Error were used to obtain different sizes of samples (table 2).
Table 2: size of samples and ratio
Fig 1: scatter diagram for sample sizes
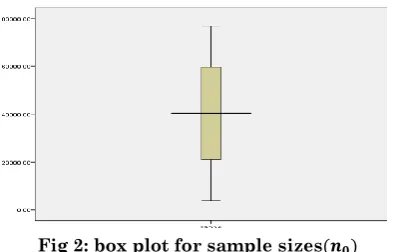
Fig 2: box plot for sample sizes
According to the obtained results in table 2 and figures (1, 2) the sample size increases, as the variance increases.
Table 3: size of samples and ratio
16 30087
43034 0.01
1.6 1.64
17 31377
45723 0.01
1.7 1.64
18 32620
48413 0.01
1.8 1.64
19 33820
51102 0.01
1.9 1.64
20 34977
53792 0.01
2 1.64
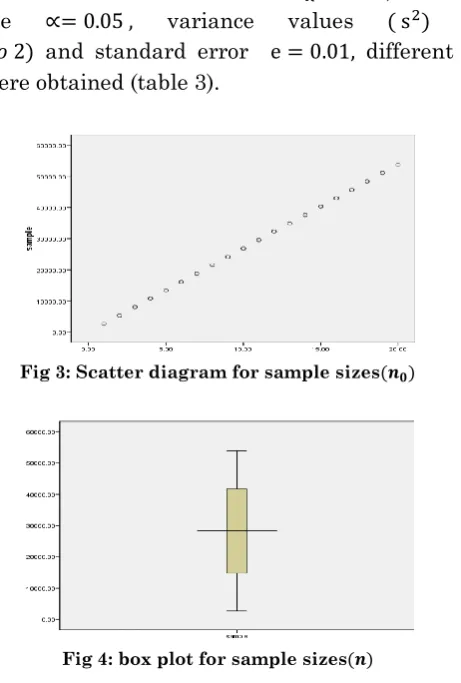
By using z-test value from one tail , with level of significance variance values ranging from and standard error different sizes of samples were obtained (table 3).
Fig 3: Scatter diagram for sample sizes
Fig 4: box plot for sample sizes
Table (4): Independent sample T test
t-test for Equality of Means
t Sig
Equal variances assumed 915.2 0.017
Equal variances not assumed 916.5 0.013
Table (4) showed that the value of t-test is (915.2) with (p-value= 0.017<0.05). According to tables (1 and 2), there is significant difference between sample sizes estimators of Z test from one tail and two tails, at the significant level 0.05.
Table 5: One-Sample Kolmogorov-Smirnov Test
⁄
Poisson Parameter Mean 4.0337E4 2.8241E4
Kolmogorov-Smirnov Z 2.236 2.236
Sig 0.000 0.000
SPSS analysis showed that, the value of chi square test is (2.236) with (p-value= 0.000< 0.05). From table (5), and depending on tables (2 and 3), we may concluded that, there is a significant goodness of fit, in cases of Z test from one tail and two tails, at the significant level 0.05.
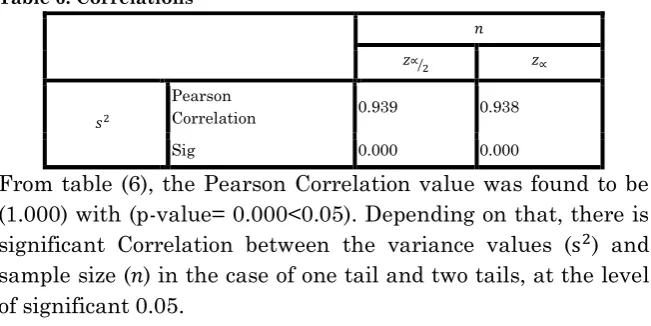
Table 6: Correlations
From table (6), the Pearson Correlation value was found to be (1.000) with (p-value= 0.000<0.05). Depending on that, there is significant Correlation between the variance values ( ) and sample size ( ) in the case of one tail and two tails, at the level of significant 0.05.
⁄
Pearson
Correlation 0.939 0.938
4. CONCLUSION
According to the obtained results we may conclude that, the sample size was affected by the increases or decreases of variance. To select appropriate sample size for any study, we need to know the hypothesis, where the test from one tail or two tails. The value of correlation between estimated sample sizes and variance when the test from two tails is equal 0.938, and equal 0.939, when, the test from one tail, may indicate the existence of the strong correlation between sample sizes and variance. In a sample surveys, it may be use test Z from two tails to giving larger sample size.
REFERENCES
1. Shein-Chung Chow, Jun Shao, Hansheng Wang, (2017), Sample Size Calculations in Clinical Research- print edition Marcel Dekker, Inc. New York.
2. Gwowen Shieh, (2013), On using a pilot sample variance for sample size determination in the detection of differences between two means, Psicológica, 34: 125-143.
3. Charles Guandaru, Kariuki, Samuel Nduati, (2012), Factors Influencing Sample Size for Internal Audit Evidence Collection in the Public Sector in Kenya Kamau.
International Journal of Advances in Management and
Economics, 1: 42-49.
4. H.K. Sarmah, B. Bora Hazrkia, G. Choudhury, (2013) An investigation on effect of bias on determination of sample size on the basis of data related to the students of schools of Guwahati, International Journal of Applied Mathematics
and Statistical Sciences2 (1):
6. Sharon L. lohr, (2010), Sampling design and analysis. Second edition-Brooks/Cole- USA
7. Paula Lagares Barreiro - Justo Puerto Albandoz – MaMaEuSch, (2001), Population and sample. Sampling techniques, International Journal of Applied Mathematics
and Statistical Sciences. 2 (1).
8. Mohd Asraf and James K. Brewer, (2004), Conducting test of hypotheses the need for an adequate Sample size, The